2080 results in Statistical Physics

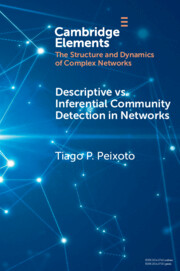
Descriptive vs. Inferential Community Detection in Networks
- Pitfalls, Myths and Half-Truths
-
- Published online:
- 04 July 2023
- Print publication:
- 31 August 2023
-
- Element
-
- You have access
- Open access
- HTML
- Export citation
Part II - Heterogeneity and Dependence
-
- Book:
- Data Science for Complex Systems
- Published online:
- 11 May 2023
- Print publication:
- 25 May 2023, pp 13-14
-
- Chapter
- Export citation
Preface
-
- Book:
- Data Science for Complex Systems
- Published online:
- 11 May 2023
- Print publication:
- 25 May 2023, pp vii-ix
-
- Chapter
- Export citation
Frontmatter
-
- Book:
- Data Science for Complex Systems
- Published online:
- 11 May 2023
- Print publication:
- 25 May 2023, pp i-iv
-
- Chapter
- Export citation
Acknowledgments
-
- Book:
- Data Science for Complex Systems
- Published online:
- 11 May 2023
- Print publication:
- 25 May 2023, pp x-x
-
- Chapter
- Export citation
Part III - Patterns and Interlinkages
-
- Book:
- Data Science for Complex Systems
- Published online:
- 11 May 2023
- Print publication:
- 25 May 2023, pp 131-132
-
- Chapter
- Export citation
Part IV - Emergence: From Micro to Macro
-
- Book:
- Data Science for Complex Systems
- Published online:
- 11 May 2023
- Print publication:
- 25 May 2023, pp 235-236
-
- Chapter
- Export citation
3 - Statistical Analyses of Time-Varying Phenomena
- from Part II - Heterogeneity and Dependence
-
- Book:
- Data Science for Complex Systems
- Published online:
- 11 May 2023
- Print publication:
- 25 May 2023, pp 88-130
-
- Chapter
- Export citation
6 - Interaction and Emergence: Agent-Based Models
- from Part IV - Emergence: From Micro to Macro
-
- Book:
- Data Science for Complex Systems
- Published online:
- 11 May 2023
- Print publication:
- 25 May 2023, pp 237-267
-
- Chapter
- Export citation
Index
-
- Book:
- Data Science for Complex Systems
- Published online:
- 11 May 2023
- Print publication:
- 25 May 2023, pp 292-294
-
- Chapter
- Export citation
Contents
-
- Book:
- Data Science for Complex Systems
- Published online:
- 11 May 2023
- Print publication:
- 25 May 2023, pp v-vi
-
- Chapter
- Export citation
4 - Pattern Recognition in Complex Systems: Machine Learning
- from Part III - Patterns and Interlinkages
-
- Book:
- Data Science for Complex Systems
- Published online:
- 11 May 2023
- Print publication:
- 25 May 2023, pp 133-178
-
- Chapter
- Export citation
Part I - Introduction
-
- Book:
- Data Science for Complex Systems
- Published online:
- 11 May 2023
- Print publication:
- 25 May 2023, pp 1-2
-
- Chapter
- Export citation
References
-
- Book:
- Data Science for Complex Systems
- Published online:
- 11 May 2023
- Print publication:
- 25 May 2023, pp 271-291
-
- Chapter
- Export citation
2 - Quantifying Heterogeneity: Classical and Bayesian Statistics
- from Part II - Heterogeneity and Dependence
-
- Book:
- Data Science for Complex Systems
- Published online:
- 11 May 2023
- Print publication:
- 25 May 2023, pp 15-87
-
- Chapter
- Export citation
1 - Facets of Complex Systems
- from Part I - Introduction
-
- Book:
- Data Science for Complex Systems
- Published online:
- 11 May 2023
- Print publication:
- 25 May 2023, pp 3-12
-
- Chapter
- Export citation
5 - Interlinkages and Heterogeneity: Network Theory
- from Part III - Patterns and Interlinkages
-
- Book:
- Data Science for Complex Systems
- Published online:
- 11 May 2023
- Print publication:
- 25 May 2023, pp 179-234
-
- Chapter
- Export citation
Epilogue
-
- Book:
- Data Science for Complex Systems
- Published online:
- 11 May 2023
- Print publication:
- 25 May 2023, pp 268-270
-
- Chapter
- Export citation

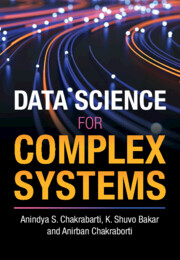
Data Science for Complex Systems
-
- Published online:
- 11 May 2023
- Print publication:
- 25 May 2023
Acknowledgments
-
- Book:
- Network Science in Archaeology
- Published online:
- 06 April 2023
- Print publication:
- 13 April 2023, pp x-xi
-
- Chapter
- Export citation

