


1. Introduction
Many prior studies have investigated the rheological behaviour of non-Brownian, hard-particle flows at low particle Reynolds numbers (Batchelor Reference Batchelor1970; Larson Reference Larson1999; Stickel & Powell Reference Stickel and Powell2005). These studies typically define the particle Reynolds number using the shear rate of the flow,  $\dot {\gamma }$, and the square of the hard-particle diameter,
  $d$, such that
  $Re= \dot {\gamma } \rho d ^2 / \mu$ where
  $\rho$ represents the fluid density and
  $\mu$ represents the fluid dynamic viscosity. For
  $Re < 1$, the stresses behave in a Newtonian manner with the shear stress,
  $\tau$, which depends on the effective viscosity of the liquid–solid flow,
  $\mu _{e}$, such that
  $\tau = {\mu }_{e} \dot {\gamma }$; the ratio of the flow effective viscosity to the fluid dynamic viscosity is the relative viscosity,
  $\mu _r = {\mu }_{e} / \mu$. Under dilute conditions, typically
  $\phi < 0.05$, the particles are spaced far enough apart that the particulate flow is not influenced by the other particles; hence, the relative viscosity is only dependent on the suspension solid fraction,
  $\mu _r = 1 + 2.5 \phi$ (Larson Reference Larson1999). At higher solid fractions, the hydrodynamic interactions between particles increase, which results in an increase in particle stress, and the relative viscosity shows an increased dependence on the solid fraction. Several semi-empirical relations have been introduced, such as the Eilers and the Krieger–Dougherty (KD) relative viscosity models or the more recent expression by Boyer, Guazzelli & Pouliquen (Reference Boyer, Guazzelli and Pouliquen2011). The relative viscosity expressions depend on the maximum solid fraction for a sheared suspension,
  $\phi _m$. As
  $\phi$ approaches
  $\phi _m$, the relative viscosity is sensitive to minor changes in solid fraction and the models predict some differences in
  $\mu _r$ (Stickel & Powell Reference Stickel and Powell2005; Boyer et al. Reference Boyer, Guazzelli and Pouliquen2011).
Beyond low-Reynolds-number suspensions, there are many industrial and geological scenarios in which inertial effects become important. Examples include the processing of biomass slurries (Stickel et al. Reference Stickel, Knutsen, Liberatore, Luu, Bousfield, Klingenberg, Scott, Root, Ehrhardt and Monz2009) with particles from micrometres to millimetres, rapid debris flows involving soil, clays and rocks (Iverson Reference Iverson2012), and transport of proppant slurries in hydraulic fracturing applications (Osiptsov Reference Osiptsov2017). Compared with low-Reynolds-number suspensions, there is sparse experimental data involving moderate Reynolds numbers. Hence, additional experimental measurements on moderate-Reynolds-number suspensions are crucial in modelling and validating the relationships.
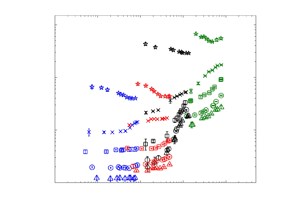
Figure 1 shows a regime map in terms of the particle Reynolds number,  $Re$, and the suspension solid fraction,
  $\phi$; the experimental studies considered rheological properties of neutrally buoyant suspensions. The map does not include the many prior studies for suspensions in which particle Reynolds numbers are negligible with
  $Re< 10^{-3}$. The map includes two non-Brownian experimental studies at slightly higher Reynolds number (
 $10^{-3} < Re < 0.1$). One is the experiments by Acrivos, Fan & Mauri (Reference Acrivos, Fan and Mauri1994) involving particles that are 0.13 mm, larger than the particle size typically used in experiments of suspensions. Their results show shear thinning behaviour, which the authors attribute to particle settling caused by a slight mismatch (less than 3 %) in the fluid and particle densities. By accounting for the settling, the measured effective viscosities compare well with relationships at low
  $Re$. Experiments conducted by Boyer et al. (Reference Boyer, Guazzelli and Pouliquen2011) cover the rheological transition from a suspension to a granular flow. Although the study used relatively large particles (0.58 and 1.1 mm), the Reynolds numbers are small due to the highly viscous suspending fluid. Their results are consistent with relative viscosity models such as Eilers and KD. Other recent experiments investigate the impact of particles on Taylor–Couette flows (Majji & Morris Reference Majji and Morris2018; Ramesh, Bharadwaj & Alam Reference Ramesh, Bharadwaj and Alam2019; Dash, Anantharaman & Poelma Reference Dash, Anantharaman and Poelma2020; Moazzen et al. Reference Moazzen, Lacassagne, Thomy and Bahrani2022); although some of these studies include torque measurements, the focus of the investigations involves the impact of particles on the transition process.

Figure 1. Regime map of experimental studies for rheological properties of neutrally buoyant dense suspensions in terms of particle Reynolds number,  $Re$, and solid fraction,
  $\phi$.
At higher  $Re$, the map includes one set of experiments by Bagnold (Reference Bagnold1954) and the experimental study by Tapia et al. (Reference Tapia, Ichihara, Pouliquen and Guazzelli2022). A prior analysis of the Bagnold experiments showed that the design of the rheometer and the conditions under which it was operated created secondary flows that increased the measurements of stress significantly (Hunt et al. Reference Hunt, Zenit, Campbell and Brennen2002). The critical flow parameter, often referred to as the Bagnold number, marked the change from a simple shear flow to an azimuthal flow with end-plate vortices; hence, the transition was not caused by the inertial effects of the particles. In the regime map, only one set of experimental measurements at
  $\phi = 0.56$ is included, which was done at Reynolds numbers low enough that the secondary flows did not impact the rheological measurements. The experiments by Tapia et al. (Reference Tapia, Ichihara, Pouliquen and Guazzelli2022) involve flows in a constant-volume parallel plate rheometer for
  $\phi$ from 0.52 to 0.58 and flows with a constant normal stress for
  $\phi$ from 0.54 to 0.62. At low Reynolds numbers, the measurements are consistent with models based on effective viscosity. At the highest rotational speeds, the torque shows an increasing dependence on the speed; however, flows in a parallel-plate rheometer can also develop secondary flows beyond a critical speed (Ellenberger & Fortuin Reference Ellenberger and Fortuin1985; Hunt & Zenit Reference Hunt and Zenit2024).
The other studies in the figure involve prior work at Caltech (Koos et al. Reference Koos, Linares-Guerrero, Hunt and Brennen2012; Linares, Hunt & Zenit Reference Linares, Hunt and Zenit2017) using the same outer-rotating rheometer; with this type of rheometer,  $Re$ measurements for circular Couette flow extend to a higher range as compared with a rheometer with an inner rotating cylinder. Both of these prior studies focused on measuring the shear stress for neutrally buoyant suspensions under conditions in which inertial effects are important. The study by Koos et al. (Reference Koos, Linares-Guerrero, Hunt and Brennen2012) covered
  $Re$ from 18 to 780 for
  $\phi$ from 0.077 to 0.64 and involved particles of different shapes and sizes. In the study, the normalised torques were independent of
  $Re$; this result was surprising. Based on particle velocity measurements near the inner stationary wall of the rheometer, it was found that the smooth walls resulted in considerable particle slip (Barnes Reference Barnes1995). Although the torque magnitude increased with solid fraction, the torques could be modelled with an effective viscosity even at high Reynolds numbers. The more recent study by Linares et al. (Reference Linares, Hunt and Zenit2017) considered a wider range of Reynolds numbers and introduced roughness by gluing particles to the rheometer walls; the glued particles were of the same size as the particles used in the suspension. Those experiments used a single particle size and two fluids of different viscosity. For the more viscous interstitial fluid covering
  $3< Re<80$, the relative viscosity increased with
  $Re$ for
  $\phi =0.1$ to 0.3. At higher solid fractions, the data showed some shear thinning behaviour. For the less-viscous fluid with
  $80 < Re < 1000$, the data showed that the normalised torque increases with
  $Re$; most data in this
  $Re$ regime corresponded with conditions in which the suspensions had transitioned to turbulence.
Although not shown in the regime map, several simulations studied the viscous and the inertial effects in neutrally buoyant particulate flows to determine the total stress in terms of  $\phi$ and
  $Re$ (Kulkarni & Morris Reference Kulkarni and Morris2008; Picano et al. Reference Picano, Breugem, Mitra and Brandt2013; Yeo & Maxey Reference Yeo and Maxey2013; Haddadi & Morris Reference Haddadi and Morris2014; Rahmani, Hammouti & Wachs Reference Rahmani, Hammouti and Wachs2018; Zhou & Prosperetti Reference Zhou and Prosperetti2020; Yousefi et al. Reference Yousefi, Costa, Picano and Brandt2023). The recent paper by Zhou & Prosperetti (Reference Zhou and Prosperetti2020) summarises these numerical studies, which cover
  $\phi$ from 0.05 to 0.38 and particle Reynolds number from 0.02 to 40. These particle-resolved simulations involve different numerical methods, different boundary conditions, varying numbers of particles and different sizes of shear cells. The properties are calculated by averaging the stresses over a representative volume that includes fluid and solid phases. These simulations are valuable in understanding the different contributions to the overall stresses, including the suspension stresslet, the Reynolds stresses in the flow, as well as the particle acceleration (Batchelor Reference Batchelor1970; Kulkarni & Morris Reference Kulkarni and Morris2008; Zhou & Prosperetti Reference Zhou and Prosperetti2020). The results show that for shear flows with neutrally buoyant suspensions, the relative viscosity begins to increase in comparison with the low-Reynolds-number results as the
  $Re$ increases above one. As found in Rahmani et al. (Reference Rahmani, Hammouti and Wachs2018), the particle phase stress increases with particle Reynolds number and solid fraction; at
  $Re=20$ and
  $\phi = 30\,\%$, the particle phase shear stress plays a dominant role because of the shearing of the liquid in the small spaces between particles, whereas the Reynolds stresses and the contact forces do not contribute significantly. The work by Zhou & Prosperetti (Reference Zhou and Prosperetti2020) also includes the contributions from particle collisions, which becomes important as the inertia is increased.
The current study aims to further extend the experimental Reynolds number measurement to previously untested  $Re$ regions. The experiments involve two different sizes of particles with spherical and nearly spherical shapes in millimetre scale and two different fluids with varying viscosities. The experimental measurements show that the traditional
  $Re$ used in shear flows of suspensions,
  $Re$, which depends on
  $d^2$, may not be the best scaling variable to correlate the moderate-Reynolds-number measurements. As an improvement, the current results are presented in terms of the newly proposed Reynolds number,
  $Re^\prime$, which is based on the maximum liquid–solid flow velocity, and linearly on the diameter of the particle. Although
  $Re ^{\prime }$ is not typically used in sheared suspension studies, it is the Reynolds number most commonly used to examine the flow field and drag on an isolated sphere. As the inertia of the flow increases, velocity fluctuations and velocity differences between the solid and liquid phases are expected to impact the suspension stresses. As a result, this paper proposes rheological models using
  $Re^\prime$ and
  $\phi$ and presents a comparison with recent simulations found in the literature.
2. Experimental methods
The Caltech coaxial rheometer is designed to study liquid–solid flows with millimetre-sized particles for conditions spanning laminar to turbulent flows. Prior studies have used the same rheometer, as found in Koos et al. (Reference Koos, Linares-Guerrero, Hunt and Brennen2012) and Linares et al. (Reference Linares, Hunt and Zenit2017). Relative to the prior studies, the current instrumentation has been upgraded to improve the experimental repeatability and measurement accuracy using a new data acquisition (DAQ) system including reaction torque sensors. In addition, pure fluid experiments are conducted over five fluid viscosities; the suspension experiments involve two fluid viscosities and two sizes of neutrally buoyant particles to increase the  $Re$ regime (Song Reference Song2022).
Figure 2 presents the schematic for the Caltech coaxial rheometer consisting of an outer-rotating cylinder and fixed inner cylinder. The outer rotating drum is connected to an electric motor by a rubber belt. The electric motor driving the outer cylinder has nine levels of rotational speed. There are three inner subcylinders: the free-rotating middle measurement cylinder and the top and the bottom fixed subcylinders. Both the bottom and the top subdrums are stationary to reduce the impact of secondary flows from the corners (Hunt et al. Reference Hunt, Zenit, Campbell and Brennen2002). The middle measurement cylinder of height,  $H=0.11$ m, measures the torque of the suspension. A central shaft supports the middle measurement cylinder so that it can rotate freely; there are gaps of approximately 1 mm between the measurement cylinder and the upper and lower stationary cylinders to allow the middle subcylinder to rotate freely and to prevent the entrance of particles sheared in the annulus. A calibrated reaction torque sensor installed above the rheometer constrained the middle measurement cylinder. Ball bearings are installed between the outer drum and the stationary inner subcylinders to facilitate the rotation. The particulate flows in the rheometer annulus are sheared by the rotational outer cylinder. The current experimental design allows the real-time direct torque measurement at the middle measurement cylinder without subtracting the bearing friction or other ancillary fluid losses, as has been done in other studies (Bagnold Reference Bagnold1954; Savage & McKeown Reference Savage and McKeown1983). The DAQ system including reaction torque sensors replaced the prior system that used springs attached to the central shaft of the rheometer (Koos et al. Reference Koos, Linares-Guerrero, Hunt and Brennen2012; Linares et al. Reference Linares, Hunt and Zenit2017). The torque measurements ranged from 0.01 to
  $5.6\ {\rm N}\ {\rm m}$ with a resolution of the torque sensor of
  $0.0014\ {\rm N}\ {\rm m}$. The range of the measured shear stress is from 0.54 to 302 Pa.

Figure 2. The outer-rotating Caltech coaxial rheometer. The rheometer and the dimensions are shown without the roughened surfaces. The schematic is from Linares et al. (Reference Linares, Hunt and Zenit2017).
The upper guard cylinder and the middle measurement cylinder can also be removed and replaced with a transparent inner cylinder. This transparent cylinder allowed for visualisation of the flow, especially for particles close to the inner cylinder, which can be recorded using a high-speed camera (Song Reference Song2022). Observations of the flow for a range of flow conditions showed an overall tangential movement of the particles with no large-scale toroidal motion.
The current experiments use two types of particles: polystyrene spheres with an average diameter  $d = 1.27 \pm 0.01$ mm for
  $b/d=19.6$ and density
  $\rho = 1050\ {\rm kg}\ {\rm m}^{-3}$ and nearly spherical styrene acrylonitrile (SAN) particles with an effective diameter
  $d= 3.22 \pm 0.02$ mm for
  $b/d=7.73$ and
  $\rho = 1050\ {\rm kg}\ {\rm m}^{-3}$. For the neutrally buoyant experiments at
  $20\,^\circ {\rm C}$, the study uses a 18 % glycerol–water mixture (
 $\mu = 1.84 \times 10^{-3}\ {\rm N}\ {\rm s}\ {\rm m}^{-2}$) and a higher-viscosity 51 % glycerol–ethanol mixture (
 $\mu = 2.90 \times 10^{-2}\ {\rm N}\ {\rm s}\ {\rm m}^{-2}$) (Ernst, Watkins & Ruwe Reference Ernst, Watkins and Ruwe1936; Cheng Reference Cheng2008). Elliptical polystyrene particles with an effective diameter of 3.34 mm are used to roughen the surface walls to reduce particle slip near wall surfaces. The elliptical particles are glued on the thin vinyl sheets, which cover the annulus surface. With roughness, the annulus dimensions are
  $r_o=18.72$ cm and
  $r_i=16.22$ cm giving a gap width of
  $b=r_o-r_i =2.49$ cm.
The rotational speed,  $\omega$, is measured by a laser sensor that detects the light reflected off eight targets equally spaced on the outer cylinder surface. The rotational speed is used to determine the shear rate at the inner cylinder with
  $\dot {\gamma } = 2 \omega {r_o}^2 / ({r_o}^2 -{r_i}^2)$. The rotational speed of the motor ranged from approximately 1.3 to
  $16\ {\rm rad}\ {\rm s}^{-1}$ with shear rates from 10 to
  $130\ {\rm s}^{-1}$. There is some variation in the minimum speed to operate under steady-state conditions due to the varying rotational friction caused by the different solid fractions of the particulate flow. To ensure that the torque is large enough to be measured accurately by the torque sensor, the minimum shear rate was approximately
  $15\ {\rm s}^{-1}$ for the l0 % solid fraction in the low-viscosity liquid. At low speeds and 50 % solid fraction, the shearing of the packed bed caused the bed to dilate, creating an increase in stress on the walls. For steady-state operation, it was not possible to operate the motor at the lowest speeds; this issue was more pronounced for the larger SAN particles. Hence, the minimum value of the shear rate increased to approximately
  $33\ {\rm s}^{-1}$ for low-viscosity fluid and
  $23\ {\rm s}^{-1}$ for the high-viscosity fluid for
  $\phi =0.5$.
The torque measurements are made under steady-state conditions with each data point averaged over at least five individual experimental measurements. For each experimental measurement set for either a pure fluid or a suspension, the measurements are taken under both conditions in which the rotational speed is increased from the lowest to the highest setting and the rotational speed is decreased from the highest to the lowest speed setting. For the same pure fluids or particulate flow set-up, the torque measurements with either increasing or decreasing rotational speed are repeatable at the specified shear rate. The liquid density and the fluid temperature were recorded to determine the fluid properties. To ensure the suspensions are neutrally buoyant, the fluid temperature is monitored and controlled throughout the experiment. The error bars presented in this study correspond to the standard deviations of the normalised torque in the experiment, as well as the measurement uncertainty. The largest uncertainties are at lower shear rates due to variations in the motor rotational speed and the limitation of torque sensor resolution that led to larger error bars at lower Reynolds numbers.
3. Pure fluids measurements and transition to turbulence
The first set of experiments involves torque measurements for liquids without particles using the rheometer with roughened inner and outer walls. The experiments using pure fluids extend the torque measurements in the Caltech outer-rotating rheometer to previously untested gap Reynolds numbers ( $Re_b$) regime and provide a test case for the measurement accuracy; the experiments also determine the conditions under which the flow transitions to turbulence. The experiments use five different fluids including pure water, water–glycerol mixtures and an ethanol–glycerol mixture spanning viscosities from
  $1.00 \times 10^{-3}\ {\rm N}\ {\rm s}\ {\rm m}^{-2}$ to
  $6.72 \times 10^{-2} \ {\rm N}\ {\rm s}\ {\rm m}^{-2}$ for fluid properties under
  $20\,^\circ {\rm C}$.
Figure 3 shows the direct torque measurement,  $M$, normalised by the torque considering a laminar flow,
  $M_{lam}$, with respect to gap Reynolds number,
  $Re_b = \rho \omega r_o b / \mu$, depending on the annular gap width,
  $b=r_o - r_i$. The values of
  $Re_b$ span from 300 to
  $8\times 10 ^{4}$. The theoretical laminar torque is computed using,
  $\dot {\gamma }$, the shear rate at the inner cylinder (Schlichting Reference Schlichting1951):
 \begin{equation} M_{lam} = 2 {\rm \pi}\mu H {r_i}^2 \dot{\gamma}. \end{equation}
As found in the figure for liquid mixtures of the 51 % glycerol–ethanol and 77 % glycerol–water, the torque ratios,  $M/M_{lam}$, are close to 1, which are consistent with the theoretical laminar flow; the torque measurements at the lowest shear rate are close to the resolution of the reaction torque sensors, which increases the measurement uncertainty. The measurements of the 50 % water–glycerol mixture cover a
  $Re_b$ range from
  $3.69\times 10^3$ to
  $1.19\times 10^4$ and span the laminar–turbulent transition. The normalised torque begins to deviate from the theoretical laminar value around
  $Re_b \approx 6.5\times 10^3$, which is smaller than the value found by Koos et al. (Reference Koos, Linares-Guerrero, Hunt and Brennen2012) using smooth walls and a slightly larger gap. The fully turbulent Reynolds number is
  $Re_b \approx 1.1 \times 10^4$, which is consistent with other studies (Taylor Reference Taylor1936a,Reference Taylorb; Coles Reference Coles1965; Linares et al. Reference Linares, Hunt and Zenit2017). Figure 3 shows the experimental values of the critical
  $Re_b$ and the fully turbulent
  $Re_b$. The figure also presents the data for water and the fluid mixture of 28 % glycerol/72 % water with
  $Re_b$ ranges of
  $6.02\times 10^3\unicode{x2013}3.17\times 10^4$ and
  $1.33\times 10^4\unicode{x2013}7.49\times 10^4$. The majority of measurements are beyond the critical
  $Re_b$. Experimental results were repeated multiple times; results were unchanged independent of an increase or decrease of the speed between data points.

Figure 3. The ratio of the direct measurement of the torque,  $M$, to the laminar torque,
  $M_{lam}$, with respect to the gap Reynolds number,
  $Re_b$, for water, the 51 % glycerol–ethanol mixture, and the 28 %, 50 %, 77 % glycerol–water mixtures. The solid line in black corresponds to the theoretical laminar value of
  $M/M_{lam}$ considering smooth walls. The dashed line in black represents the critical
  $Re_b$. The dashed line in red corresponds to the fully turbulent
  $Re_b$. The solid line in red is the fitting curve (
 $M/M_{lam}=0.020 {Re_b}^{0.66}$) for the turbulent measurements.
For an outer rotating cylinder at low speeds, the flow is an azimuthal laminar flow including weak Ekman vortices caused by the no-slip conditions at the stationary end plates (Coles & VanAtta Reference Coles and VanAtta1966; VanAtta Reference VanAtta1966; Linares et al. Reference Linares, Hunt and Zenit2017). As the rotational speed is increased, the strength of the vortices increases and turbulence begins to develop at the corners of the annulus with the breakdown of the vortices (VanAtta Reference VanAtta1966; Ravelet, Delfos & Westerweel Reference Ravelet, Delfos and Westerweel2010; Linares et al. Reference Linares, Hunt and Zenit2017). As a result, turbulence can form at the corner and not be detected by the middle testing subcylinder until the turbulent flow fills the entire annulus (see figure 2). The transition to turbulence contributes significantly to the measured torque. The sudden rise of  $M/M_{lam}$ is similar to observations of the intermittent turbulent regions and catastrophic transition as described by VanAtta (Reference VanAtta1966). The
  $M/M_{lam}$ measurements for pure water and the mixture of the 28 % glycerol/72 % water compare well beyond the critical
  $Re_b$. At the highest rotational speed, the
  $M/M_{lam}$ value for the fluid mixture of the 28 % glycerol/72 % water is roughly 18 times larger than the value of the laminar flow. At the maximum rotational speed, the
  $M/M_{lam}$ value for pure water is roughly 31 times larger than the value of the laminar flow. For
  $Re_{b}$ of
  $6.02\times 10^3$, there exists an outlier measurement point for the 28 % glycerol/72 % water results with normalised torque substantially higher than the corresponding 50 % glycerol–water measurement. This observation of both laminar and turbulent states at the same Reynolds number is consistent with the experiments by Coles (Reference Coles1965) and by VanAtta (Reference VanAtta1966) on flow hysteresis in Taylor–Couette systems. Presumably, the data for the 28 % glycerol/72 % water mixture could relaminarise at lower Reynolds numbers provided that the speed of the motor could be decreased further. The results in the fully turbulent regime are best fit using the equation
  $M/M_{lam}=0.020 {Re_b}^{0.66}$; hence, the torque for turbulent flow increases with the shear rate to the 1.66 power,
  $M \propto \dot { \gamma } ^{1.66}$, similar to that found in the earlier study by Linares et al. (Reference Linares, Hunt and Zenit2017).
4. Rheological measurements and transition to turbulence
To investigate the effects of increasing fluid and particle inertia on the rheological properties, the torque measurements were made over a range of Reynolds numbers using neutrally buoyant particles with two different sizes, a 1.27-mm polystyrene particle and a 3.22-mm SAN particle, and using two different fluid viscosities, an 18 % glycerol–water fluid mixture (GW) and a 51 % glycerol–ethanol (GE) fluid mixture. Figure 4 presents the direct torque measurements normalised by the theoretical laminar torque in terms of  $M/M_{lam}$ for both sets of polystyrene and SAN particles immersed in the higher-viscosity fluid with respect to
  $Re_b$ for solid
  $\text {fractions} = 0.1$, 0.2, 0.3, 0.4 and 0.5, covering a
  $Re_b$ range from 186 to
  $3.08\times 10^3$; the figure also includes the pure fluid result at the laminar state. The gap Reynolds numbers for both particles are below the critical
  $Re_b$ for pure fluids. Since the direct measurement for this experimental study is torque, the results are presented as the torque ratio,
  $M/M_{lam}$, instead of relative viscosity,
  ${\mu }_{e}/{\mu }$. When inertial effects are negligible, the torque ratio is equivalent to the low-Reynolds-number relative viscosity assuming a homogeneous distribution of particles,
 \begin{equation} M/M_{lam}= {\mu}_{e}/ \mu\quad \textrm{as }\quad Re \rightarrow 0. \end{equation}
There are several models for the relative viscosity. The KD model is a function of the ratio of  $\phi$ to the maximum shearable solid fraction,
  $\phi _m$, as follows:
 \begin{equation} \mu_{e} / \mu = \mu _r ( \phi , \phi_m) = (1-\phi/\phi_{m})^{{-}a}. \end{equation}
The exponent,  $a$, is often related to the product of the intrinsic viscosity, [
 $\eta$], and
  $\phi _m$ such that
  $a = [ \eta ] \phi _m$ with
  $[ \eta ] = 2.5$ for spheres (Larson Reference Larson1999; Stickel & Powell Reference Stickel and Powell2005). Here
  $a$ is fixed at
  $a=1.82$, a value that has been used in other neutrally buoyant suspension experiments (Matas, Morris & Guazzelli Reference Matas, Morris and Guazzelli2003; Linares et al. Reference Linares, Hunt and Zenit2017). The values of
  $\mu _r$ are found in table 1 for
  $\phi _m = 0.58$ and
  $\phi _m = 0.68$.

Figure 4. The ratio of experimental torque measurements,  $M$, to the torque of laminar flow,
  $M_{lam}$, with respect to
  $Re_b$, for large SAN particles and small polystyrene particles suspending in the 51 % glycerol–ethanol fluid mixture for
  $\phi$ from 10 % to 50 %. The black dash-dotted lines correspond to
  $\mu _{r}$ values using
  $\phi _{m} = 0.58$ and
  $\phi$ from 10 % to 50 %. The dotted lines in red correspond to
  $\mu _{r}$ values using
  $\phi _{m} = 0.68$ and
  $\phi$ from 0.1 to 0.5.
Table 1. Summary of the KD relative viscosity model and the fitting results of the measurements before the turbulent transition. The fitting results presented in figure 6 correspond to the  $Re$ region from 10 to 100. The fitting models presented in figure 7 correspond to
  $Re^\prime$ from 100 to 400.

For the solid fractions of 10 %, 20 %, 30 % and 40 %, the  $M/M_{lam}$ values of the polystyrene particles are constant until
  $Re_b \approx 2.2\times 10^3$, and then the ratios increase slightly for
  $2.2\times 10^3 < Re_b < 3\times 10^3$. For the same range of
  $Re_b$, the
  $M/M_{lam}$ values considering the larger SAN particles show an increased dependence on
  $Re_b$; the SAN measurements are roughly 80 %, 48 % and 47 % larger than the measurements of the small particles at the largest rotational speed for
  $\phi =0.1$, 0.2 and 0.3. For
  $\phi = 0.1$, the SAN measurements are greater than the polystyrene measurements for all
  $Re_b$. For
  $\phi = 0.4$, the SAN measurements show some increase as
  $Re_b$ increases, but the results then show a plateau. For
  $\phi =0.4$ and
  $Re_b$ around
  $2.3\times 10^3$, the SAN measurements are approximately 35 % greater than the polystyrene measurements.
Figure 4 also includes (on the left-hand side of the image) the values of  $\mu _r$ for
  $\phi _m = 0.58$ and 0.68, which do not depend on
  $Re_b$. For
  $\phi = 0.3$ and 0.4, the
  $M/M_{lam}$ values for the small polystyrene particles at the lowest values of
  $Re_b$ correspond well with
  $\mu _r$ for
  $\phi =0.58$. For
  $\phi = 10\,\%$ and 20 %, the
  $M/M_{lam}$ values correspond better with
  $\mu _r$ using
  $\phi _m = 0.68$, although the measurement for
  $\phi = 10\,\%$, are lower than that value. The difference appears to be linked to the roughness of the walls, which is considerably larger than the polystyrene particles. As a result, the polystyrene particles are small enough to become trapped in the interstices of the larger wall particles. Hence, the number of small particles in the central region of the rheometer decreases and the solid fraction for the bulk of the flow is lower, leading to a smaller torque and a decreased effective viscosity. Therefore, the ratio
  $\phi / \phi _m$ using
  $\phi _m = 0.58$ is too large for the polystyrene particles. The issue of trapped particles is less significant for
  $\phi \geqslant 0.2$ and for the polystyrene particles in the less-viscous glycerol–water mixture.
The results for the 50 % solid fraction show a decrease in  $M/M_{lam}$ as
  $Re_b$ increases for both sizes of particles with slightly larger values for SAN particles than for smaller polystyrene particles. Overall, for
  $\phi = 50\,\%$, the SAN and the polystyrene measurements compare well and show similar trends for gap Reynolds numbers up to
  $Re_b = 2.7\times 10^3$ in contrast with the other solid fractions. In terms of
  $\mu _r$, the data at the highest values of
  $Re_b$ compare best with the value of
  $\mu _ r$ for
  $\phi = 0.58$. As explained in § 2, the experiments for
  $\phi = 50\,\%$ were not conducted at the lowest motor rotational speed because the torque provided by the motor was not sufficient to overcome the stress imparted by the particles on the confining walls while maintaining a constant rotational speed. Similar observations were also made by Savage & McKeown (Reference Savage and McKeown1983) for an inertial suspension with a rotating inner cylinder for
  $\phi >0.5$. They concluded that in a narrow-gap, annular rheometer with rough, rigid walls, the high-solid-fraction suspension could not dilate sufficiently when sheared at low speed. The authors speculated that there were groups of particles that remain locked together, especially near the stationary wall, with the shearing of particles confined to a smaller zone near the moving wall. Under these conditions, the assumption of a homogeneous distribution of particles may not be representative of the actual flow conditions.
In looking at the raw data of  $M$ vs
  $\omega$ for
  $\phi =0.5$, a linear extrapolation to
  $\omega = 0$ gives a non-zero value of torque,
  $M_o$, which is larger than the resolution of the torque sensor. For the other solid fractions, a similar extrapolation approaches zero or is below the sensor resolution (Song Reference Song2022). Under conditions in which
  $M_o \neq 0$, the flows behave similarly to a yield stress fluid or Bingham fluid in which the imposed torque needs to be large enough to shear the suspension across the full width of the rheometer gap (Young, Shetty & Hunt Reference Young, Shetty and Hunt2024). For
  $\phi = 0.5$, the torque value at zero shear rate,
  $M_o$, is estimated using fits to the raw torque vs rotational speed data and extrapolating to the origin. The data for
  $\phi = 0.5$ is presented in terms of
  $M-M_o$ in later figures. As a note, the work by Savage & McKeown (Reference Savage and McKeown1983) cannot be used to find a torque at zero shear because those authors subtract off friction and other ancillary fluid contributions that are part of their gross torque measurements; as a result, an extrapolation of their measurements to
  $\omega =0$ gives a negative value of
  $M_o$. Because the torque is measured directly in the current work, it is possible to estimate
  $M_o$ at the highest solid fractions. In related experiments by Boyer et al. (Reference Boyer, Guazzelli and Pouliquen2011), the shear stress as rotational speed decreases to zero is also non-zero. In that study, the authors imposed a normal stress and looked at the transition from a static granular bed to a shearing suspension; the shear stress at zero shear is equated to a friction factor and the normal stress.
Figure 5 presents similar measurements for both sphere sizes in the fluid mixture of 18 % glycerol/82 % water for solid fractions from 0.1 to 0.5, covering a  $Re_{b}$ range from
  $4.8\times 10^3$ to
  $4.9\times 10^4$. The laminar and turbulent fitting curves and the critical
  $Re_b$ for pure fluids are also shown. Using
  $Re_b$, the results extend from before the critical
  $Re_b$ considering pure fluids to the fully turbulent state. For
  $Re_b< 3 \times 10^4$, the polystyrene measurements for
  $\phi = 10\,\%$, 20 % and 30 % lie below the line correlating the turbulent data for pure fluids and have a shallower slope, indicating that the small polystyrene particles suppress the turbulent transition. Conversely, the 10 %, 20 % and 30 % data for the larger SAN particles fall above the pure fluid correlations, indicating the large SAN particles augment the transition and increase the torque for the same value of
  $Re_b$ as compared with the results for the smaller particles. At
  $Re_b \approx 4.2\times 10^4$, the
  $M/M_{lam}$ values for the larger SAN particles are 50 %, 86 % and 180 % greater than the
  $M/M_{lam}$ values for the smaller polystyrene particles for solid fractions of 0.1, 0.2 and 0.3. The criterion to determine whether the liquid–solid flow becomes turbulent does not depend solely on whether the normalised torque of suspension exceeds the line correlating the turbulent data sets for pure fluids. Instead, it depends on the comparison of the trend of turbulent data sets for liquid–solid flow and the slope of the turbulent data points for pure fluids.

Figure 5. The ratio of experimental torque measurements,  $M$, to the torque of laminar flow,
  $M_{lam}$, with respect to
  $Re_b$, considering large SAN particles and small polystyrene particles suspending in the fluid mixture of 18 % glycerol and 82 % water for
  $\phi$ from 10 % to 50 %.
For 40 % and 50 % solid fractions, the measurements for both sizes of particles are above the pure fluid line. For 40 % solid fraction, the results for both particles show an increase in the normalised torque as  $Re_b$ increases with the large particle measurements being 230 % larger than the small polystyrene measurements at
  $Re_b \approx 4.2\times 10^4$. For
  $\phi = 0.5$, the
  $M/M_{lam}$ values for SAN results decrease first until
  $Re_b < 2.70\times 10^4$, then show a slight increase for
  $Re_{b}$ from
  $2.7\times 10^4$ to
  $4.3\times 10^4$. The 50 % polystyrene results decrease over the tested Reynolds number region; the measurements are roughly 48 % smaller as compared with the SAN measurements at the highest
  $Re_b$. For both sizes of particles, the values of
  $M_o$ are non-zero.
The impact of the hard spheres on the turbulent transition has been considered in pipe flow, such as the studies by Matas et al. (Reference Matas, Morris and Guazzelli2003), Yu et al. (Reference Yu, Wu, Shao and Lin2013) and Leskovec, Lundell & Innings (Reference Leskovec, Lundell and Innings2020). For particles much smaller than the diameter of the pipe, the small particles attenuate the turbulence; for larger particles, the particles may enhance the turbulent effects depending on the solid fraction. For Taylor–Couette flows, recent experiments (Majji & Morris Reference Majji and Morris2018; Ramesh et al. Reference Ramesh, Bharadwaj and Alam2019; Dash et al. Reference Dash, Anantharaman and Poelma2020; Moazzen et al. Reference Moazzen, Lacassagne, Thomy and Bahrani2022) looked at the effects of particles on the presence of Taylor vortices and the subsequent bifurcations. As described by Moazzen et al. (Reference Moazzen, Lacassagne, Thomy and Bahrani2022), there are differences in the laminar to turbulence thresholds in Taylor–Couette flows as compared with those found in pressure-driven flows. The data compiled over a wide range of parameters as found by Moazzen et al. (Reference Moazzen, Lacassagne, Thomy and Bahrani2022) demonstrates that the gap size to particle diameter ratio can affect the order of the flow transitions and the particles can also create new flow states as compared with flows of pure fluids.
In the current studies, small polystyrene particles for  $\phi < 0.3$ increase
  $\mu _{e}$, decreasing the effective Reynolds number, and leading to the delay of turbulent transition (Balachandar & Eaton Reference Balachandar and Eaton2010). The presence of large SAN particles should also increase the effective viscosity of the particulate flow, but SAN particles may be large enough to also enhance the velocity fluctuations, leading to the increased normalised torque (Cartellier & Riviere Reference Cartellier and Riviere2001; Mendez-Diaz et al. Reference Mendez-Diaz, Serrano-Garcia, Zenit and Hernandez-Cordero2013). As compared with the laminar–turbulent transition using pure-fluid measurements in figure 3, the measurements for the polystyrene particles with
  $\phi = 0.1$, 0.2 or 0.3 show a smoother transition, which is consistent with prior studies on liquid–solid flows (Lashgari et al. Reference Lashgari, Picano, Breugem and Brandt2014; Agrawal, Choueiri & Hof Reference Agrawal, Choueiri and Hof2019). As discussed in regard to the pure fluid measurements in the transition region, it is possible to find both laminar and turbulent states at the same Reynolds number.
Figures 6 and 7 present the normalised torque data considering  $\phi$ ranging from 0.1 to 0.4 for data points that are below pure-fluid fully turbulent regime Reynolds number (
 $Re_b < 1.1 \times 10^4$); these data sets include small polystyrene particles in the glycerol and ethanol mixture (data sets in blue), some of the polystyrene measurements (data sets in black) in the glycerol and water mixture, and the large SAN measurements (data sets in red) in the glycerol and ethanol mixture. In figure 6, these data are presented in terms of the traditional
  $Re$ based on the flow shear rate and the square of the sphere diameter,
  $Re = \rho d^2 \dot {\gamma } / \mu$, which is the parameter typically used in sheared suspension studies. In terms of
  $Re$, the data extends from 0.5 to 50. For all of the solid fractions, the normalised torque is independent of
  $Re$ below approximately
  $Re \approx 5$. For
  $Re \geqslant 5$, the data for
  $\phi = 40\,\%$ begins to show an increased dependence on
  $Re$. The measurements for
  $\phi$ from 0.1 to 0.3 show an increased dependence on
  $Re$ at slightly larger values of
  $Re$.
$Re$.

Figure 6. The ratio of the experimental torque measurements,  $M$, to the torque of laminar flow,
  $M_{lam}$, in terms of
  $Re$, before the transition to turbulence. The figure presents results of small polystyrene particles suspending in 51 % glycerol–ethanol and 18 % glycerol–water mixtures, as well as large SAN particles suspending in 51 % glycerol–ethanol mixture, with
  $\phi = 0.1$, 0.2, 0.3 and 0.4. The red dotted lines represent the KD relations using
  $\phi _{m} = 0.68$ and
  $a = 1.82$. The dashed lines in red represent the KD relations using
  $\phi _{m} = 0.58$ and
  $a = 1.82$. The black solid lines represent the fitting curves for
  $\phi =0.1$ and 0.2. The dashed line in black corresponds to the fitting curve for
  $\phi =0.3$. The dotted line in black represents the fitting curve considering
  $\phi =0.4$.

Figure 7. The ratio of experimental torque measurements,  $M$, to the laminar torque,
  $M_{lam}$, with respect to
  $Re^\prime$ before the turbulent transition. The figure presents measurements of small polystyrene particles suspended in 51 % glycerol/49 % ethanol and 18 % glycerol/82 % water mixtures, as well as large SAN particles suspended in 51 % glycerol/49 % ethanol mixture, for
  $\phi = 0.1$, 0.2, 0.3, and 0.4. The red dotted lines represent the KD relations using
  $a = 1.82$ and
  $\phi _{m} = 0.68$. The dashed lines in red represent the KD relations using
  $\phi _{m} = 0.58$ and
  $a = 1.82$. The black lines correspond to the fitting curves for
  $\phi$ from 0.1 to 0.4.
With an increasing  $Re$, the experiments with the same
  $\phi$ values show variations depending on the fluids and particles. At
  $\phi$ of 0.2, 0.3 and 0.4, the polystyrene measurements (data points in blue) align with the SAN measurements (data points in red) in the liquid mixture of glycerol and ethanol for
  $Re$ around 10. The polystyrene spheres suspended in the less-viscous fluid (data sets in black), however, fall above the SAN data. For
  $\phi = 0.1$, the SAN particle (red data sets) at
  $Re \approx 8$ are larger than the polystyrene (blue data sets) result. As described previously, this difference is attributed to the trapped small-scale polystyrene particles in the interstices of the large particles glued on the rheometer wall. For
  $Re>15$, the measurements for the polystyrene spheres in the 18 % glycerol–water mixture lie above the 10 % result for the SAN spheres in the 51 % glycerol–ethanol mixture.
As an alternative to using  $Re$ that depends on
  $d^2$, figure 7 presents the same
  $M/M_{lam}$ measurements as found in figure 6 using a modified Reynolds number that depends on
  $d$ and the maximum speed in the shear flow,
  $Re^{\prime } = \rho d U_{o} / \mu$, where the speed of the outer wall is taken as
  $U_{o} = \omega r_o$. As the inertia of the flow increases, prior studies suggest an increase in velocity fluctuations, differences between the solid and fluid velocities and particle collisions, especially in the region near the wall (Zhou & Prosperetti Reference Zhou and Prosperetti2020; Yousefi et al. Reference Yousefi, Costa, Picano and Brandt2023). Under these conditions, the appropriate scaling of the stresses may depend on the diameter of the particle and not the square of the particle diameter. In terms of
  $Re'$, the data extend from 10 to 500. Unlike the results with respect to
  $Re$, the data points for different experiments overlap using
  $Re^{\prime }$, especially for the 20 %, 30 %, and 40 % solid fractions, as compared with the data presented using
  $Re$. The increase in the normalised torque with
  $Re'$ begins at
  $Re' \approx$ 100. As discussed previously for 10 % solid fraction, the
  $M/M_{lam}$ values for the SAN particles are greater than for polystyrene particles for
  $Re^\prime \leqslant 100$. An improvement in using
  $Re'$ for 10 % is that the data for polystyrene particles in glycerol–water (data sets in black) correspond well with the SAN measurements in high-viscosity fluid mixture (data sets in red), which is not found using
  $Re$.
$Re$.
In figures 6 and 7, the relative viscosity using the KD relation is shown for lowest values of either  $Re$ or
  $Re'$. To compare the use of
  $Re$ with
  $Re^{\prime }$ in modelling the normalised torque below the transition to turbulence, the data in figures 6 and 7 are fit with curves for
  $M/M_{lam}$ in terms of
  $Re$ or
  $Re'$ using the KD model to capture the effect of solid fraction with
  $\phi _{m}=0.68$ for 10 % and 20 % results and
  $\phi _{m}=0.58$ for 30 % and 40 % results. Using
  $Re$, the data are best fit using a power law, as found below for
  $Re \geqslant 10$:
 \begin{equation} M/M_{lam}= a_1 {Re}^{a_2} \mu _r ( \phi , \phi _m), \end{equation}
where  $a_1$ and
  $a_2$ are constants fitted to the data and given in table 1.
Using  $Re ^{\prime }$ to correlate the data, the fitted curves involve the KD effective viscosity function,
  $\mu _r (\phi, \phi _m)$, plus a function that depends linearly on
  $Re ^{\prime }$ with coefficient,
  $b_1$, and a constant
  $b_2$, as follows:
 \begin{equation} M/M_{lam}= \mu _r (\phi , \phi_ m) + b_1 Re^\prime + b_2. \end{equation}
The values of  $b_1$ and
  $b_2$ are found in the table. Note that the value of
  $b_2$ reflects how well the KD model estimates
  $\mu _{e}$ for low values of
  $Re'$. For
  $\phi \leqslant 0.3$, the largest value of
  $b_2$ corresponds with
  $\phi = 0.1$; as discussed previously, the difference results from the roughened walls.
To quantify how well the models fit with the measurements in figures 6 and 7, table 1 also presents the root-mean-square (r.m.s.) deviations of the experimental measurements from the fitting curves. For  $\phi = 10\,\%$, the r.m.s. of the deviation between the experimental results and the fitting model in figure 6 for
  $Re$ from 10 to 100 is 0.54. The r.m.s. for the same data sets with respect to the fitting model in figure 7 for
  $100 < Re^\prime < 400$ is 0.17, roughly three times smaller than the r.m.s. number using
  $Re$. For
  $\phi = 20\,\%$, 30 % and 40 %, the values of r.m.s. in figure 7 are 0.20, 0.40 and 2.91, respectively, which are smaller than the corresponding r.m.s. values in figure 6. Overall, the highest r.m.s. values are for
  $\phi = 0.4$.
The measurements of  $M/M_{lam}$ are further normalised by the KD relation,
  ${\mu }_{e}/{\mu } = (1 - \phi /\phi _{m})^{-a}$ for
  $\phi$ from 0.1 to 0.4, and the results are shown with respect to
  $Re^ {\prime }$ in figure 8. Similar to the normalisation results presented in figures 6 and 7, all the low solid fraction results (10 % and 20 %) are normalised by
  ${\mu }_{e}/{\mu }$ using
  $\phi _{m}$ of 0.68, while the 30 % and 40 % solid fraction results are normalised using
  $\phi _{m}$ of 0.58. For solid fractions less than 30 % and
  $Re^\prime$ until 400, the collapsed normalised torques compare well with a fitting curve that includes the inertial contributions:
 \begin{equation} (M/M_{lam})/({\mu}_{e}/{\mu}) = M/M_{e} = 1 + 0.002{Re^\prime}, \end{equation}
where  $M_{e} = 2 {\rm \pi}\mu _{e} H {r_i}^2 \dot {\gamma }$. The figure and the curve demonstrate the increase in the normalised torque,
  $M/M_{e}$, as
  $Re^\prime$ increases. Prior to transition
  $M/M_{e}$ starts to increase as the flow inertia is increasing, followed by a further magnitude increase at the fully turbulent state. As described earlier, the 10 % results immersed in the liquid mixture of ethanol and glycerol lie below the fitting curve. The 40 % results before the transition to turbulence fall above the fitting curve and show less variation with
  $Re^{\prime }$ than found for the lower solid fractions. These differences may result from the different contributions to the bulk stress, such as the Reynolds stresses and particle stress, having different dependencies on
  $Re^{\prime }$ and
  $\phi$. The fitting curve also demonstrates that at
  $Re^ {\prime } =100$, there is approximately a 20 % increase in torque as compared with the torque estimated using only the KD relation. At
  $Re^{\prime }=500$, the torque has approximately doubled.

Figure 8. Normalised torque ( $M/M_{m}$) divided by the KD relation (
 ${\mu }_{e}/\mu$) with respect to
  $Re^\prime$. The 10 % and 20 % results are normalised by the KD equation considering
  $\phi _{m} = 0.68$ and
  $a = 1.82$. The 30 % and 40 % results are normalised by the KD equation using
  $\phi _{m} = 0.58$ and
  $a = 1.82$. The dotted line in black represents the fitting curve for measurements before the fully turbulent state. The solid line in red is the fitting model for the measurements in the turbulent regime.
In the fully-turbulent regime for  $Re^\prime > 2000$, the collapsed data immersed in the low-viscosity fluid align closely, showing a consistent trend. The data are fit using a power-law relation:
 \begin{equation} (M/M_{lam})/({\mu}_{e}/{\mu}) = 0.29{Re^\prime}^{0.49}. \end{equation}
The torque ratio increases with  ${Re^\prime } ^{0.49}$, which shows a weaker dependence on the rotational speed than found for a pure fluid where the torque ratio increases with
  $Re_b ^{0.66}$ and
  $Re_b$ depends linearly on
  $\omega$. Hence, the particles increase the overall torque, but there is a decreased dependence on the rotational speed or shear rate as compared with a fully turbulent flow for a pure fluid. Similar results were found in the study by Linares et al. (Reference Linares, Hunt and Zenit2017).
As described previously, the experiments for 50 % solid fraction were not conducted at the lowest motor rotational speed because of the stress imparted by the particles on the confining walls when sheared. Using the values of  $M_o$, the data for 50 % are plotted as
  $(M-M_{o})/M_{lam}$ with respect to
  $Re^\prime$ in figure 9. The
  $M_o$ values are listed in the figure caption. The values of yield torque,
  $M_o$, can be compared to the torque at the lowest shear rate using an effective viscosity calculated using the KD relation for
  $\phi = 0.5$. Using the minimum, steady-state rotational speed to calculate the corresponding shear rate,
  $\dot {\gamma }_{min}$, the corresponding torque is calculated as
  $M _{min,e} = 2 {\rm \pi}\mu _{e} H {r_i} ^2 \dot {\gamma }_{min}$. For the 50 % solid fraction experiments, the ratio
  $M_o / M _{min,e}$ ranges from 1 to 6 for the different experiments. Because these values are greater than one, the suspension may not be fully sheared across the width of the annulus at the lowest shear rates. At larger rotational speeds, the particles become more evenly distributed across the annulus.

Figure 9. The ratio of  $(M-M_o)$, to the laminar flow torque,
  $M_{lam}$, with respect to
  $Re^{\prime }$ for small polystyrene particles and large SAN particles suspending in the fluid mixtures of 51 % glycerol/49 % ethanol and 18 % glycerol/82 % water considering 50 % solid fraction. Here
  $(M-M_o)/M_{lam}=34.6$ is the fitting curve for all particles in the glycerol–ethanol mixture and
  $(M-M_o)/M_{lam}=271$ and
  $(M-M_o)/M_{lam}=485$ are the fitting curves for polystyrene and SAN particles in glycerol–water mixtures respectively. The values for
  $M_o$ are
  $0.35\ {\rm N}\ {\rm m}$ and
  $0.59\ {\rm N}\ {\rm m}$ for polystyrene particles and SAN particles in the high-viscosity mixture, and are
  $0.11\ {\rm N}\ {\rm m}$ and
  $0.14\ {\rm N}\ {\rm m}$ for polystyrene particles and SAN particles in the low-viscosity mixture.
By plotting the measurements in terms of  $(M-M_o)/M_{lam}$, the results of the 50 % polystyrene particles (data points in blue) and SAN particles (data points in red) in the high-viscosity fluids overlap, and the data can be fitted with
  $(M-M_o)/M_{lam} = 34.6$, which is close to the KD relative viscosity using
  $\phi _m = 0.58$ as presented in table 1. The two data sets in the glycerol–ethanol fluids compare well for
  $Re^\prime$ near 100. Hence, the 50 % measurements in the suspending fluids with high viscosity are independent of the particle size, and the corresponding
  $M/M_{lam}$ values do not depend on
  $Re^\prime$. The one exception is the data point at
  $Re^ {\prime }=14$, where the error bar is large because of the variations in the motor at the lowest rotational speed. Beyond the laminar–turbulent transition, the 50 % polystyrene measurements using glycerol–water fluids (black data points) can be best fitted with
  $(M-M_o)/M_{lam} = 271$, which is significantly greater than the corresponding laminar measurements. The substantial difference in the normalised torque before and after the transition for
  $\phi = 0.5$ results shows the impact of the turbulence. The SAN measurements for
  $\phi = 0.5$ in the low viscosity (data points in green) can be best fitted with
  $(M-M_o)/M_{lam} = 485$, which is 1.8 times greater than the corresponding 50 % results of small polystyrene particles in the glycerol–water mixture, indicating the impacts of different levels of turbulence. The earlier work by Linares et al. (Reference Linares, Hunt and Zenit2017) showed sheared thinning at 50 % solid fraction; however, the value of
  $M_o$ was not subtracted from the raw data. In the study by Koos et al. (Reference Koos, Linares-Guerrero, Hunt and Brennen2012), the torque ratios were also found to be independent of
  $Re$. Those experiments included measurements of the particle slip velocity and inferred a depletion layer with lower solid fraction near the surface. Because the solid fraction must go to zero at the wall, the effective viscosity is lower in this region and the velocity gradient is higher. Although the slip is not measured in the current experiments, the normalised torque measurements at 50 % solid fraction suggest that there may be a region of particle slip and a depletion layer near the wall, even with the increased roughness in the current experiments as compared with the earlier study by Koos et al. (Reference Koos, Linares-Guerrero, Hunt and Brennen2012). Similar results are found in the simulations by Zhou & Prosperetti (Reference Zhou and Prosperetti2020).
5. Discussion and comparison with numerical studies
Figure 10 presents the current measurements in linear scale using polystyrene and SAN particles in the glycerol–ethanol fluids, as well as the numerical results using neutrally buoyant spherical particles from Kulkarni & Morris (Reference Kulkarni and Morris2008) and Rahmani et al. (Reference Rahmani, Hammouti and Wachs2018) in terms of  $Re^\prime$. In these two numerical studies, the three-dimensional flow is generated by the translation of two plates separated by a distance,
  $H$, each moving in the opposite directions with speed
  $U$; hence, the shear rate in the paper is defined as
  $\dot {\gamma } = 2 U/H$ and
  $Re$ is related to
  $Re'$ as
  $Re' = Re (H/2d)$. In these studies, the shear force along the walls is computed rather than the torque measurement. The spacing between the walls is the same in both studies with
  $H/d=10$, which is sufficient to prevent significant banding of particles as demonstrated in the study by Gallier et al. (Reference Gallier, Lemaire, Lobry and Peters2016). The Caltech experimental apparatus using an outer-rotating cylinder with significant roughness helps to achieve a homogeneous distribution of particles prior to the turbulent transition for
  $\phi = 0.1$, 0.2 and 0.3, ensuring a similar rheological configuration in comparison to the simulations. Because of the issues previously discussed regarding the polystyrene particles at the 10 % solid fraction in glycerol–ethanol, this data set is not included. Similar to the normalisation in figure 9, the experimental results with lower solid fractions, 10 % and 20 %, are normalised by the KD relation with
  $\phi _m = 0.68$ and
  $a = 1.82$, while the 30 % solid fraction result is normalised using
  $\phi _m = 0.58$ and
  $a = 1.82$. For the numerical studies, the stress ratios found in the papers are normalised by the effective viscosity models used in those papers. The work by Kulkarni & Morris (Reference Kulkarni and Morris2008) uses the Eilers relation:
 \begin{equation} {{\mu}_{e}}/{\mu}(\phi) = [1 + b\phi/(1 - {\phi}/{\phi}_{m})]^2 \end{equation}
with  $\phi _{m} = 0.58$ and
  $b = 1.5$. The study by Rahmani et al. (Reference Rahmani, Hammouti and Wachs2018) uses the KD equation with
  $\phi _m = 0.63$ and
  $a = 1.58$.

Figure 10. Neutrally buoyant experimental results,  $M/{M_{lam}}$, and numerical results, normalised by
  ${{\mu }_{e}}/{\mu }$ with respect to
  $Re^\prime$. The experimental measurements correspond to small polystyrene particles suspended in high-viscosity liquids (GE) for
  $\phi$ from 0.2 to 0.3, as well as large SAN particles in the GE mixture for solid fractions from 0.1 to 0.3. The simulations are from Kulkarni & Morris (Reference Kulkarni and Morris2008) and Rahmani et al. (Reference Rahmani, Hammouti and Wachs2018), with solid fractions from 10 % to 30 %. The 10 % and the 20 % experimental measurements are normalised using
  $\phi = 0.68$ and
  $a = 1.82$, while the 30 % experimental results are normalised using
  $\phi = 0.58$ and
  $a = 1.82$. The simulations of Kulkarni & Morris (Reference Kulkarni and Morris2008) use the Eilers equation with
  $b = 1.5$ and
  $\phi _{m} = 0.58$. The results of Rahmani et al. (Reference Rahmani, Hammouti and Wachs2018) use the KD relation using
  $\phi _{m} = 0.63$ and
  $a = 1.58$.
Both the simulation and experimental measurements show an increased dependence on  $Re^\prime$. For
  $\phi = 0.1$, the normalised torques from Kulkarni & Morris (Reference Kulkarni and Morris2008) and Rahmani et al. (Reference Rahmani, Hammouti and Wachs2018) align well with the current measurements, as well as the curve of
  $(M/M ^{\prime })/({\mu _{e}}/{\mu }) = 1 + 0.002{Re^\prime }$. For the 20 % fraction, both numerical values show good agreement with the current measurements; at
  $Re^\prime = 100$, the 20 % result from Rahmani et al. (Reference Rahmani, Hammouti and Wachs2018) is approximately 18 % greater than the current experimental result. The 30 % numerical results fall above the current measurements, with normalised torques being 20 % and 35 % greater than the corresponding experimental data points for
  $Re^\prime = 80$ and 100 respectively. There are differences between the simulations and the experiments, such as the wall roughness, the dimensions, and the difference between a shear flow and an annular flow with one moving surface; these effects can impact the local micro-structure of the flows and contribute to differences in the measured stresses.
6. Conclusion
The current study involves neutrally-buoyant suspensions using two particle sizes and two fluid viscosities in the Caltech coaxial rheometer with rough walls; additional experiments involved pure liquids to study the transition to turbulence for the rheometer. With the current experimental set-up, the measurements presented in this study extend the rheological experiments to the important  $Re$ regime found in many geological and engineering applications. The conducted measurements on liquid–solid flows cover both dilute and dense solid fractions with
  $\phi$ from 10 % to 50 % and particle Reynolds numbers
  $Re$ between 0.5 and 800, extending from the laminar state to the fully-turbulent state.
For neutrally buoyant particulate flow measurements with  $Re$ from 0.5 to 10 and
  $\phi$ from 10 % to 40 %, the normalised torque of particulate flows is independent of
  $Re$, but increases with
  $\phi$. For
  $Re$ ranging from 10 to 100 and
  $\phi$ less than 40 %, due to the increased inertial effects, the normalised torque depends on
  $Re$ and the
  $\phi$, showing an enhanced normalised torque as
  $Re$ increases. As Reynolds number is increased beyond the critical
  $Re_b$, the liquid–solid flows using either the polystyrene particles or the SAN particles transition to the turbulent states. For
  $\phi$ from 10 % to 30 %, the small polystyrene particles increase
  $\mu _{e}$ of the suspension and delay the laminar–turbulent transition (Balachandar & Eaton Reference Balachandar and Eaton2010); for
  $\phi$ of 40 % and 50 %, the measured torques are greater than for a pure fluid. For the suspension with larger SAN particles, the addition of particles increases the torques for all solid fractions as compared with results for pure fluids. Similar to the studies considering flows in pipes or channels, the combined effects of the increasing Reynolds stress and turbulence level lead to enhanced momentum transport (Yousefi et al. Reference Yousefi, Costa, Picano and Brandt2023). The current experimental results are consistent with prior studies that turbulence can be suppressed or augmented depending on the solid fraction and size of the particle (Gore & Crowe Reference Gore and Crowe1989; Matas et al. Reference Matas, Morris and Guazzelli2003; Yu et al. Reference Yu, Wu, Shao and Lin2013; Leskovec et al. Reference Leskovec, Lundell and Innings2020).
The Reynolds number based linearly on the diameter of the particle and the maximum velocity of the flow,  ${Re^\prime =\rho {d}{U_{o}}/{\mu }}$, as traditionally used to examine flow over an isolated sphere, is proposed to correlate the normalised torques before transition and for solid fractions from 10 % to 40 %. New rheological models based on the KD relationship and
  $Re^\prime$ are introduced based on the experimental measurements for the
  $Re^\prime$ regime from 10 to 500. By comparing the r.m.s. values of the fitting models using
  $Re$ and
  $Re^\prime$,
  $Re^\prime$ is proved to be a better scaling variable to correlate the normalised torque of the moderate-Reynolds-number liquid–solid flow before transition than the traditional particle Reynolds number,
  $Re$. Interestingly, the use of
  $Re^{\prime }$ leads to a simpler expression to correlate the fully turbulent data for
  $\phi \leqslant 40\,\%$. For
  $\phi = 50\,\%$, the values of the normalised torques are significantly larger than found for lower values of
  $\phi$ and are independent of
  $Re^{\prime }$ when presented in terms of
  $(M-M_o)/M_{lam}$.
Although the current torque measurements and the rheological models based on  $Re^\prime$ and KD equations can aid the development of rheological models for moderate-Reynolds-number liquid–solid flows, work still needs to be done to understand the contribution of the particle collisions, the particle stress, and the Reynolds stress on the bulk stresses, especially since each of these terms may depend differently on
  $Re$ or
  $Re ^{\prime }$. Future studies on inertial suspensions should quantify the velocity fluctuation for different values of particle size to gap size,
  $d/b$ (Brandt & Coletti Reference Brandt and Coletti2022), and measure the distribution of the velocity and solid fraction (Yousefi et al. Reference Yousefi, Costa, Picano and Brandt2023). As the Stokes number,
  $St$, increases, the particle collision may also become increasingly important for the torque measurement (Yang & Hunt Reference Yang and Hunt2006; Zhou & Prosperetti Reference Zhou and Prosperetti2020). Therefore, direct pressure measurements of the particle collision can help determine the contribution to the stresses in a liquid–solid flow.
Funding
This research is based on work supported by the National Science Foundation (NSF) under grant no. 1706166.
Declaration of interests
The authors report no conflict of interest.


