


1. Introduction
Droplet impacts on stationary and non-stationary surfaces are frequently witnessed in our daily lives. For instance, raindrops falling onto leaves (Gart et al. Reference Gart, Mates, Megaridis and Jung2015; Park et al. Reference Park, Kim, Gruszewski, Schmale III, Boreyko and Jung2020) and onto beating wings of birds (Zhang et al. Reference Zhang, Zheng, Wu, Wang, Shen, Liu and Ren2019) and insects entail fluid–structure interaction wherein movement of the surfaces greatly affects the outcomes of such impacts and thus governs phenomena such as the spread of pathogens, environmental aerosol dispersion, and repulsion of liquid from natural surfaces. Understanding this droplet–surface interaction is necessary to improve agricultural practices and to design superior bio-inspired water-repellent media. In addition, droplet impact on vibrating surfaces is a critical aspect of numerous industrial processes. Controlling the deposition of functional droplets can be useful in sprays for thermal coating (Tropea & Roisman Reference Tropea and Roisman2000; Saha et al. Reference Saha, Seal, Cetegen, Jordan, Ozturk and Basu2009). The impact of droplets on substrates is also critical for applications such as inkjet printing and in additive manufacturing (Martin, Hoath & Hutchings Reference Martin, Hoath and Hutchings2008; Tang et al. Reference Tang, Saha, Sun and Law2019b; Lohse Reference Lohse2022), as well as in controlled deposition of cell-laden droplets for tissue engineering (He, Liu & Qiao Reference He, Liu and Qiao2015), where the post-impact spreading of droplet determines the quality of the final product. The spreading dynamics of impacted droplets also controls the efficacy of spray cooling (or heating) of surfaces where the heat transfer is proportional to the contact area and contact time between the droplet and the substrate (Breitenbach, Roisman & Tropea Reference Breitenbach, Roisman and Tropea2018). Furthermore, the spreading is an important parameter in applications where the impact promotes chemical reactions during surface treatments or mass transfers during cleaning processes. Owing to its broad applications, droplet impact on stationary and non-stationary substrates is of scientific interest. Hence a large volume of studies investigated the mechanistic description of the dynamics, and various post-impact outcomes, which will be reviewed next.
Over the past century, extensive work has been carried out to investigate the impact of different liquids on stationary substrates with a variety of surface properties and morphologies. Early studies published by Worthington (Reference Worthington1877a,Reference Worthingtonb) explored the impact of water and mercury on a static glass surface. Since then, numerous studies have explored the various aspects of droplet impact on stationary media, which were periodically summarized in reviews by Yarin (Reference Yarin2006), Khojasteh et al. (Reference Khojasteh, Kazerooni, Salarian and Kamali2016), Josserand & Thoroddsen (Reference Josserand and Thoroddsen2016) and Mohammad Karim (Reference Mohammad Karim2023). These studies have established that the outcomes of impact and post-impact dynamics are governed by the properties of both liquid and substrate. The phenomena observed during impact are the results of the balance between forces involving impact inertia, capillary force (surface tension), viscous dissipation and gravitational force. The relative strengths of these forces can be quantified using non-dimensional numbers, such as the Weber number ( $We$), Reynolds number (
 $Re$) and Froude number (
 $Fr$):
 \begin{equation} We = \frac{\rho V_0^2 D_0}{\gamma},\quad Re = \frac{\rho V_0 D_0}{\mu},\quad Fr = \frac{V_0^2}{g D_0}, \end{equation}
where  $\rho$ is the liquid density,
  $V_0$ is the impact velocity of droplet,
  $D_0$ is the initial droplet diameter,
  $\gamma$ is the air–liquid surface tension,
  $\mu$ is the dynamic viscosity of the liquid, and
  $g$ is the gravitational acceleration. Previous studies have found distinct characteristics of impact differentiated by their governing mechanisms and classified as either viscous regime (low
  $We$ and
  $Re$) or inertia-capillary regime (high
  $We$ and
  $Re$). Rioboo, Tropea & Marengo (Reference Rioboo, Tropea and Marengo2001) presented the different qualitative outcomes of droplet impact on solid surfaces characterized, namely as prompt splash, corona splash, rebound, partial rebound, deposition, and receding breakup. Splashing generally occurs when the inertia of the droplet overcomes surface tension during high-
 $We$ impacts (Xu, Zhang & Nagel Reference Xu, Zhang and Nagel2005; Liu et al. Reference Liu, Vu, Yoon, Jepsen and Aguilar2010; Mandre & Brenner Reference Mandre and Brenner2012; Hao & Green Reference Hao and Green2017; Khabakhpasheva & Korobkin Reference Khabakhpasheva and Korobkin2020). For low-
 $We$ impacts, the primary focus of a group of studies was the dynamics of droplet deformation and retraction during impacts on various impact surfaces (Clanet et al. Reference Clanet, Béguin, Richard and Quéré2004; Bird, Tsai & Stone Reference Bird, Tsai and Stone2009; Tang et al. Reference Tang, Saha, Sun and Law2019b). The outcome of droplet impact is generally quantified in the form of geometric parameters, such as spreading factor (
 $D^* = D/D_0$), defined by the ratio of instantaneous droplet diameter (
 $D$) to initial diameter, and the instantaneous height of the deformed droplet. Some studies (Bartolo, Josserand & Bonn Reference Bartolo, Josserand and Bonn2005; Antonini et al. Reference Antonini, Villa, Bernagozzi, Amirfazli and Marengo2013) also analysed key time scales, including contact time and rebounding time. The time evolution of the spreading factor was investigated in several studies, which highlighted the maximum spread factor (
 $D^*_{max}$). Experimentally, it was shown that the evolution of
  $D^*$, and
  $D^*_{max}$, depend on
  $We$,
$We$,  $Re$, and substrate properties including wettability (substrate contact angle) and surface roughness (Ukiwe & Kwok Reference Ukiwe and Kwok2005; Eggers et al. Reference Eggers, Fontelos, Josserand and Zaleski2010; Lagubeau et al. Reference Lagubeau, Fontelos, Josserand, Maurel, Pagneux and Petitjeans2012). The experimental observations were complemented by several theoretical and analytical studies (Chandra & Avedisian Reference Chandra and Avedisian1991; Pasandideh-Fard et al. Reference Pasandideh-Fard, Qiao, Chandra and Mostaghimi1996; Clanet et al. Reference Clanet, Béguin, Richard and Quéré2004; Fedorchenko, Wang & Wang Reference Fedorchenko, Wang and Wang2005; Du et al. Reference Du, Wang, Li, Min and Wu2021). These approaches, often based on the assumption of simplified geometry of deformed droplets, assess the role of viscous loss along the boundary layer to derive either scaling laws or estimated droplet diameter (Bennett & Poulikakos Reference Bennett and Poulikakos1993; Pasandideh-Fard et al. Reference Pasandideh-Fard, Qiao, Chandra and Mostaghimi1996; Attané, Girard & Morin Reference Attané, Girard and Morin2007). To obtain more detailed insights and to analyse localized dynamics, a large number of studies used numerical simulations (Tropea & Roisman Reference Tropea and Roisman2000; Rioboo, Marengo & Tropea Reference Rioboo, Marengo and Tropea2002; Renardy et al. Reference Renardy, Popinet, Duchemin, Renardy, Zaleski, Josserand, Drumright-Clarke, Richard, Clanet and Quéré2003; Šikalo et al. Reference Šikalo, Wilhelm, Roisman, Jakirlić and Tropea2005; Eggers et al. Reference Eggers, Fontelos, Josserand and Zaleski2010; Raman et al. Reference Raman, Jaiman, Lee and Low2016a; Wildeman et al. Reference Wildeman, Visser, Sun and Lohse2016).
The impact of a droplet on a moving surface differs from that on a static surface due to the modification of the relative velocity between the droplet and the substrate, and the associated change in the interfacial dynamics. Lee & Kim (Reference Lee and Kim2004) experimentally studied the impact of low-viscosity droplets on a moving substrate, and explored the influence of various trajectories of vertical motion of a surface on the post-impact characteristics of spreading and rebound. They showed that the observed modification in the dynamics could not be attributed solely to the change of relative droplet velocity, and that different trajectories of substrate motion with similar relative velocity can cause various degrees of deviation in the dynamics. Weisensee et al. (Reference Weisensee, Ma, Shin, Tian, Chang, King and Miljkovic2017) carried out experiments with vertically oscillating rigid as well as elastic surfaces to determine the effect of surface motion on the rebound characteristics of impacting droplets. They provided evidence that the contact time is a strong function of the time scale of oscillation, and demonstrated that the phase of surface oscillation at the impact plays a critical role. This was confirmed subsequently by Kim, Rothstein & Shang (Reference Kim, Rothstein and Shang2018), who worked with flexible superhydrophobic surfaces with varying natural frequencies. Recent experimental and theoretical work by Upadhyay, Kumar & Bhardwaj (Reference Upadhyay, Kumar and Bhardwaj2021) on flexible superhydrophobic surfaces showed that a spring–mass system model could estimate the contact time of droplets before the rebound. Mohammad Karim (Reference Mohammad Karim2022) provides insights into drop impacts on flexible materials in his review article. Moradi, Rahimian & Chini (Reference Moradi, Rahimian and Chini2020) used axisymmetric lattice Boltzmann simulations and confirmed that for low-adhesion surfaces, the amplitude, frequency of oscillation and phase at impact dictate the spreading and rebound characteristics. Similar results were also reported for impact on a superhydrophobic surface using a discrete particle method based on many-body dissipative particle dynamics (Lin et al. Reference Lin, Chen, Wei, Xiao, Zhao and Liu2022) and a coupled level-set and volume of fluid method (Li et al. Reference Li, Yang, Liang and Liu2022). Along with reaffirming that oscillation parameters are critical to post-impact droplet dynamics, these studies have also reported that energy dissipation plays a key role in determining droplet dimensions, such as the maximum spreading diameter and height during the spreading process. For high-energy destabilizing impacts, Khabakhpasheva & Korobkin (Reference Khabakhpasheva and Korobkin2020) used asymptotic analysis to derive a model, and conjectured that splashing is possible for impacts on a rigid vibrating surface but not on elastically supported substrates. While most of these studies employed substrates oscillating parallel to the direction of the impact, some studies investigated the effects of substrate motion perpendicular to the direction of the impact. In general, it is shown that such motions also alter the post-impact behaviour, and that by controlling the parameters of oscillation, droplet rebound can be suppressed (Raman et al. Reference Raman, Jaiman, Sui, Lee and Low2016b; Raman Reference Raman2019).
The above brief literature review shows distinct dynamics of droplet impact on non-stationary substrates. Although these works have investigated the impact on oscillating surfaces, a vast majority have utilized superhydrophobic surfaces, wherein the droplet is prone to rebound upon impact due to its low affinity to the substrate. Additionally, there is a lack of systematic experimental studies to explore the effect of a wide range of oscillation parameters on the maximum spread of impacting droplets. Our work endeavours to show experimentally that the dynamics of droplet impact can be manipulated by using a vertically oscillating rigid hydrophobic substrate. We investigate the spreading behaviour in the ‘deposition’ regime of impact as described in Rioboo et al. (Reference Rioboo, Tropea and Marengo2001). We will provide evidence that the observed post-impact normalized maximum droplet diameter ( $D^*_{max}$) during spreading, and the time taken to achieve this quantity (
 $t_{max}$), are strongly influenced by parameters of surface oscillations, namely, amplitude (
 $A$) and frequency (
 $\,f$) of oscillation, and phase at impact (
 $\phi$). Finally, we will provide scaling analyses to assess theoretically the effects of these oscillation parameters on
  $t_{max}$ and
  $D^*_{max}$.
Next, we will describe the experimental set-up. After that, we will present the experimental results of the impact on static and oscillating substrates, although our primary focus will be on the latter. Subsequently, we will present the scaling analyses for theoretical estimations of the maximum spreading of droplets. Finally, we will conclude with a summary of the work.
2. Experimental set-up
In our experiments, a single droplet is generated at the tip of a vertically positioned needle (outer diameter  $0.25$ mm) by pushing liquid through it using a syringe pump. When the gravitational force overcomes the surface tension, the droplet detaches, yielding an almost constant initial diameter
  ${D}_0$ for a given liquid. Upon detaching from the needle, the droplet takes a near-spherical shape with minimal deformation. The droplet accelerates as it falls downwards, and eventually lands on the substrate with impact velocity
  ${V}_0$. By changing the free-fall distance,
  ${V}_0$ was varied. The primary liquid used for this study is de-ionized (DI) water (
 $\rho =998~\textrm {kg~m}^{-3}$,
  $\gamma =72~\textrm {mN~m}^{-1}$ and
  $\mu =0.89~\textrm {mPa~s}$), while for a limited set of experiments, an ethanol–DI water mixture (
 $1:12.33$ w/w mixture,
  $\rho =986~\textrm {kg~m}^{-3}$,
  $\gamma =55~\textrm {mN~m}^{-1}$ and
  $\mu =1.48~\textrm {mPa~s}$; Vazquez, Alvarez & Navaza Reference Vazquez, Alvarez and Navaza1995; Phan Reference Phan2021) was used. It is to be noted that liquids with properties similar to water and ethanol are often used for cooling, coating and disinfection applications (JuGer & Crook Reference JuGer and Crook1999; Parke & Birch Reference Parke and Birch1999; Kandlikar & Bulut Reference Kandlikar and Bulut2003; Ukiwe & Kwok Reference Ukiwe and Kwok2005; Krainer, Smit & Hirn Reference Krainer, Smit and Hirn2019). The Reynolds number (
 $Re$, defined in (1.1a–c)) and Weber number (
 $We$, defined in (1.1a–c)) used for this study span the ranges
  $730< Re<3765$ and
  $12< We<77$, respectively. Our substrate is a mirrored glass surface mounted on a speaker unit (STAPEZ
 $\unicode{x2122}$ FP-SPK-M glass-composite-diaphragm woofer). The substrate is coated with a commercially available hydrophobic coating (RainX), which results in a static contact angle (
 $\theta _{eq}$)
  $\sim 90^{\circ }$ with DI water, and
  $\sim 70^{\circ }$ for the ethanol–water mixture. After each droplet impact, the surface underwent repeat cleaning using Kimwipes
 $^\circledR$ Delicate Task Wipes. Periodically, the equilibrium static contact angle (
 $\theta _{eq}$) on the surface was re-evaluated and maintained through cleaning with acetone, and re-coating with RainX. No further actions were necessary to preserve the surface characteristics and obtain repeatable results. A schematic of our experimental set-up is shown in figure 1.

Figure 1. Schematic of the experimental set-up for droplet impact on a vibrating hydrophobic substrate.
A sinusoidal signal from the function generator is used to drive the speaker to provide a controlled substrate oscillation. This results in a vertical oscillation in the substrate in the form  $y_{s} = A\sin (2 {\rm \pi}f t + \phi )$, where
  $y_{s}$ is the position of the surface measured from the static position,
  $t$ is time,
  $A$ is the amplitude of oscillation,
  $f$ is the frequency, and
  $\phi$ is the phase at impact. Here,
  $t=0$ refers to the instant when the droplet impacts the substrate. For this work, we assign
  $y_s$ to be positive in the upward direction. In our experiments, we used frequency and amplitude ranges
  $50\ {\rm Hz}\le f\le 400\ {\rm Hz}$ and
  $0.05\ {\rm mm} \le A\le 0.375$ mm, respectively. The time scale associated with the frequency of the substrate oscillations is
  $1/f$, and for our experiments,
  $2.5\ {\rm ms}\le 1/f \le 20\ {\rm ms}$. The capillary time, defined as
  $t_{cap} = \sqrt {{\rho D_0^3}/{\gamma }}$, is 10.534 ms and 9.964 ms for experiments with water and ethanol–water mixture, respectively. The range of inertial time scales for impact on static substrates (
 $\tau _s=D_0/V_0$) was
  $1.2\ {\rm ms} \le \tau _s \le 2.64$ ms. As can be seen, the chosen frequency range ensured that the oscillation time scale spans both
  $\tau _s$ and
  $t_{cap}$ in our experiments.
A high-speed camera (Phantom V7.3) coupled with a Nikon  $50$ mm lens, a
  $2\times$ teleconverter and an extension bellows (a variable extension tube) is used to record impact dynamics. The camera and lens are mounted at a slight incline to the substrate to ensure an unrestricted view of the droplet even during high-amplitude oscillations (shown in figure 2). Images are recorded at
  $14\,760$ frames per second with
  $512 \times 384\ {\rm pixel}^2$ resolution, yielding spatial resolution approximately
  $12.9\ \mathrm {\mu }{\rm m}\ pixel^{-1}$. A high-intensity diffused LED array is used as a backlight. Each experimental condition was repeated at least three times to ensure the repeatability of the result. The ensemble average of the desired quantity is considered, and the standard deviation is recorded to estimate the error. The error associated with the desired phase at impact (
 $\phi$) is
  $\pm 0.028{\rm \pi}$ or
  $\pm 5^\circ$.
A laser-based sensor, placed slightly above the impacted surface, was used to detect the proximity of the droplet from the substrate. The signal from the sensor triggers the high-speed camera and the function generator through an external delay generator. The phase of the oscillating substrate at the time of impact (i.e. the phase at impact,  $\phi$) is controlled by adding and modulating a delay between the signal from the sensor and the function generator. The frequency and amplitude of the oscillation in the substrate were controlled directly through the function generator (direct digital synthesis signal generator from Koolertron), whose output was amplified using an amplifier (Lepai
 $\unicode{x00AE}$ LP-220TI) before sending it to the speaker to oscillate the substrate. Before the experiments, the relation between the input voltage to the speaker and the ensuing amplitude of the oscillation was obtained through a detailed calibration process. Utilizing the high-speed camera, and tracking points on the surface of the speaker around the target droplet impact area, it was confirmed that the speaker's surface oscillated in phase and maintained a horizontal position within uncertainty
  $\pm 12.9\ \mathrm {\mu }$m, which is negligible compared to the droplet diameter (
 ${\sim }2$ mm).
High-speed images obtained during the experiments are processed using a custom MATLAB code to extract the quantitative information on droplet spreading. In our study, the instantaneous diameter of the deformed droplet ( $D(t)$) is defined as the maximum horizontal extent of the droplet as seen in high-speed images. It is worth noting that this diameter,
  $D(t)$, is different from the contact diameter (diameter of the contact line), especially during the initial period of the deformation.
3. Experimental results
This section will illustrate the experimental findings of our investigation. Our interest lies primarily in the post-impact spreading behaviour, particularly the normalized maximal spreading of droplets. Henceforth, in this exposition, we will highlight the observations until the instant of the maximum spread of droplets, with limited scrutiny of the receding phase. After establishing a baseline for our study by outlining the findings of the impact on a static surface, we will present the dynamics for cases with oscillating substrates, which is the focus of this study. The influence of phase at impact ( $\phi$), the effect of frequency (
 $\,f$) and amplitude (
 $A$) of oscillation will be addressed systematically.
3.1. Impact on static substrates
The speaker was not actuated for these experiments, ensuring that the substrate remained static during the impact. The droplet free falls until it contacts the substrate at  $t=0$, with the velocity at impact
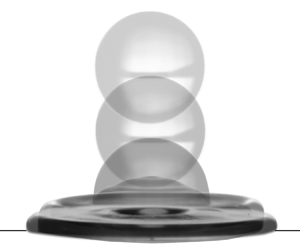
  ${V}_0$. A series of high-speed images for impact on a static surface is shown in figure 2(a) for water droplets. The process begins with the spherical droplet making contact with the stationary substrate. Promptly after the instant of impact (
 $t< 0.14$ ms), a small air bubble forms near the contact point (also observed for oscillating substrates as shown in figure 2) due to the entrapment of air between the droplet and surface. This has been observed in previous studies (Chandra & Avedisian Reference Chandra and Avedisian1991; Pasandideh-Fard et al. Reference Pasandideh-Fard, Qiao, Chandra and Mostaghimi1996; Bouwhuis et al. Reference Bouwhuis, van der Veen, Tran, Keij, Winkels, Peters, van der Meer, Sun, Snoeijer and Lohse2012; Tang et al. Reference Tang, Saha, Law and Sun2019a) of droplet impact on both solid and liquid substrates. This bubble formation is caused by non-uniform pressure distribution in the interfacial gas layer trapped between the droplet and impacted interfaces, and the eventual collapse of this gas layer at a location away from its centre. The droplet starts deforming after the impact (figure 2a), its bottom surface is flattened, and the droplet spreads outwards. This initial stage of spreading (up to
  $t\approx 0.34$ ms as illustrated in figure 2a) is referred to as the ‘kinematic phase’ (Rioboo et al. Reference Rioboo, Marengo and Tropea2002), where the impact inertia dominates over capillary and viscous effects in controlling the spreading dynamics.

Figure 2. High-speed snapshots showing stages of droplet impact for  $We = 27$,
  $Re = 2300$ with: (a) static substrate; (b)
  ${f} = 100\ \text {Hz}$,
  ${A} = 0.25$ mm and
  $\phi = 3 {\rm \pi}/4\ {\rm rad}$; (c)
  ${f} = 400\ \text {Hz}$,
  ${A} = 0.125$ mm and
  $\phi = {\rm \pi}/4$ rad. Multiple peaks in the time evolution of droplet spread are observed for high-frequency cases due to the effect of subsequent oscillations as elaborated in § 3.2.
As the deformed portion of the droplet spreads past the initial droplet diameter  $D_0$, a lamella is formed, and it rapidly spreads radially, while the upper portion of the droplet remains undeformed, resembling a truncated sphere, as seen at
  $t\approx 0.3$ ms in figure 2(a). It is observed that this undeformed part of the droplet continues to move downwards with velocity (measured at the tip of the droplet) equal to the impact velocity (
 ${V}_0$), an observation also reported in earlier studies (Lagubeau et al. Reference Lagubeau, Fontelos, Josserand, Maurel, Pagneux and Petitjeans2012). This is the ‘spreading phase’ (Rioboo et al. Reference Rioboo, Marengo and Tropea2002), where surface tension and viscosity begin to affect the spread. At this stage, capillary waves are seen to rise up through the droplet surface, and they travel upwards, eventually reaching the top of the droplet (
 $\approx 1.3$ ms in figure 2a), thereby completely deforming it. More details of these waves can be found in studies by Pasandideh-Fard et al. (Reference Pasandideh-Fard, Qiao, Chandra and Mostaghimi1996) and Renardy et al. (Reference Renardy, Popinet, Duchemin, Renardy, Zaleski, Josserand, Drumright-Clarke, Richard, Clanet and Quéré2003).
As the top of the droplet reaches its lowest point, it no longer looks like a spherical cap but resembles a pancake ( $\approx 2.2$ ms in figure 2a). For inertia-driven impact, the time taken for the droplet to reach this stage is defined as the droplet ‘crashing time’ (
 $\tau = {D}_0/{V}_0$) and is the characteristic inertial time scale for such phenomena. At this stage, the droplet has expended most of its kinetic energy. The spreading phase continues until the droplet completely deforms, and all its kinetic energy is traded for an increase in surface energy, with some energy lost to viscous dissipation. The spreading results in the thinning of the lamella, and a thick rim is formed on the droplet periphery, creating an almost toroidal geometry (labelled as ‘maximum spread’ at
  $\approx 2.9$ ms in figure 2a). For lower
  ${V}_0$ (and
  $We$) and thus lesser spread, the droplet forms a geometry with a less pronounced rim described as pancake-like rather than toroidal (not shown here). The time history of the instantaneous diameter of the water droplet for four different
  $We$ values is shown in figure 3(a). The normalized maximum diameter (
 ${D}_{max,s}^* = {D}_{max,s}/ {D}_{0}$) achieved by the droplets, and the normalized time (
 ${t}_{max,s}/\tau$) taken to achieve the maximum spread for water, are shown in figure 3(b). In general, we observe that
  ${t}_{max,s}$ is greater than
  $\tau$, and the normalized time follows a linear relation (
 $t_{max,s}/\tau_s =\ 0.0112\ We + 1.0237$ for water) with
  $We$. On the other hand, the normalized maximum diameter (
 ${D}_{max,s}^*$) displays a power-law dependence on
  $We$, with exponent approximately
  $1/4$, a behaviour also observed in previous studies (Clanet et al. Reference Clanet, Béguin, Richard and Quéré2004). The maximum spreading diameter and time during impact on a static substrate for the ethanol–water mixture show similar behaviour, seen in figure 4(b). These values of
  ${D}_{max,s}^*$ and
  ${t}_{max,s}$ for static impact are recorded as the ‘baseline’ to juxtapose with oscillating substrate cases and thus will be used to normalize corresponding length and time scales.

Figure 3. Plots for water droplets. (a) Temporal evolution of post-impact normalized droplet diameter ( ${D}/{D}_0$) for static impact for
  $We = 18, 27, 45, 77$. The dashed line denotes the normalized time
  $t_{max}/\tau$ for maximum spreading. (b) Normalized maximum spread for static impact (
 ${D}_{max,s}^*$) and normalized time for the maximum spread, with respect to ‘crashing time’ (
 $t_{max,s}/\tau$) as functions of
  $We$ that display a power law, and linear fitting, respectively.

Figure 4. Plots for ethanol–water droplets. (a) Temporal evolution of post-impact normalized droplet diameter ( ${D}/{D}_0$) for static impact for
  $We = 12, 19, 28, 45$. The dashed line denotes the normalized time
  $t_{max}/\tau$ for maximum spreading. (b) Normalized maximum spread for static impact (
 ${D}_{max,s}^*$) and normalized time for the maximum spread, with respect to ‘crashing time’ (
 $t_{max,s}/\tau$) as functions of
  $We$ that display a power law, and linear fitting, respectively, similar to water droplets.
After achieving maximum spread, the system transitions to the ‘relaxation phase’ (Rioboo et al. Reference Rioboo, Marengo and Tropea2002), and the droplet recedes due to surface tension in an effort to minimize its surface energy. The droplet settles into a damped oscillation of its diameter until viscous losses eventually render it stationary, and it achieves an equilibrium position during the ‘wetting/equilibrium phase’. Sometimes, a Rayleigh jet (shown in figure 2) is observed due to excess kinetic energy at the end of retraction. More details on the relaxation and wetting/equilibrium phases can be found in the literature (Richard, Clanet & Quéré Reference Richard, Clanet and Quéré2002; Antonini et al. Reference Antonini, Villa, Bernagozzi, Amirfazli and Marengo2013; Yamamoto, Takezawa & Ogata Reference Yamamoto, Takezawa and Ogata2016).
3.2. Impact on oscillating substrates
We will now present the experimental results for droplet impact on oscillating substrates. For these experiments, the substrate was actuated with a sinusoidal wave, and the phase at the impact ( $\phi$) was controlled using the laser-triggered delay generator as detailed in § 2. The post-impact stages of droplet spread on an oscillating substrate qualitatively resemble those on a static one, as shown for water droplets in figures 2(b,c). However, the spreading time and the maximum spread change due to the continuous movement of the substrate. The dynamics of post-impact spreading for impact on an oscillating substrate thus depends on the motions of both the droplet and the substrate. Their combined effect is quantified by the relative droplet velocity, defined as
  $V_{rel} = V_{0} + V_{s}$, which changes with time. Here,
  $V_{0}$ is the instantaneous downward velocity of the droplet, while the substrate velocity
  $V_s$ is positive upwards. It is to be noted that based on the phase at impact (
 $\phi$), the substrate velocity (
 $V_s$) at impact can be upwards (
 $0<\phi < {\rm \pi}/2$ &
  $3{\rm \pi} /2<\phi <2{\rm \pi}$) or downwards (
 ${\rm \pi} /2 < \phi < 3{\rm \pi} /2$), thereby increasing or decreasing the relative impact velocity (
 $V_{rel}$), respectively. Let us elaborate on this using the case where the substrate oscillated with amplitude
  $A = 0.25$ mm and frequency
  $f = 100\ \text {Hz}$, and phase at impact was
  $\phi = 3 {\rm \pi}/4$ for water droplets. The temporal evolution for this impact is shown in figure 5(a). The top panel of the figure illustrates the instantaneous droplet diameter during the spreading processes. The solid line represents the impact on the oscillating substrate, and the dashed line refers to the impact on the static substrate at the same
  $We$. The morphology of the deformed droplets is shown for some key instants as insets. The lower panel displays the instantaneous locations of the substrate during the spreading process. Figure 5(a) shows that at the time of impact, the substrate moves downwards, away from the droplet, with velocity
  ${V}_{s} \approx -0.11\ {\rm m}\ {\rm s}^{-1}$. Furthermore, after the impact,
  ${V}_{s}$ remains negative as the substrate continues with a downward motion. Naturally, the droplet experiences a lower value of
  $V_{rel}$ throughout the duration of spreading. The decreased
  $V_{rel}$ induces reduced vertical compression, and hence a reduced spreading (
 $D_{max}^* = D_{max}/D_0=2.04$), compared to the spreading for impact on the static substrate (
 $D_{max,s}^* = 2.22$) for the same impact velocity or
  $We$ as seen in figure 5(a). The change in
  $V_{rel}$ also affects the time taken by the droplet to reach maximum spreading (
 $t_{max} = 3.34$ ms and
  $t_{max,s} = 3.04$ ms for impacts on oscillating and static substrates, respectively). The observed dynamics changes quantitatively with
  $\phi$ because the instantaneous
  $V_s$, and hence
  $V_{rel}$, follow different temporal histories, leading to either inhibited or assisted spreading of the droplet. The modification in spreading diameter and time for spreading due to substrate oscillation for water droplets is illustrated in figure 6, where we compare
  $D^*_{max}/D^*_{max,s}$ and
  $t^*_{max}/t^*_{max,s}$ versus
  $\phi$ for different
  $A$ and
  $f$ for a fixed
  $We\ (\approx 27$) and
  $Re\ (\approx 2300$).

Figure 5. Temporal evolution of post-impact normalized droplet diameter for water droplets ( ${D}/{D}_0$) with snapshots illustrating droplet profiles (figure 2) for
  $We = 27$,
  $Re = 2300$ and (a)
  ${f} = 100\ \text {Hz}$,
  ${A} = 0.25$ mm and
  $\phi = 3 {\rm \pi}/4$ rad, (b)
  ${f} = 400\ \text {Hz}$,
  ${A} = 0.125$ mm and
  $\phi = {\rm \pi}/4$ rad. The bottom plots show the evolution of substrate motion (
 $y_{s}/A = \sin (2 {\rm \pi}f t + \phi )$) for both cases. The dashed line shows the spreading for impact on a static surface.

Figure 6. (a,b) Normalized maximum spread  ${D}^*_{max}/{D}^*_{max,s}$ as a function of phase
  $\phi$ at impact for various frequencies, for
  $We \approx 27$ and
  $Re \approx 2300$: (a)
  $A = 0.125$ mm, (b)
  $A = 0.25$ mm. Here, the error bars represent the extent of the standard deviation about the mean value. (c,d) Normalized time to maximum spread
  ${t}_{max}/{t}_{max,s}$ as a function of phase
  $\phi$ at impact for various frequencies: (c)
  $A = 0.125$ mm, (d)
  $A = 0.25$ mm. The significantly higher values of
  ${t}_{max}/{t}_{max,s}$ seen in both plots are a consequence of Stage II spreading. Here, the error bars represent the extent of the standard deviation about the mean value. All of these data are for water droplets.
From figures 6(a,b), it is evident that the oscillations rendered spreading difficult compared to the impact on the static substrate ( $D_{max}^*/D_{max,s}^* < 1$), for
  $0 \lessapprox \phi \lessapprox {\rm \pi}$. On the other hand, the oscillations enhanced the spreading (
 $D_{max}^*/D_{max,s}^* > 1$) for
  ${\rm \pi} \lessapprox \phi \lessapprox 2{\rm \pi}$. At lower amplitude (
 $A=0.125$ mm), for the lowest frequency (
 $\,f=100\ \text {Hz}$), the minimum
  $D_{max}^*$ occurs close to
  $\phi = {\rm \pi}$, and for higher
  $f$ values, the minimum
  $D_{max}^*$ condition shifts towards lower
  $\phi$ values (
 ${\rm \pi} /2$ for
  $f=220\ \text {Hz}$ and
  $f=300\ \text {Hz}$), as shown in figure 6(a). On the other hand, the maximum
  $D_{max}^*$ occurs close to
  $\phi = 2{\rm \pi}$ for
  $f=100\ \text {Hz}$, and with increase in
  $f$, it shifts to lower
  $\phi$ (
 $3/2 {\rm \pi}$ for
  $220\ \text {Hz}$). Figure 6(a) also shows that the value of the maximum
  $D_{max}^*$ across various
  $\phi$ increases monotonically with
  $f$. However, the value of the minimum
  $D_{max}^*$ first decreases with an increase in frequency until
  $f\lessapprox 150\ \text {Hz}$, then increases for higher frequencies. Qualitatively, these trends are in close agreement with previous numerical studies by Moradi et al. (Reference Moradi, Rahimian and Chini2020), Lin et al. (Reference Lin, Chen, Wei, Xiao, Zhao and Liu2022) and Li et al. (Reference Li, Yang, Liang and Liu2022). However, we also observe a modified behaviour for higher frequencies (
 $\,f\geq 250\ \text {Hz}$) in that the enhancement in spreading (
 $D_{max}^*/D_{max,s}^*>1$) sustained for an increasingly large range of
  $\phi$ values. For example, we observed
  $D_{max}^*/D_{max,s}^* > 1$ across all values of
  $\phi$ at
  $A = 0.125$ mm and
  $f= 400\ \text {Hz}$ (figure 6a).
At low frequencies, in the duration of droplet spreading, the substrate completes only a partial cycle of oscillation, and depending on the direction of the motion, the spreading is assisted or inhibited. We generally observe a single local maximum in the instantaneous droplet diameter. This is identified as Stage I spreading in figure 5(a), which shows the dynamics for  $100\ \text {Hz}$. On the other hand, at higher frequencies, the substrate undergoes multiple cycles of oscillations during the spreading process (figure 5). Here, the initial spread is governed by the first cycle of oscillation where the
  $D^*$ profile reaches the first maximum, Stage I. The droplet subsequently initiates a ‘relaxation phase’ as
  $D^*$ starts reducing. But before the retraction phase can occur, the substrate starts a downward acceleration, causing the rim of the droplet to increase in height as the substrate rapidly moves downwards. This is evident in snapshots for
  $400\ \text {Hz}$ shown in figures 2(b) and 5(b). The heightened rim subsequently collapses as the substrate starts an upward movement during the next cycle of oscillation (figure 5b). This yields an increase in instantaneous
  $D^*$, creating a second local maximum. This is termed as Stage II spreading, as shown in figure 5(b). For some
  $\phi$ values, the overall maximum spreading is observed during Stage II, as shown in figure 5(b). Since the maximum spread is achieved at a later cycle of oscillation,
  ${t}_{max}/{t}_{max,s}$ for the Stage II maximum spread is significantly higher, as illustrated in figures 6(c,d).
The spreading dynamics ( $D_{max}^*/D_{max,s}$) remains qualitatively similar at various phases across the different amplitudes. More specifically, we observe the maximum and minimum spread (
 $D_{max}^*$) to occur at the same
  $\phi$ for different amplitudes (figure 6a versus figure 6b). As the amplitude of oscillation (
 $A$) increases, the minimum and maximum values of
  $D_{max}$ increase and decrease, respectively. Hence the range of
  $D_{max}$ becomes larger. On the other hand, for smaller
  $A$, the minimum and maximum values move closer to each other, resulting in a narrower range of
  $D_{max}$. To simplify the paper and reduce complexity arising from numerous plots with similar comparisons, plots for only two amplitudes with distinct frequencies are presented here. These plots capture inherently the major qualitative trends observed in our experiments. A detailed comparison of
  $D_{max}^*/D_{max,s}^*$ for a larger range of
  $A$ is shown in the supplementary material available at https://doi.org/10.1017/jfm.2024.414. We have also performed experiments with three different
  $We$ (and
  $Re$) values, which results in qualitatively similar behaviour. The
  $D^*_{max}$ values from these experiments can be found in the supplementary material.
While we used the data for water droplets for the above discussion and corresponding plots, our experiments with the ethanol–water mixture also showed similar trends, as seen in figure 7.

Figure 7. Plots for ethanol–water droplets, with  $We \approx 19$ and
  $Re \approx 909$ for
  $A = 0.125$ mm. (a) Normalized maximum spread
  ${D}^*_{max}/{D}^*_{max,s}$ as a function of phase
  $\phi$ at impact for various frequencies. Here, the error bars represent the extent of the standard deviation about the mean value. (b) Normalized time to maximum spread
  ${t}_{max}/{t}_{max,s}$ as a function of phase
  $\phi$ at impact for various frequencies. The significantly higher values of
  ${t}_{max}/{t}_{max,s}$ seen in both plots are a consequence of Stage II spreading. Here, the error bars represent the extent of the standard deviation about the mean value. All of these data are for ethanol–water droplets.
4. Scaling analysis
As shown above, the droplet impact on oscillating substrate displays two different spreading behaviours, namely Stage I and Stage II. Before we outline the scaling analyses to quantify the effects of oscillation on the spreading dynamics, we will present a simple argument to show why we expect two effects. In the context of a droplet impacting a solid substrate, Clanet et al. (Reference Clanet, Béguin, Richard and Quéré2004) have proposed an interesting concept for understanding droplet spreading. They suggested that the spreading of a droplet can be attributed to an equivalent acceleration, denoted as  $V_0^2/D_0$. For our experiments with
  $D_0\sim 2$ mm and
  $V_0\sim 1\ {\rm m}\ {\rm s}^{-1}$, the equivalent acceleration is
  ${\approx }50g$, where
  $g$ is the gravitational acceleration. Similarly, for impacts on the oscillating substrates, the velocity at the impact changes, hence the equivalent acceleration becomes
  $(V_0 + A(2{\rm \pi} f))^2/D_0$. When the substrate is oscillating at
  $100\ \text {Hz}$ with
  $0.125$ mm amplitude, the equivalent acceleration becomes
  ${\approx }59g$. Upon increasing the frequency to
  $400\ \text {Hz}$, the equivalent acceleration rises to
  ${\approx }88g$. For a droplet that has already been deposited on the substrate (
 $V_0=0$), the substrate oscillation will induce an equivalent acceleration, given by
  $A (2{\rm \pi} f)^2$. For
  $f=100\ \text {Hz}$ and
  $A=0.125$ mm oscillation, the substrate acceleration is only
  ${\approx }5g$. However, as the frequency is increased to
  $400\ \text {Hz}$, this value escalates rapidly to
  ${\approx }80g$. Consequently, based on this simplified analogy, it can be anticipated that substrate oscillation has the potential to alter the spread of a droplet in two distinct stages: first, by modifying the initial relative velocity of the droplet and substrate at impact (Stage I), and subsequently, by subjecting the deposited droplet to forces resulting from the substrate's acceleration (Stage II).
Next, we will derive the scaling analyses for predicting the maximum spreading diameter and time for the two stages.
4.1. Stage I spreading
4.1.1. Time for maximum spread
As the Stage I spreading is kinematically controlled for an inertia-driven impact, the characteristic time scale governing the spreading dynamics of a droplet impacting on a substrate is the crashing time ( $\tau$). Physically, it is the time taken by the tip of the droplet to reach the substrate in the absence of any form of deceleration, and its relation to droplet diameter can be expressed as
 \begin{equation} D_0=\int_{0}^{\tau} V_{rel}(t)\, {\rm d} t.\end{equation}
Imposing  $V_{rel}=V_0$ for impact on static substrates (i.e. no substrate motion), the crashing time can be shown to be
  $\tau _s = {D}_0/{V}_0$. For a wide range of impact conditions (
 $2< We<900$), Clanet et al. (Reference Clanet, Béguin, Richard and Quéré2004) proved that
  $\tau _s$ is indeed the relevant time scale. The time for the droplet to achieve maximum spreading (
 $t_{max}$), however, is different from the crashing time (
 $\tau$). For impact on static substrates, it has been shown that although the droplet achieves a significant part of its total deformation and spreading at
  $t\le \tau _s$, the droplet still possesses a small amount of kinetic energy that decays almost asymptotically (Roisman, Rioboo & Tropea Reference Roisman, Rioboo and Tropea2002). This remnant energy causes further deformation and spreading, albeit at a much weaker rate compared to
  $t\le \tau _s$. Viscous loss and capillarity dominate at this stage (
 $t>\tau _s$), eventually restricting and stopping the spreading process. One can impose an assumption
  $t_{max,s}=\tau _s$, as it was done for several studies. However, this assumption will lead to an under-prediction of
  $t_{max}$ compared to experimental measurements. This introduces significant errors in evaluating viscous losses during the modelling of droplet spread. The accurate estimation of
  $t_{max,s}$ from simple scaling is challenging, which is also recognized by other studies (Du et al. Reference Du, Wang, Li, Min and Wu2021). To get a realistic estimate of
  $t_{max,s}$, we plotted the ratio
  ${{t}_{max,s}}/{\tau _s}$ for water droplets impacting on solid substrates as a function of
  $We$ in figure 3(b), and evaluated a linear relation with
  $We$,
$We$,  $t_{max,s}/\tau_s =\ 0.0112\ We + 1.0237$. The data for the ethanol–water mixture result in similar linear relations, as shown in figure 4(b). As the overall
  $We$ does not change due to the substrate oscillation, we will assume that this relationship between crashing time, time for the maximum spread, and
  $We$ holds for impact on oscillating substrates, and hence
 \begin{equation} \frac{{t}_{max}}{\tau} = 0.0112\ We + 1.0237.\end{equation}
The crashing time for impact on an oscillating substrate ( $\tau$) is affected by the motion of the substrate and hence is different from its counterpart of impact on a static substrate (
 $\tau _s$). For impact on oscillating substrates,
  $\tau$ is a function of impact velocity (
 $V_0$) and frequency (
 $\,f$), amplitude (
 $A$) and phase (
 $\phi$) of the oscillation, and can be evaluated by using
  $V_{rel}=V_0 + 2 A{\rm \pi} f\cos {(2 {\rm \pi}f t + \phi )}$ in (4.1). Here, it is assumed that the downward velocity (
 $V_0$) of the droplet with respect to a lab-fixed reference is constant for the crashing period, i.e.
  $0< t\leq \tau$. In the supplementary material, we compare the trajectory of the tip of the impacting droplet and the instantaneous droplet spread, which shows that the droplet descends with nearly a constant velocity until
  $t=\tau$, justifying the assumption. Once the crashing time (
 $\tau$) is calculated theoretically (see (4.1)), we use the correlation in (4.2) to evaluate the theoretical time taken for maximum spread during droplet impact on oscillating substrates.
Figure 8(a) shows the theoretical (solid lines) and experimental (symbols) normalized  $t_{max}$ for impacts on oscillating substrates for various
  $\phi$ and
  $f$ at
  $We = 27$,
  $Re = 2300$,
  $A = 0.25$ mm for water droplets. For most conditions, the theoretical values show good agreement with the experimental data in that the theory captures both qualitative and quantitative changes with
  $\phi$ and
  $f$. Large discrepancies were observed for the conditions (e.g.
  $f=250\ \text {Hz}$) for which the maximum spreading was obtained during the subsequent oscillations of the substrate (Stage II spreading). The analyses of crashing time that led to (4.1) account for the inertia controlled Stage I spreading, but discount the additional spreading that occurs during the retraction stage of the droplet by the action of subsequent oscillations (Stage II). The ethanol–water mixture showed similar behaviour, illustrated in figure 9(a).

Figure 8. For water droplets. (a) Comparison of experimental and theoretically predicted values for normalized maximum spreading time  ${t}_{max} / {t}_{max,s}$, as a function of phase at impact
  $\phi$, for
  $We = 27$ and
  $A =0.25$ mm for various frequencies. (b) Comparison of experimental and theoretically predicted the normalized maximum spreading time
  ${t}_{max} / {t}_{max,s}$. The filled symbols represent Stage I spreading, and open symbols are for Stage II as seen from experiments. The plots show that theoretical values for
  ${t}_{max}$ show a good match for all data showing Stage I spreading.

Figure 9. For ethanol–water droplets. (a) Comparison of experimental and theoretically predicted values for normalized maximum spreading time  ${t}_{max} / {t}_{max,s}$, as a function of phase at impact
  $\phi$, for
  $We = 19$ and
  $A =0.125$ mm for various frequencies. (b) Comparison of experimental and theoretically predicted the normalized maximum spreading time
  ${t}_{max} / {t}_{max,s}$. The filled symbols represent Stage I spreading, and open symbols are for Stage II as seen from experiments. The plots show that theoretical values for
  ${t}_{max}$ show a good match for all data showing Stage I spreading.
In figure 8(b), we compare the theoretical versus experimental  $t_{max}$ for all conditions studied in our experiments with water droplets covering
  $We$,
$We$,  $A$,
$A$,  $f$ and
  $\phi$. Again, we observe good agreement between the experiment and theory for all the conditions with Stage I spreading with error range
  $\pm 10\,\%$. As expected, the conditions affected by the Stage II spreading (marked with open symbols) show discrepancies for the above-mentioned reason. We will derive scaling for Stage II spreading later, in § 4.2. The ethanol–water mixture showed similar behaviour, illustrated in figure 9(b).
4.1.2. Maximum spreading diameter
Recognizing that we have a good prediction of  $t_{max}$ for impact on oscillating substrates, we next proceed to analyse the energy balance to obtain a theoretical expression for normalized maximum spreading diameter (
 $D^*_{max}$). As mentioned before, for impacts with relatively high
  $We$ and
  ${Re}$, the spreading is inertia-driven. The hydrophobic nature of the substrate (
 $\theta _{eq} = 90^{\circ }$) allows the droplet to spread, with the effects of viscosity being confined mostly to the boundary layer close to the substrate. Thus the dynamics of spreading is an outcome of the balance between the initial kinetic energy (KE), which, in parts, is converted to the surface energy (SE) of the droplet, and is lost to viscous dissipation (
 ${W}$). It is generally assumed that the droplet has negligible kinetic energy at maximum spreading. Furthermore, for impacts on oscillating substrates, the total energy in the system is altered by the presence of an oscillating boundary, which injects and withdraws energy from the system as the substrate moves upwards and downwards, respectively. The energy balance between the states of the droplet before impact and at the maximum spread can then be expressed as
 \begin{equation} KE_{0} + SE_{0} + E_{s} = SE_{f} + W.\end{equation}
Here, the kinetic and surface energies of the droplet before the impact are  ${KE}_{0}= (1/12){\rm \pi} \rho D^3_0V_0^2$ and
  ${SE}_{0}=\gamma {\rm \pi}D_0^2$, respectively. To simplify the analysis, it was assumed that the geometry of the deformed droplet at the end of the spreading resembles that of a shallow cylinder (or pancake) of diameter
  $D_{max}$ and ‘splat height’
  $h$ (shown in figure 10). Although the droplet takes a far more complicated shape with rims during the impact, Eggers et al. (Reference Eggers, Fontelos, Josserand and Zaleski2010) showed that rim formation occurs during the retraction phase. This justifies the assumption of a cylindrical geometry at the instant of maximum spread before the retraction begins. With this assumption, the final surface energy can be expressed as
  ${SE}_{f} = \gamma {\rm \pi}[ (D_{max}^2/4)(1 - \cos \theta _{eq}) + D_{max} h_{max} ]$. From mass conservation, the height of the deformed droplet can be shown to be
  $h = (2/3) (D_0^3 / D^2_{max})$. The overall viscous dissipation is estimated by
  $W = \int ^{t_{max}}_{0} \int _{\varOmega } \varPhi \, {\rm d} \varOmega \, {\rm d} t \approx \varPhi \varOmega t_{max}$. Here,
  $\varPhi$ is the viscous dissipation rate per unit volume and can be approximated as
  $\varPhi \sim \mu ({{V}_0}/{\delta })^2$. The boundary layer thickness is obtained by the relation
  $\delta \sim {D_0}/\sqrt {Re}$ (White & Majdalani Reference White and Majdalani2006). Here,
  $Re = \rho V_0 D_0/ \mu$, where the length scale of the droplet is
  $D_0$, and the radial velocity of the impacting droplet is assumed to be of the same order of magnitude as the impact velocity
  $V_0$ (Chandra & Avedisian Reference Chandra and Avedisian1991). The volume of the boundary layer at the bottom of the cylindrical droplet, where the viscous loss is significant, is given by
  $\varOmega ={{\rm \pi} D_{max}^2 \delta }/{4}$. Since the expressions for evaluating
  $\varPhi$ and
  $\delta$ are approximations, we introduce
  $\alpha$ as the scaling factor to accurately assess the total viscous loss in the boundary layer:
 \begin{equation} W = \alpha\,\frac{\rho V_0^3}{\sqrt{Re}}\,{\rm \pi} D_{max}^2 t_{max}.\end{equation}
The complexity of quantitative assessment of viscous dissipation in droplets during impact on substrates is well known. A scaling factor to account for the discrepancies has been proposed previously by Eggers et al. (Reference Eggers, Fontelos, Josserand and Zaleski2010). The process of evaluation for  $\alpha$ in our study will be discussed later.

Figure 10. Illustration of mass conservation during droplet impact, where  ${D}_0$ and
  ${V}_0$ are initial droplet diameter and velocity,
  ${D}_{max}$ and
  $h$ are dimensions of the spreading droplet,
  ${V}_{s}$ is the velocity of the substrate, and
  ${V}_{rel}$ is the relative velocity.
To account for the additional energy supplied by the moving substrate, we introduce  $E_s$, defined as the total energy imparted by the surface to the droplet until maximum spread is achieved (
 $t=t_{max}$). Assuming that the whole droplet is moving with respect to the substrate, we can express
  $E_{s}=(\rho {\rm \pi}/8) \int ^{t_{max}}_{0} ({\rm d}\unicode{x2C6F} / {\rm d} t)\,V_{s}^2(t') \,{\rm d} t'$, where
  $\unicode{x2C6F}$ is the volume of the liquid affected by the oscillation. Here, we assume that the contact length of the droplet with the surface scales with the droplet length scale, i.e. the initial diameter
  $D_{0}$. Thus the rate of change of the volume of liquid affected by the surface movement can be expressed as
  $({\rm d} \unicode{x2C6F}/ {\rm d} t)\approx D_0^2 V_s$. This leads to
 \begin{equation} E_{s} \approx \rho\,\frac{{\rm \pi} D_0^2}{8} \left(\int^{t_{max}}_{0} V_{s}^3(t')\, {\rm d} t' \right). \end{equation}
Here, the energy transfer from the substrate to the droplet is assumed to be lossless. We note that the above expression for  $E_s$ accounts for the ‘directionality’ of the energy transfer:
  $E_s$ is positive and negative when energy is added to and withdrawn from the droplet, respectively. By substituting the expressions for various forms of energies in (4.3) and by normalizing the lengths by
  $D_0$ and time by
  $\tau$, we find
 \begin{equation} \frac{We}{12} + 1 + \frac{E_s}{\gamma {\rm \pi}D_0^2} = \frac{(D^*_{max})^2}{4}\,(1 - \cos\theta_{eq}) + D^*_{max} h^*_{max} + \alpha\,\frac{We}{\sqrt{Re}}\,(D^*_{max})^2\, \frac{t_{max}}{\tau}. \end{equation}
 Theoretical estimation of  $\alpha$, the scaling factor arising from the boundary layer analyses, is highly sensitive to the assumptions and simplifications. Since an accurate calculation of the scaling factor is difficult from theory, we use experimental data. Here, we utilize the data from the experiments with impacts on static substrates (
 $E_s=0$). By substituting the measured
  $D^*_{max}$ and
  $\tau$ in (4.6) for various impact conditions, we can solve for
  $\alpha$. As shown in figure 11, the best-fit
  $\alpha$ depends on the impact conditions, and follows
  $\alpha = 2.829\, We^{-0.554}$ for water droplets, and
  $\alpha = 3.405\,We^{-0.683}$ for the ethanol–water mixture. A similar approach was also used successfully by Eggers et al. (Reference Eggers, Fontelos, Josserand and Zaleski2010) for their analyses of impacts on static substrates.

Figure 11. Empirical fit for  $\alpha$ expressed in (4.6) obtained from experimental values for static impact for (a) water droplets for
  $We = 18, 27, 45, 77$, and (b) ethanol–water droplets for
  $We = 12, 19, 28, 45$.
Equation (4.6) can be solved to evaluate  $D^*_{max}$ for impacts on oscillating substrates with various amplitudes, frequencies and phases. Figure 12(a) compares the experimental (symbols) and theoretical (lines)
  $D^*_{max}$ for
  $We = 27$,
  $Re = 2300$, and a fixed value of amplitude (
 $A=0.25$ mm) over a range of frequency (
 $\,f$) and phase (
 $\phi$) for water. We notice that the model predicts the decrease and increase in
  $D^*_{max}$ as frequency and phase change with reasonable accuracy. Furthermore, figure 12(b) compares
  $D^*_{max}$ measured in all the experiments with the corresponding theoretical predictions. Overall, good qualitative and quantitative agreements have been observed across all the conditions. The corresponding comparison for the ethanol–water mixture is shown in figure 13, which also shows good agreement.

Figure 12. For water droplets. (a) Comparison of experimental and theoretically predicted values for  $D^*_{max}/D^*_{max,s}$ for
  $We = 27$,
  $Re = 2300$,
  $A = 0.25$ mm as functions of
  $\phi$. (b) Comparison of experimental and theoretically predicted values for
  $D^*_{max}/D^*_{max,s}$ at the instant of maximum spreading for all experimental data. The filled icons represent Stage 1 spreading, and unfilled icons are for Stage II as seen from experiments.

Figure 13. For ethanol–water droplets. (a) Comparison of experimental and theoretically predicted values for  $D^*_{max}/D^*_{max,s}$ for
  $We = 19$,
  $Re = 909$,
  $A = 0.125$ mm as functions of
  $\phi$. (b) Comparison of experimental and theoretically predicted values for
  $D^*_{max}/D^*_{max,s}$ at the instant of maximum spreading for all experimental data. The filled icons represent Stage 1 spreading, and unfilled icons are for Stage II as seen from experiments.
We can make a few additional observations from the analyses and results for  $D^*_{max}$. Using the representative values from our experimental conditions, we find that
  $E_s/(\gamma {\rm \pi}D_0^2)$ is smaller than
  $1\,\%$. Thus
  $E_s$ is relatively insignificant compared to the other terms (
 $KE_{0}$,
  $SE_{0}$,
  $SE_{f}$ and
  $W$) in the energy balance equation (4.6). This implies that the modification in a maximum spread of the droplet for impact on the oscillating substrate does not come directly from the additional energy introduced by the substrate. The oscillations also modify the droplet's relative velocity, affecting the history of the deformation process and thus spreading time
  $t_{max}$. This, in turn, affects the viscous dissipation
  $W$, and hence
  $D_{max}$. Thus it is essential that
  $t_{max}$ is modelled accurately. Furthermore, an order of magnitude analysis of the other terms in (4.6) shows that about 40–60 % of total initial energy (
 $KE_{0}+SE_{0}$) is lost through viscous dissipation (
 $W$). This large viscous dissipation was also reported for droplet impact on static substrates by Wildeman et al. (Reference Wildeman, Visser, Sun and Lohse2016) and Li et al. (Reference Li, Yang, Liang and Liu2022).
4.2. Stage II spreading
As discussed earlier and seen in figures 5(b) and 6, an impacting droplet on an oscillating substrate may attain its maximum spread during the retraction process due to the subsequent cycle of oscillations. If the condition is conducive, then the oscillation of the substrate may assist the droplet in attaining a local instantaneous diameter greater than Stage I spreading, which occurs immediately after the impact (discussed and analysed in the previous subsection). We will now discuss the physical mechanism for Stage II spreading and the conditions required for  $D_{max}$ to occur during this period.
Physically, at the point of maximum spread (Stage I), the droplet loses its kinetic energy and contains excess surface energy in the form of a deformed shape. In the absence of substrate motion, the droplet will undergo a relaxation phase, where the diameter will reduce, and the height will increase. It will eventually form a jet-like central liquid column (figure 2a). The time for this jet formation ( $t_{jet}$) is controlled primarily by the capillary process, and in our experiments (shown in the supplementary material) is found to be
 \begin{equation} t_{jet} \approx \tfrac{1}{2} t_{cap},\end{equation}
where  $t_{cap} = \sqrt {{\rho D_0^3}/{\gamma }}$ is the capillary time. Yamamoto et al. (Reference Yamamoto, Takezawa and Ogata2016) also reported similar findings for their study with droplet impact on the stationary superhydrophobic substrate. The relaxation of the droplet can be approximated as a capillary process, and the instantaneous diameter during the relaxation (
 $D_2$) can be expressed as
 \begin{equation} D_2\approx D_{max,I} \cos(2 {\rm \pi}\,\Delta t / t_{cap}'),\end{equation}
where  $\Delta t$ is the time elapsed after maximum spread occurred at
  $t=t_{max,I}$,
  $D_{max,I}$ is the diameter at the maximum spread at Stage I, and
  $t'_{cap}=\sqrt {\rho D_{max,I}^3/\gamma }$ is the capillary time for the deformed droplet at the end of Stage I spreading. Assuming that the droplet keeps its cylindrical shape during the relaxation period, the reduction in the surface area (
 $\Delta SE_{rlx}= SE_{f}-SE_{rlx}$) can be expressed as
 \begin{equation} \Delta SE_{rlx}= \gamma {\rm \pi}\left( \frac14\, (D_{max,I}^2-D_{2}^2) + \frac23\, D_0^3\left(\frac{1}{D_{max,I}}-\frac{1}{D_2}\right) \right). \end{equation}
 To achieve the maximum spread during Stage II, the substrate oscillation must provide additional energy to overcome the reduction in surface area during the relaxation process, thereby causing a greater spread. From observation, it was noted that this is achieved when the phase of the substrate oscillation at the droplet impact is such that the substrate initiates the downward motion of its sinusoidal trajectory during the relaxation phase of the droplet. This sudden downward movement of the substrate momentarily pulls the adjacent (bottom) part of the droplet while the top part undergoes the relaxation process. This process lasts until the top of the droplet feels the downward motion of the substrate, and the whole droplet starts moving downwards. Although short, this process causes a momentary increase in droplet height ( $\delta h$) during the relaxation process. Recognizing that the disturbance from the bottom to the top of the droplet is transported through capillary waves along the droplet surface, the increase in droplet height can be estimated as
  $\delta h\approx V_s t'_{cap}/2$. This increase in height (
 $\delta h$) leads to a greater distance between the centre of mass of the droplet and the substrate, and thus an increase in the droplet's potential energy measured from the substrate's reference point. Once the substrate reaches its lowest position and subsequently reverses the direction of its motion (
 $t=T_{trough}$), the elongated droplet collapses, thereby causing the droplet to undergo Stage II spreading. The process, with the help of instantaneous droplet diameter and substrate motion, is shown schematically in figure 14. Since the spreading happens due to the vertical elongation of the droplet, which collapses, the increase in surface area during Stage II spreading (
 $\Delta SE_{II}$) can be approximated as the additional potential energy stored in the elongated droplet height, i.e.
 \begin{equation} \Delta SE_{II}=m g \delta h= \frac{\rm \pi}{12}\,\rho D_0^3 g V_s t'_{cap}. \end{equation}
Figure 14. Temporal evolution of post-impact normalized droplet diameter ( ${D}/{D}_0$), illustrating the important time instants for Stage I and Stage II spreading for
  $We = 27$,
  $Re = 2300$,
  ${f} = 400\ \text {Hz}$,
  ${A} = 0.125$ mm and
  $\phi = {\rm \pi}/4$ rad. The top plot shows the evolution of substrate motion (
 $y_{s}/A = \sin (2 {\rm \pi}f t + \phi )$). The illustration showcases the mechanism of Stage II spreading.
Thus the surface area and the diameter of the droplet after the Stage II spreading can be given by
 \begin{equation} SE_{II}=(SE_f - \Delta SE_{rlx}) + \Delta SE_{II}=\gamma {\rm \pi}\left( \frac{D_{max,II}^2}{4} + \frac23\,\frac{D_0^3}{D_{max,II}}\right), \end{equation}
where  $(SE_f - \Delta SE_{rlx})$ is the surface area of the droplet before the Stage II spreading has initiated. Clearly, for
  $D_{max}$ to occur during Stage II spreading (
 $D_{max,II}>D_{max,I}$), the required condition is
 \begin{equation} \Delta SE_{II} > \Delta SE_{rlx}.\end{equation}
Furthermore, the aforementioned oscillation-assisted elongation of the droplet and subsequent Stage II spreading requires the downward motion of the substrate to initiate during the relaxation period (bounded by  $\tau$ and
  $t_{jet}$) of the droplet. Hence the corresponding required condition is
 \begin{equation} \tau < T_{crest} < t_{jet}.\end{equation}
Here,  $T_{crest}$ is the time when the substrate initiates its downward motion, identified by the crest of the sinusoidal trajectory of the substrate motion (shown in figure 14). Equations (4.12) and (4.13) together compose the necessary and sufficient condition for maximum spreading to occur in Stage II. To test this scaling analysis for Stage II, in figures 15(a,b) we plotted the experimentally measured difference between the maximum spreading diameters of Stage I and Stage II as functions of
  $\Delta SE_{II}/\Delta SE_{rlx}$ for all experiments for water and ethanol–water mixture, respectively. We observe that all the data with
  $D_{max,II}>D_{max,I}$ (identified by green symbols) are located in a range
  $\Delta SE_{II} > \Delta SE_{rlx}$. Similarly, the (red) data points that do not show the Stage II spreading (
 $D_{max,II}< D_{max,I}$) are mostly lying in the regime
  $\Delta SE_{II}<\Delta SE_{rlx}$. We also notice a few outliers that show
  $D_{max,II}< D_{max,I}$, even though they satisfy the theoretical condition for Stage II spreading (
 $\Delta SE_{II} > \Delta SE_{rlx}$). It is to be noted for these points that the observed differences between
  $D_{max,I}$ and
  $D_{max,II}$ are rather small (
 $<5\,\%$), and most lie within the experimental uncertainty. Overall, we can infer that the experimental observation closely supports the necessary conditions derived for Stage II spreading.

Figure 15. Illustration of energy criteria for Stage II spread. Experimentally observed percentage change in droplet spread diameter from Stage I and Stage II as functions of  $\Delta SE_{II}/\Delta SE_{rlx}$ for all cases, for (a) water droplets, and (b) ethanol–water droplets. The dotted line
  $\Delta SE_{II}/\Delta SE_{rlx} = 1$ marks the threshold for the occurrence of maximum spread at Stage II, differentiated by the green symbols.
Since Stage II spreading occurs at the instant when the downward motion of the substrate ends and the upward motion begins, the maximum spreading time can be approximated by  $t_{max,II}\approx T_{trough}$. Finally, by using (4.9)–(4.11), one can evaluate the theoretical approximation of
  $D_{max,II}$, the maximum diameter obtained in Stage II. In figures 16(a,b) and 17(a,b), we compare the experimentally measured
  $t_{max}/t_{max,s}$ and
  $D^*_{max}/D^*_{max,s}$ with the theoretically obtained values for all experiments, including both Stage I and Stage II spreading for water and ethanol–water mixture. To evaluate the theoretical values, we used scaling for Stage II if the experimental condition satisfies (4.12) and (4.13). The comparison confirms that the presented scaling analyses can satisfactorily predict the spreading time and maximum spreading diameter.

Figure 16. For water droplets. Comparison of experimental and theoretically predicted values for (a)  ${t}_{max}/{t}_{max,s}$ and (b)
  $D^*_{max}/D^*_{max,s}$ at the instant of maximum spreading, taking the theoretical estimate of Stage II into consideration.

Figure 17. For ethanol–water droplets. Comparison of experimental and theoretically predicted values for (a)  ${t}_{max}/{t}_{max,s}$ and (b)
  $D^*_{max}/D^*_{max,s}$ at the instant of maximum spreading, taking the theoretical estimate of Stage II into consideration.
Before we conclude this section, we will discuss two additional observations, which can be made from (4.13), one of the necessary conditions for Stage II spreading. From definitions, we know that  $\tau \sim D_0/V_0$,
  $t_{jet}\sim \sqrt {{\rho D_0^3}/{\gamma }}$, thus
  $t_{jet}/\tau \sim \sqrt {We}$. Since (4.13) inherently implies
  $t_{jet}>\tau$, Stage II is expected to occur only for high impact inertia (
 $We>1$) conditions. Furthermore, by using the properties of a sinusoidal trajectory (see figure 14), we can express
  $T_{crest}=(5{\rm \pi} /4-\phi )/2{\rm \pi} f$. Substituting this in (4.13) and recalling that
  $\phi >0$, we find
  $f>5/8t_{jet}$. This suggests that to facilitate Stage II spreading, a minimum frequency for substrate oscillation is required, provided that a sufficient amplitude of oscillation is present. In experiments, indeed, Stage II spreading can be observed only for
  $f \geq 250$ Hz.
In summary,  $D_{max,II}$ can be defined consistently as the next local maximum in diameter observed after the inertially driven Stage I. However, it is crucial to note that overall maximum spreading in Stage II (
 $D_{max,II} > D_{max,I}$) occurs only in specific cases, as illustrated in figures 14 and 15.
5. Conclusion
In summary, we presented a detailed experimental study highlighting the effects of an oscillating hydrophobic substrate on the spreading process of an impacting droplet. We showed that the maximum droplet diameter and the time taken are greatly affected by parameters of substrate oscillation, such as the frequency, amplitude and phase at impact. The maximum spread can occur in two stages. The oscillation may promote or inhibit spreading in Stage I, which is controlled primarily by impact inertia. The scaling analyses showed that the instantaneous motion of the substrate alters the relative velocity between the droplet and the substrate, thereby changing the time scale of spreading. The energy budget confirms that this change in spreading time will greatly affect the viscous dissipation; thus the droplet attains a different spreading diameter. The phase of the oscillation at the impact greatly affects this process.
While inertia-controlled Stage I spreading is observed for all conditions, a secondary spreading process (Stage II) can be observed for certain impact conditions in which the droplet attains the maximum diameter at the latter stage. The Stage II spreading is controlled purely by substrate oscillations. For a higher frequency of oscillation, if the phase at the impact is such that the substrate initiates its downward motion after the Stage I spreading, then the droplet undergoes sudden elongation. This allows the droplet to attain greater potential energy, and when it collapses, the droplet spreads to a larger diameter. Based on the scaling argument, the necessary conditions for the Stage II spreading were identified, which showed good agreement with experimental data.
We end this exposition by discussing the relevance and limitations of the findings in the context of applications. In many industrial processes, droplet impact involves heat and mass transfer between the droplet and the substrate. Thus it is of interest to modulate the spreading diameter and time. Our study provides a guideline to design the oscillation parameters for applications where substrate oscillations can be used for such modulation. It should be noted that the present study has been conducted in a frequency range of less than 1 kHz, for which we expect the proposed scaling to hold. However, very different behaviour of liquid droplets is observed for high (MHz range) frequencies, where the current scaling may not be applicable.
Supplementary material
Supplementary material is available at https://doi.org/10.1017/jfm.2024.414.
Acknowledgements
The authors thank the reviewers for providing valuable comments and feedback, which improved the paper.
Funding
This work was supported by the US National Science Foundation (CAREER award 2145210) and Jacobs School of Engineering at UCSD.
Declaration of interests
The authors report no conflict of interest.


 Open access