The transition from the normal Fe state to the development of Fe deficiency anaemia (IDA) entails two sequential processes (Suominen & Punnonen, Reference Suominen and Punnonen1998): Fe store depletion (IDs); Fe deficiency erythropoiesis (IDE). Both are classified as subclinical Fe deficiency. After the exhaustion of stored Fe compartment, the consequent depletion in functional Fe compartment, IDE and IDA, was initiated. Reliable laboratory measurements reflecting Fe status are clinically important for detecting Fe deficiency. These measurements are also important in epidemiological surveys to monitor the prevalence of Fe deficiency and in intervention studies to evaluate the efficacy of Fe supplementation (Skikne et al. Reference Skikne, Flowers and Cook1990). Since there is a more physiological need of Fe for erythropoiesis, Fe deficiency is highly prevalent in children (Virtanen et al. Reference Virtanen, Viinikka, Virtanen, Svahn, Anttila, Krusius, Cook, Axelsson, Raiha and Siimes1999). Thus, establishing a reliable laboratory measurement for screening Fe deficiency is essential for children's growth and development. Currently, the concentration of serum transferrin receptor (sTfR) has been reported to be useful in the diagnosis of Fe deficiency (Kohgo et al. Reference Kohgo, Niitsu, Kondo, Kato, Tsushima, Sasaki, Hirayama, Numata, Nishisato and Urushizaki1987; Remacha et al. Reference Remacha, Sarda, Parellada, Ubeda and Manteiga1998). sTfR is a reliable tool for assessing functional Fe status and erythropoietic activity in adults, but little is known about its role in children (Vazquez Lopez et al. Reference Vazquez Lopez, Carracedo Morales, Munoz Vico, Morcillo Llorens, Calvo Bonachera, Lopez Munoz and Munoz Hoyos2001; Beguin, Reference Beguin2003). In the current study, we investigated the levels of sTfR in normal and Fe-deficient children, and the response of sTfR to Fe supplementation. We also evaluated the role of sTfR in detecting Fe deficiency and assessing the efficacy of intervention programmes to alleviate Fe deficiency.
Subjects and methods
Subjects
The study population originally consisted of 1006 children including 536 boys and 470 girls, aged 6–14 years old. All children were from the three primary schools in Fang Shan district in Beijing and belonged to the low or middle socio-economic class. Children having a history of haematological disease, asthma, muscle and bone system disease or having a history of infection in the previous month and fever in the previous week and children on oral Fe supplementation were excluded. The present study was performed during the period from February to October 2000 and the protocol was approved by The Medical Ethics Committee of Peking University. All the parents of the children signed consent after the nature of the study was explained.
Study design
Fe status of all children was assessed at the onset of the present study by determining Hb, free erythrocyte protoporphyrin (FEP) and serum ferritin (SF) in a venous blood sample. According to diagnostic standard, children whose Fe status parameters were within the normal range were defined as normal, children who had SF < 20 μg/l (Wang, Reference Wang1993) with other parameters within the normal range were defined as IDs, children who had SF < 20 μg/l, FEP/Hb ( × 102) >0·81 or FEP >0·9 μmol/l (500 μg/l) and Hb ≥ 120 g/l were defined as IDE, children who had SF < 20 μg/l, FEP/Hb ( × 102) >0·81 or FEP >0·9 μmol/l (500 μg/l) and Hb < 120 g/l were defined as IDA. A total of 238 children (sample A) were randomly selected from four groups (normal (n 64); IDs (n 67); IDE (n 68); IDA (n 39)) to determine sTfR. The assay was performed using a commercially available kit based on a monoclonal antibody in a sandwich enzyme immunoassay format. A total of 120 children with different stages of Fe deficiency were included in a 9-week intervention study. Similar tests were also performed at the end of the intervention (sample B).
Laboratory analysis
Overnight fasting blood specimens (4·0 ml) were obtained by certified laboratory technicians for the determination of parameters associated with Fe status. Blood specimens were processed at a local examination centre and sent to a laboratory in Beijing. Whole blood specimens (0·02 ml) were diluted with a reagent (Drabkins solution) and Hb concentration was determined after 10 min using an accurate, well-calibrated photometer (cyanmethaemoglobin method, model 724 spectrophotometer; Shanghai NO.3 Analysis Instrument Factory, Shanghai, China). Whole blood specimens (0·02 ml) were used to determine FEP (fluorometric assay, Model 850 Fluorescence Spectrophotometer; Hitachi Company, Tokyo, Japan). The remaining blood was centrifuged (model DDL-5 Freeze Centrifuge; Shanghai An Ting Scientific Instrument Factory, Shanghai, China) to isolate serum that was stored at − 70°C for determination of the SF and sTfR. The SF was determined by the dioimmunological method using 125I-serum ferritin kit (The Atomic Energy Institute, Beijing, China). The sTfR was determined using a double antibodies sandwich ELISA kit (R&D Systems, Minneapolis, MN, USA). Transferrin receptor-ferritin (TfR-F) index was calculated by the ratio of sTfR:log SF. In the diagnosis testing, the supplied controls, representing a high, a low and a normal concentration, twenty-four duplicates in six different analytic runs were analysed and gave results well within the stated range. The interassay variability of the assay was 1·84 % (n 6) for Hb and 3·69 % (n 6) for FEP.
All members of the study team successfully completed a training programme on the aims of the study and the specific method used. The biological measurements were standardized among laboratories according to the criteria of Peking University.
Fe supplementation
In the present study, the children of IDs and IDE were supplemented with 60 mg Fe/week and the children of IDA were supplemented with 60 mg Fe each time and three times per week with capsules of NaFeEDTA (Huo et al. Reference Huo, Sun and Miao2002) provided by Beijing Shiji Vita New Technique Co. Ltd (Beijing, China). The capsules have been certified by Food and Drug Administration of China and each one contains 60 mg Fe. The children were asked to take the capsules between meals with no changes in their diet habits and keep a record on a card after the capsule had been taken. The intervention of Fe supplementation was 9 weeks. The parameters reflecting Fe status and sTfR were determined before and after Fe supplementation.
Statistical analysis
A t test and variance analysis were used to compare the difference in all of the parameters determined among the four groups. Univariate correlation and multivariate stepwise logistic regression were used to analyse the relationship among the variables. Shapiro-Wilk test was used to analyse the distribution of TfR-F index. Receiver operating characteristic (ROC) curves were used to compare the corresponding areas of sTfR and TfR-F index in identifying Fe deficiency or functional Fe deficiency. All the analyses were conducted with SPSS 10.0. (SPSS Inc., Chicago, IL, USA).
Results
Levels of sTfR and TfR-F index in Fe-deficient children at different stages were summarized in Table 1. Compared with the normal children, sTfR was significantly higher in children with IDs (P < 0·05) and in children with IDE and IDA (P < 0·001). TfR-F index was also significantly higher in Fe-deficient children than that in the normal children (P < 0·001). From the relative ratio with fixed base and link relative ratios, there was more increase in progressive Fe deficiency.
Table 1 Values of serum transferrin receptor (sTfR) and transferrin receptor-ferritin (TfR-F) index in Fe-deficient and normal children§ (Values are means and standard deviations)
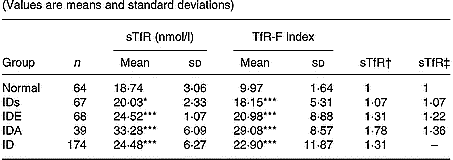
IDs, Fe deficiency store; IDE, Fe deficiency erythropoiesis; IDA, Fe deficiency anaemia; ID, IDs+ IDE +IDA.
Mean values were significantly different from those for normal children (variance analysis): *P < 0·05; ***P < 0·001.
† Ratio of values of sTfR and TfR-F index in groups to those in normal children: relative ratio with fixed base.
‡ Ratio of values of sTfR and TfR-F index in groups to those of the previous groups: link relatives ratio.
§ For details of subjects and procedures, see p. 1135.
Correlation analysis showed that sTfR was significantly correlated with SF, FEP, FEP/Hb and Hb (P = 0·01), and the correlation coefficients were − 0·375, 0·678, 0·670 and − 0·549. Regression analysis reported the regression equation as:
showing that the best predictors of sTfR concentration were FEP and Hb. The Fe status in advanced Fe-deficient children is shown in Fig. 1.
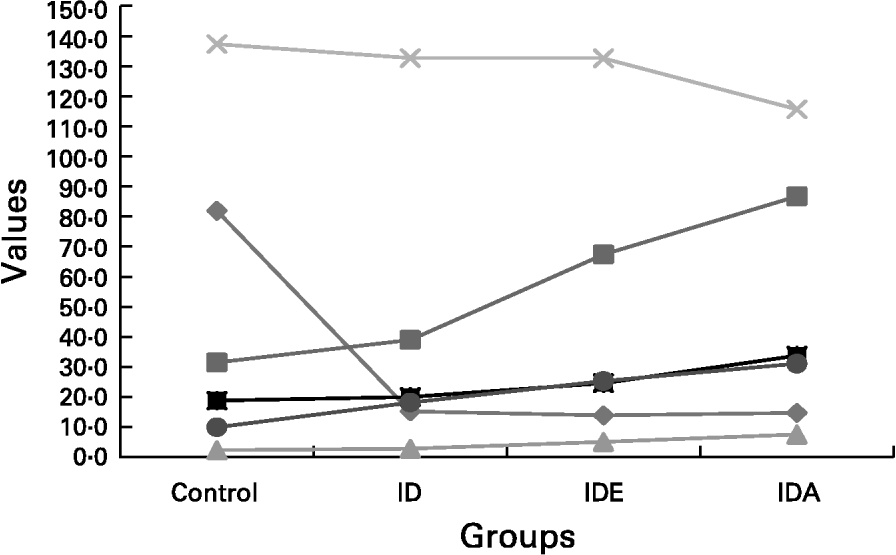
Fig. 1 The gradual diminution of the different Fe compartments including Fe store compartment and functional Fe compartment. The concomitant changes seen in the laboratory parameters reflecting Fe status were presented schematically in relation to the separate stages of advancing Fe deficiency (ID)., serum ferritin (10 μg/l);, free erythrocyte protoporphyrin (FEP; 10 μg/l);, FEP/Hb;, Hb (a/l);, serum transferrin receptor (nmol/l);, transferrin receptor-ferritin. IDE, Fe deficiency erythropoiesis; IDA, Fe deficiency anaemia. For details of subjects and procedures, see p. 1135.
After the 9-week Fe supplementation, with the exception of the FEP in children with IDs, the other parameters were significantly changed. sTfR was significantly decreased in children with IDs (P < 0·001), but not in the children with IDE and IDA (Table 2).
Table 2 Results of Fe status, serum transferrin receptor (sTfR) and transferrin receptor-ferritin (TfR-F) in Fe-deficient children‖ (Mean values and standard deviations)

IDs, Fe store depletion; IDE, Fe deficiency erythropoiesis; IDA, Fe deficiency anaemia; SF, serum ferritin; FEP, free erythrocyte protoporphyrin.
Mean values were significantly different from those obtained before supplementation (Student's t test): **P < 0·01; ***P < 0·001.
Mean values were significantly different from those obtained before supplementation (Student's t test): †††P < 0·001.
‡ Levels of laboratory parameters in Fe-deficient children.
§ Levels of laboratory parameters in Fe-deficient children after supplementation.
‖ For details of subjects and procedures, see p. 1135.
In normal children, TfR-F index ranged from 9·57 to 10·37; its apparent conformation to Gaussian distribution (Fig. 2) was verified with a Shapiro-Wilk test (w 0·946, P = 0·006). After supplementation, there was a significant decrease in TfR-F index in all of the Fe-deficient groups (P < 0·001, Table 2).
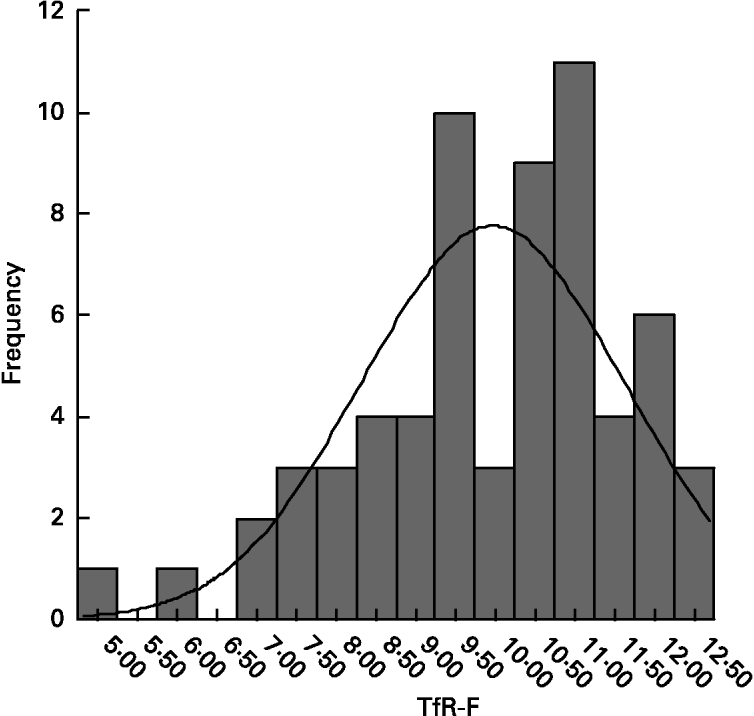
Fig. 2 Distribution of transferrin receptor-ferritin (TfR-F) index in normal children (mean 9·97 (sd 1·64), n 64). Conformation to Gaussian distribution was verified with a Shapiro-Wilk test (w 0·946, P = 0·006). For details of subjects and procedures, see p. 1135.
Table 3 shows that the levels of sTfR and TfR-F index were not influenced by gender and age.
Table 3 Values of serum transferrin receptor (sTfR) and transferrin receptor-ferritin (TfR-F) index in normal and Fe-deficient children by deficiency gender and age* (Mean values and standard deviations)
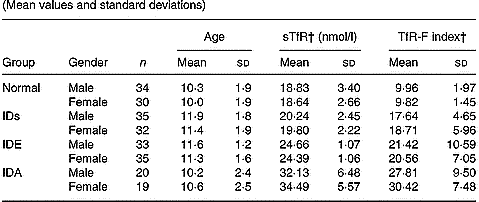
* For details of subjects and procedures, see p. 1135.
† The levels of sTfR and TfR-F index were not influenced by gender and age.
IDs, Fe store depletion; IDE, Fe deficiency erythropoiesis; IDA, Fe deficiency anaemia.
ROC curves of sTfR and TfR-F index in the identification of IDs, (SF < 20 μg/l) from children being investigated are shown in Fig. 3. The area under the ROC curves (AUCROC) showed the parameter for distinguishing Fe-deficient children with IDs from normal children. AUCROC 0·983 of TfR-F index, compared with sTfR with AUCROC 0·777, indicated proper diagnostic efficacy for identifying IDs. ROC curves of sTfR and TfR-F index in the identification of functional Fe deficiency (Fe-deficient children with IDE and IDA) are shown in Fig. 4. The AUCROC showed the parameter for differentiating children with tissue Fe deficiency from the normal. STfR with AUCROC 0·998 had more diagnostic efficacy for identifying functional Fe deficiency, with higher sensitivity and specificity for detecting tissue Fe deficiency.
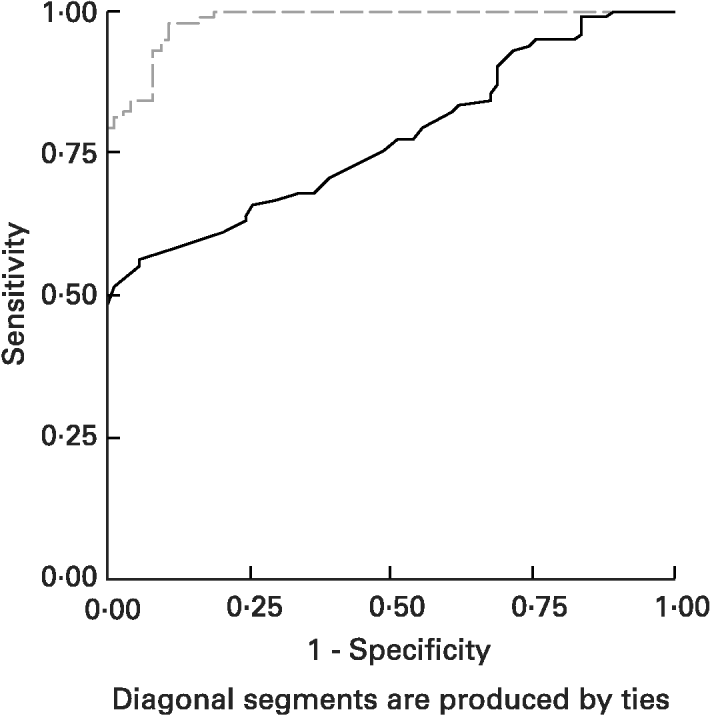
Fig. 3 Receiver operating curves (ROC) for serum transferrin receptor (sTfR; ——) and transferrin receptor-ferritin (TfR-F) index (- - - - -) in the identification of Fe store depletion (IDs; serum ferritin < 20 μg/l) from children. The area under the ROC (AUCROC) showed the parameters to differentiate IDs children from normal children. AUCROC 0·983 of TfR-F index, compared with sTfR, corresponding to AUCROC 0·777, shows proper diagnostic efficacy for identifying IDs. For details of subjects and procedures, see p. 1136.
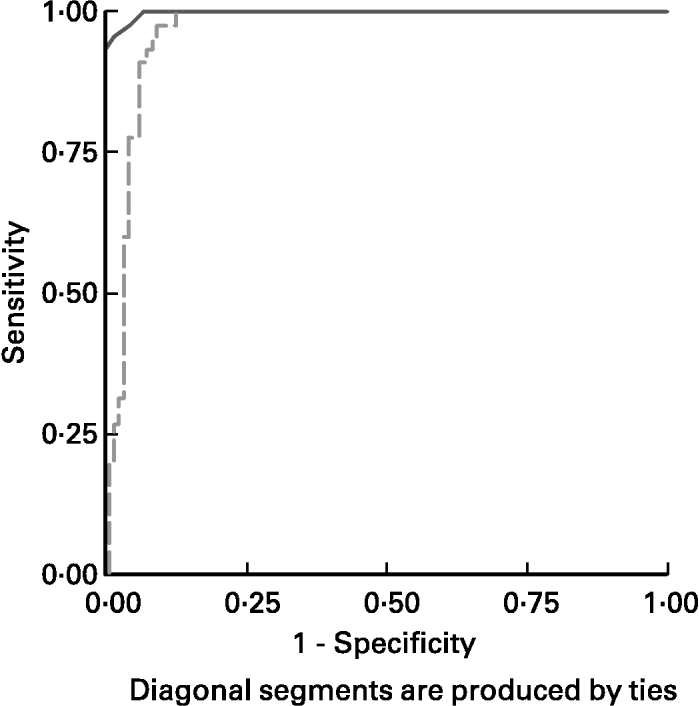
Fig. 4 Receiver operating curves (ROC) for serum transferrin receptor (sTfR; ——) and transferrin receptor-ferritin (TfR-F) index (- - - - -) in the identification of functional Fe deficiency (Fe-deficient children with Fe deficiency erythropoiesis and Fe deficiency anaemia). The area under the ROC showed the parameter for differentiate Fe-deficient children with tissue Fe deficiency from normal or children with only Fe store deficiency. STfR, with corresponding AUCROC 0·998 had more proper diagnostic efficacy for identifying functional Fe deficiency, with higher sensitivity and specificity for detecting tissue Fe deficiency. For details of subjects and procedures, see p. 1136.
Discussion
The sequential process of Fe deficiency from the Fe-replete state to IDA is the depletion of storage Fe compartment, followed by Fe exhaustion and initiation of depletion in the functional Fe compartment in the setting of continued Fe loss (IDE), which then develops to overt anaemia (IDA) (Skikne et al. Reference Skikne, Flowers and Cook1990). There is no additional physiological phenomenon associated with the development of IDA, which is merely a sequel of progressive depletion of functional Fe compartment. Only the laboratory parameters with high sensitivity and specificity to reflect Fe status can identify a patient with subclinical Fe deficiency or functional Fe deficiency (Punnonen et al. Reference Punnonen, Irjala and Rajamaki1997; Mei et al. Reference Mei, Cogswell, Parvanta, Lynch, Beard, Stoltzfus and Grummer-Strawn2005).
Establishing a reliable method for assessing functional Fe status is essential to screen Fe deficiency in children, a high-prevalent population. sTfR cellular uptake of Fe and the expression in cells reflect Fe requirements and erythropoietic activity (Flesland et al. Reference Flesland, Eskelund, Flesland, Falch, Solheim and Seghatchian2004). sTfR is a reliable parameter for assessing functional Fe status and erythropoietic activity in adults (Vazquez Lopez et al. Reference Vazquez Lopez, Carracedo Morales, Munoz Vico, Morcillo Llorens, Calvo Bonachera, Lopez Munoz and Munoz Hoyos2001; Mei et al. Reference Mei, Cogswell, Parvanta, Lynch, Beard, Stoltzfus and Grummer-Strawn2005), but little is known about its role in children. In the present study, compared with normal, sTfR in children with IDs was significantly increased. With progressive functional Fe deficiency, the concomitant changes of sTfR and the ratio of sTfR:log SF appeared to be consistent with earlier studies (Suominen & Punnonen, Reference Suominen and Punnonen1998), the values of them in functional deficiency were greatly different from those of normal. In the current study, we found that sTfR was significantly increased with progressive Fe deficiency. During the period when IDA progresses and before severe Fe deficiency occurs, a big change has been observed in the value of sTfR, which suggests that sTfR is a sensitive parameter to detect Fe deficiency, even for subclinical Fe deficiency.
The best correlation of sTfR to FEP and Hb, which are general parameters to reflect the function of Fe compartment, also indicated that the sTfR is a reliable tool for the assessment of functional Fe status. In the current study, regression equation of sTfR showed that FEP and Hb were the best indicators of sTfR, which suggests that sTfR measurements are useful in the diagnosis of functional Fe deficiency.
The present results also showed that the levels of sTfR and TfR-F index were not influenced by gender, which is in agreement with an earlier study (Hou & Wu, Reference Hou and Wu1999). Table 3 shows that there was no difference among age groups. Virtanen et al. (Reference Virtanen, Viinikka, Virtanen, Svahn, Anttila, Krusius, Cook, Axelsson, Raiha and Siimes1999) reported that the association between sTfR and Fe store was similar in all ages and that no age-specific difference in the physiologically lower Fe stores existed between children and adults. In healthy children, sTfR concentrations were related to erythropoietic activity and intracellular Fe requirements and sTfR concentrations were elevated in children with more Fe store for growth (Vazquez Lopez et al. Reference Vazquez Lopez, Carracedo Morales, Munoz Vico, Morcillo Llorens, Calvo Bonachera, Lopez Munoz and Munoz Hoyos2001). In the present study, no age-specific difference was observed, which is probably related to the small number of subjects in each age group, or really no difference in the different age groups. Therefore, it is necessary to further explore the age-specific values of sTfR in school-aged children.
ROC curve is an effective method to evaluate diagnostic tests comprehensively and precisely. It can identify the diagnostic efficiency of tests by calculating AUCROC. It takes sensitivity (true positive rate) as Y-coordinate and 1-specificity (false–positive rate) as X-coordinate. Many pairs of true positive rates and false positive rates in the correlation comprise the whole curve. Values of AUCROC range between 1·0 (perfect separation of the values of two groups) and 0·5 (no apparent distributional difference between two groups of the values). This is a quantitative, descriptive expression of how close the AUCROC is to the perfect one (value 1·0) (Zweig & Campell, Reference Zweig and Campell1993).
We compared the results of ROC analysis, which, in the stage of IDs compartment, compared with TfR-F index corresponding to AUCROC 0·983, sTfR corresponding to AUCROC 0·777, was not the more sensitive parameter reflecting Fe store. This was consistent with the findings from earlier studies and reviews, that TfR-F index, in combination with SF (the best test-index for Fe store) and with sTfR (functional Fe compartment), has proper sensitivity and specificity for detecting children with IDs, especially in the Fe-deficient state, and that the results of sTfR and SF assays are ambiguous for detecting Fe deficiency (Hastka et al. Reference Hastka, Lasserre, Schwarzbeck, Reiter and Hehlmann1996; Allen et al. Reference Allen, Backstrom and Cooper1998). However, sTfR corresponding to AUCROC 0·998 was of great value in the diagnosis of functional Fe deficiency in children, reflecting proper diagnostic sensitivity and specificity for identifying functional Fe deficiency (Zweig & Campell, Reference Zweig and Campell1993).
It was further confirmed that the sTfR can accurately reflect functional Fe status and TfR-F is an overall and sensitive index to reflect total Fe status; thus, both can be considered as specific and reliable indices for screening Fe deficiency. WHO also recommends that it is the best way to assess Fe status. Therefore, using the sTfR to assess Fe status of school-aged children and screen out the children with early Fe deficiency is of great importance to the lower morbidity rate of school-aged, Fe-deficient children, leading to effective Fe supplementation and improving the health status of the children.
There are also more advantages for sTfR to be a parameter for detecting Fe deficiency in children. First, microlitres of sample for determining are easily available for children. Second, sTfR changes greatly with progressive functional Fe deficiency. Results indicating proper diagnosis efficiency for functional Fe deficiency provide grounds for a reliable measurement reflecting Fe status, to screen Fe deficiency especially functional Fe deficiency. Collectedly, sTfR is a reliable measurement of Fe status for detecting Fe deficiency in children, especially in epidemiological surveys to observe the prevalence of Fe deficiency, in contrast with the conventional Fe parameters reflecting the different aspects of Fe status. SF reflecting Fe store is also an acute phase reactant, Hb reflects severe Fe deficiency and FEP reflects tissue Fe deficiency, changing only at the stage of insufficient Fe for erythropoiesis.
Currently, few reports have shown the changes of sTfR after Fe supplementation. In the present study, we implemented a 9-week oral Fe supplementation with Fe-deficient children. As it is difficult for normal children to take a placebo, we tried to compare the values of laboratory parameters reflecting Fe status before and after supplementation. As there were no dietary restrictions during the supplementation, there were no dietary changes in the children during the study. In the intervention study, we found sTfR decreased significantly and SF increased by 2·9 times after Fe supplementation in the children with IDs. Although in the children with IDE and IDA, SF, FEP and Hb changed significantly (P < 0·001), values of SF in two out of thirty children with IDE and six out of thirty with IDA were still below the normal range, which was consistent with the results of Suominen & Punnonen (Reference Suominen and Punnonen1998), that the improvement of Fe store compartment was completed after that of functional Fe compartment. After Fe supplementation, no significant change of values of sTfR was found, possibly because sTfR is not sensitive to Fe supplementation, during the improvement of Fe status. It was difficult for us to collect venous blood continually, so we could not observe the changes in a timely fashion. Similarly, Hou et al. (2002) found the level of sTfR decreased after 16-week Fe supplementation for the IDA patient, and the change arose 4 weeks after the outset of changes of SF and transferrin saturation (TS), so sTfR was not considered as a sensitive parameter for evaluating the efficacy of Fe supplementation (Simek et al. Reference Simek, Remkova and Kratochvilova2002). However, we found TfR-F index greatly significantly decreased in Fe-deficient children at different stages, and even in the state of severe Fe deficiency, still with SF in abnormal levels after supplementation, TfR-F index changed significantly. In the present study, the supplementation-induced change was made most apparent by using the TfR-F index. Similar supplementation-induced change had been observed by Suominen & Punnonen (Reference Suominen and Punnonen1998). Therefore, TfR-F index was more sensitive to evaluate the efficacy of the intervention. After logarithmic transformation of ferritin values, the distribution of TfR-F index conforms to Gaussian distribution, so the formation can suitably reflect Fe status. In addition, both sensitivity and specificity were improved (Huo et al. Reference Huo, Sun and Miao2002). Results indicated that the index changed maximally with supplementation in Fe deficiency and TfR-F index can be introduced as a reliable parameter for evaluating the efficacy of the intervention programme.
In conclusion, sTfR can be introduced as a reliable tool for assessing functional Fe status in children and TfR-F index is a sensitive parameter for assessing the efficacy of Fe supplementation.


