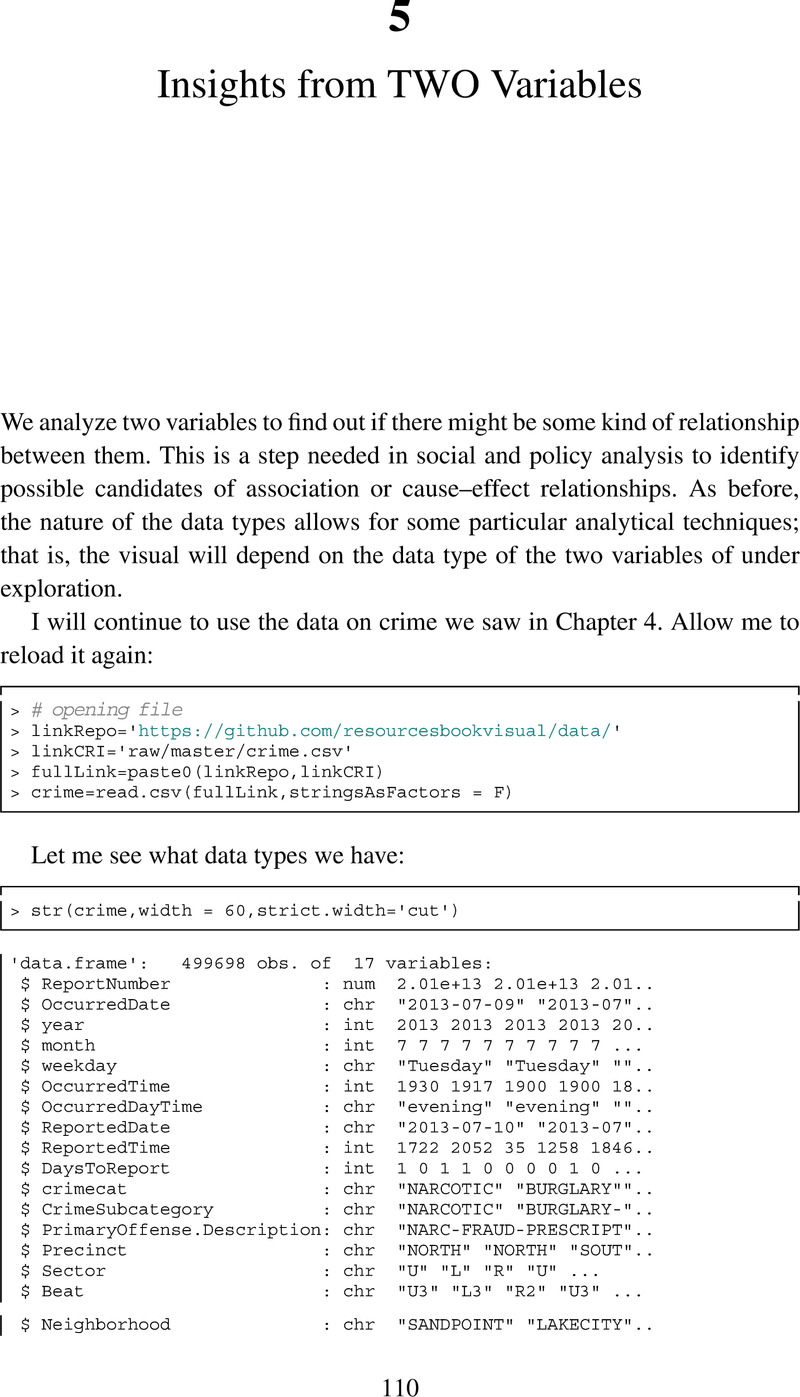
5 - Insights from TWO Variables
from Part Two - Visualizing Tabular Data
Published online by Cambridge University Press: 10 March 2022
Summary

- Type
- Chapter
- Information
- Data Visualization for Social and Policy ResearchA Step-by-Step Approach Using R and Python, pp. 110 - 166Publisher: Cambridge University PressPrint publication year: 2022

