Dietary changes that have occurred in western industrial cities over the past three centuries and their spread down social hierarchies have led to the term ‘nutrition transition’.Footnote 1 Nutrition transition evolved at a different pace from country to country but generally included two different phases. The first phase was characterized by improvements in food production and distribution, with an increase in real income leading to a greater consumption of cereals, root vegetables and legumes. A second phase was characterized by a growth in the consumption of products with higher animal protein content, such as meat, fresh fish and a wide range of dairy and poultry products.Footnote 2 Clearly tied to modernization processes, these changes in diet and especially the growing consumption of meat were typical of urban populations and can be used as key indicators of the nutrition transition.Footnote 3 Alongside other factors – such as increases in earnings, intensified livestock farming, scientific progress and the shaping of a national meat market – urban development processes became key drivers of change in the growing consumption of meat.Footnote 4
The aim of this article is to reconstruct the nutrition transition process in Barcelona using data on meat consumption between 1709 and 1935. We have produced two long-term graphs (Figures 1 and 2) illustrating the consumption of meat in Barcelona based on primary sources, mainly municipal slaughterhouse bookkeeping data.Footnote 5 The graphs represent the evolution of supply and per capita meat consumption in the city, improving and broadening the scope of previous estimates.Footnote 6 The long-term results clearly confirm the existence of a nutrition transition, although they are neither as linear nor as simple as more concise explanations suggest. We highlight the dramatic drop in meat consumption levels between 1740 and 1840 and their subsequent recovery that passed through three distinct phases. First, there was a marked increase in mutton consumption. This was followed, secondly, by a phase in which pork consumption increased and, thirdly, there was a rise in the consumption of young meats with higher protein content, in particular veal, at the turn of the twentieth century. These changes were related to the impact of rail supply.
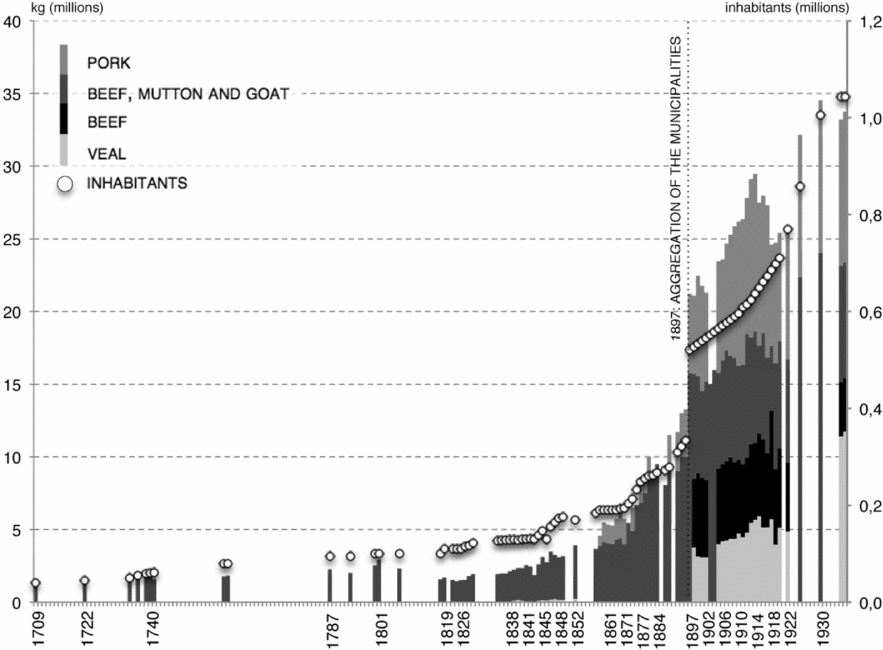
Figure 1: Total consumption of carcass meats in Barcelona, shown in kilograms, 1709–1935
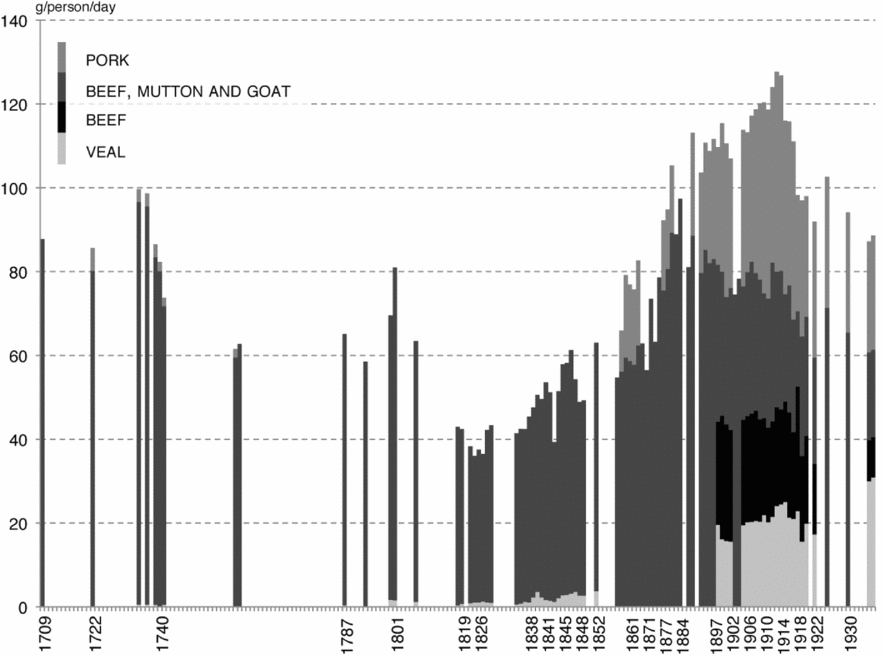
Figure 2: Consumption of carcass meats in grams per person per day in Barcelona, 1709–1935
The article goes on to examine the role of meat distribution in the city. We discuss how the spatial accessibility of consumers to retail outlets contributed to meat consumption and how this factor can be used to analyse stratification and diversification. We cannot understand meat consumption by exclusively analysing urban supply. It is also important to pose questions about how meat reached the social geography of consumers through the structure of meat retail. Meat in nutrition transition and the spatial distribution of meat marketing facilities were two sides of the same coin.
Meat consumption: a good indicator of the early stages of the nutrition transition
Bread and meat were considered the two key staples for urban populations, and maintaining their supply was the foremost municipal concern during the frequent subsistence crises of the nineteenth century. They were two foodstuffs that remained on the mesas de preferencia, market stalls with limited prices, conceived in order to contain the cost of living. From the liberalizing decree of 1834, which provided freedom of commerce and sale of items for ‘eating, drinking and burning’, and the decree of 30 August 1836, which liberalized the sale of bread, the estimation of bread consumption becomes even more difficult to establish. Meat, in contrast, continued to be the most highly taxed food item, with a systematic centralized supervision at municipal slaughterhouses, a fact that makes it easier to study the evolution of its consumption. Laureano Figuerola, who documented and studied consumption in the period between 1830 and 1849, considered meat to be the most appropriate food item for estimating the evolution of consumption. He considered it even better than bread for this purpose, ‘not only as a more nutritional substance but also as a type of food indicator by which to judge the level of wealth and welfare being achieved by the people’.Footnote 7
Figure 1 shows increase in meat consumption and population growth. Only as of the 1870s – when the railway network was fully functioning – was meat consumption growth higher than population increase. As of 1897, the Municipal Statistical Yearbooks provide more precise information on the different types of meat. Figure 1 shows the diversification process of the types of meat on offer and the clear increase in the amounts of pork and beef. Figure 2 shows the consumption of carcass meat per inhabitant and is even more significant, although a number of ranges need some explanation. The first surprising aspect is the high meat consumption per capita, in relative terms, in the first part of the eighteenth century. According to estimates for the fifteenth century, this figure had remained unchanged since the late Middle Ages. In 1462, the municipal government estimated a total consumption of around 75 grams per person per day.Footnote 8 In these calculations, the low proportions of pork and beef were similar to those of the eighteenth century. It is also surprising to note the steep fall in meat consumption over the course of the eighteenth century, from 80–100 grams per person per day to 60 grams per person per day. This occurred during a period of intense economic and population growth, with the number of inhabitants in the city essentially increasing threefold between 1700 and 1800. Some explanatory factors can be suggested. In terms of supply, most authors agree that the rapid population growth of the eighteenth century was sustained by crop rotation on new agricultural land and that, moreover, ‘the concentration of single-crop farming eliminated many pastures and restricted the number of animals that farmers could own’.Footnote 9 If we combine this reduction in livestock with Spain's population growth – that increased from 9 million in 1750, to over 16 million in 1865 – the cause of the sudden fall in supply per inhabitant becomes clear. In terms of demand, urban areas were privileged and as in the lower Middle Ages the municipal government had the resources to ensure regular supply. Nonetheless, as has been observed in other periods of urban expansion, population growth as a result of an influx of rural migrants – with low purchasing power and unaccustomed to eating meat – led to a decline in meat consumption per capita rather than a rise.Footnote 10 These conditions were aggravated by the Napoleonic occupation of 1808–14 and the deep crisis of the opening decades of the century. Consequently, Figure 2 shows a continuous and steep downtrend between 1808 and 1837.
After 1837, the very moderate increase in per capita consumption could simply be attributed to the recovery of previous values. However, its sustained character over the long term indicates a decisive turning point, a structural change probably linked to the liberalizing process in the agrarian economy. This increase in per capita consumption was not the result of the deregulation of municipal policy, which remained highly interventionist in order to tackle fiscal problems and to manage the recurring provisioning crises. Neither did the protectionist principles that dominated Spanish politics from the opening decades of the century advocate a radical liberalization. Presumably, the most decisive measures were those related to the disentailment of church properties and the releasing of properties owned by nobility for other uses. Both led to the progressive incorporation of new lands into the market economy and to the increase of production capacity in the agrarian sector, two crucial factors to sustain population growth.Footnote 11
Between 1868 and 1885, we can observe a clear uptrend, with average amounts increasing from 62.9 grams per person per day to 97.4 grams per person per day (Figure 2). In the entire series, as of the eighteenth century, this represents the maximum increase in beef, mutton and goat consumption per inhabitant. After 1885, the increase in consumption per inhabitant is due mainly to the inclusion of pork in the diet. Between 1868 and 1880, the city also experienced a peak in population growth. In the 33 years between 1835 and 1868, the population increased by 65,000, at an overall annual rate of 1.27 per cent. Subsequently, between 1868 and 1885, the population increased by 74,000 inhabitants, at an overall rate of around 2 per cent. The railway link completed in 1868 between Barcelona and Valencia – already connected to inland provinces – was the first major route for the transportation of livestock (Figures 3a, 3b and 3c). This railway line transported the highest volumes of livestock in the 1870s before becoming more level after this date. By comparing statistical data from 1885 and 1913, we can identify minor changes and we can assert that by 1885 the provisioning system had reached full maturity.Footnote 12 It is also quite clear that Madrid enjoyed the most advantageous position in the rail network and a relative proximity to the livestock-rearing provinces.
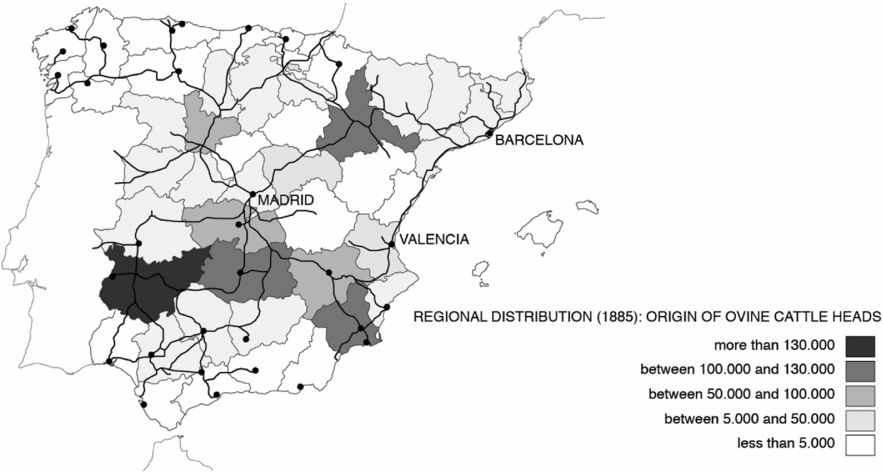
Figure 3a: Provinces supplying sheep and rail system, 1885

Figure 3b: Provinces supplying pigs and rail system, 1885
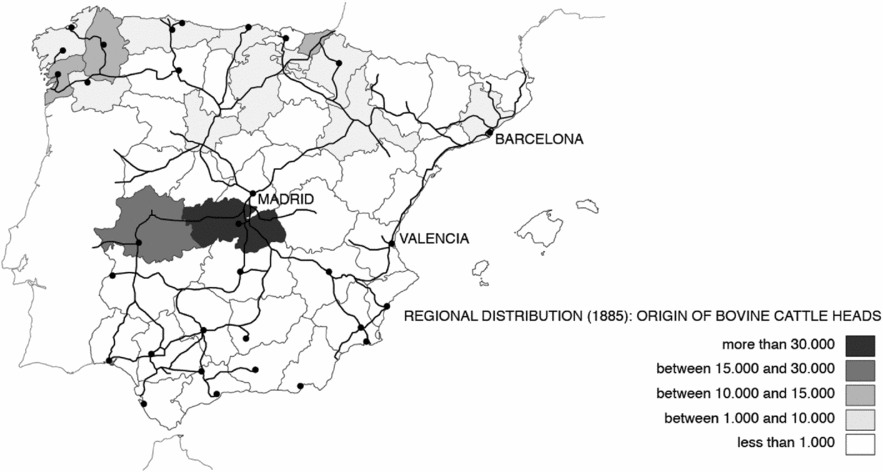
Figure 3c: Provinces supplying beef cattle and rail system, 1885
Changing patterns of meat consumption
Although consumption in Spanish cities remained below that of major western cities, the significant increase during the second half of the nineteenth century shows the emergence of a national market, which was the goal of the government's protectionist policies. In this new setting, relatively high meat consumption became an indicator of urban development and especially of modernization. Data from the city of Valencia for these years points to two aspects that should be highlighted. First, the very low numbers of livestock imported via ship as compared to the numbers imported by rail, and, secondly, the greater consumption of meat in cities as opposed to in rural areas. If we compare the numbers of livestock unloaded from ships in the port, less than 1 per cent of those transported by rail, we can see the profoundly protectionist character of the Spanish economy, which was set on safeguarding its national industry and consolidating the national market.Footnote 13 By the end of a century defined by severe agrarian crises, railways were the key component to achieve a new agriculture and livestock distribution system for the supply of large cities. The rigid and, to a point, autarchic nature of the agrarian economy, which was somewhat unproductive, led to severe limitations in the provisioning of cities and contrasted starkly with economies that were more open as a result of their capacity for territorial expansion, such as the United States, or countries that imported meat supplies from far-off markets, such as Britain.Footnote 14
Under these circumstances, the consumption of meat in cities such as Barcelona was very modest when compared to the United States, Australia or other European capitals. According to an article from 1881 criticizing meat provisioning in the city, meat consumption per person per day was 250 grams in London, 210 grams in St Petersburg and 142 grams in Paris. In Barcelona, however, the figure remained below 95 grams.Footnote 15 Nonetheless, this figure was significantly higher than that of most rural areas. Similar patterns are discernible elsewhere in Spain. For instance, in 1905 the total consumption of meat in the city of Valencia was 2.8 times higher than the rest of the province. In the case of Alicante, this figure was 2.3 times higher, and in the case of Castellón it was 3.6 times higher.Footnote 16 In the case of Madrid, it is also estimated that in 1916 the consumption of meat among the urban population was almost three times higher than that of the rural population (96.7 grams per person day compared to 35.6 grams per person day).Footnote 17 In 1930, the inhabitants of Barcelona consumed 5.32 times more beef than the rest of Catalonia; 2.68 times more pork; and 1.82 times more mutton.Footnote 18 Again, we observe that meat consumption depended on the modernization of transport and city provisioning systems, which can also serve as indicators of a country's level of urban development.
In the first stage of the nutrition transition, mutton and beef consumption dominated and grew, particularly between 1868 and 1885. This was followed by a significant increase in the consumption of pork. The second stage of nutrition transition was characterized by a growing diversification of types of meat, with a notable increase in veal and, to a lesser extent, lamb and kid goat, which brought about a considerable reduction in the consumption of mutton and beef.
Between 1900 and 1935, although data is lacking for several years, a comparison can be made between the consumption of meat in Barcelona and Madrid (Figure 4).Footnote 19 Although the overall meat consumption habits per person were similar, some notable differences existed regarding the individual types of meat being consumed. In Madrid, where mutton had traditionally dominated, by the end of the nineteenth century, unlike other Spanish cities, beef consumption clearly prevailed and fewer calves were slaughtered in comparison to Barcelona. The consumption of pork was also clearly higher in Barcelona where the reduction of mutton consumption also occurred later and at a slower rate.

Figure 4: Consumption of meat in grams per person per day in Madrid and Barcelona, 1900–35
From the marked difference between the types of meat consumed in Barcelona and Madrid, we can draw a number of hypotheses. Both cities were supplied with the surpluses of an under-capitalized agricultural sector using traditional production methods, and protected by tariffs. Madrid, however, was closer and better connected to its livestock farms than Barcelona. Figuerola pointed out that between 1842 and 1849 Madrid's consumption levels improved by 60 per cent whereas in Barcelona, for the same period, levels only increased by 46 per cent.Footnote 20 The construction of the rail network placed Madrid in a central location that was even more favourable, and provided a less expensive supply (Figure 3). In Barcelona, which was more peripherally located further away, meat prices made pig and cow fattening farms an attractive option for the urban market. This factor coincided with the presence of an entrepreneurial farming network that, while not widespread, proved to be considerably dynamic. Interestingly, in 1852, the Catalan Agricultural Institute of St Isidore began publishing a journal to promote the modernization of the sector. The farming crisis at the end of the century, the destruction of vineyards as a result of the great French wine blight, as well as a fall in exports, prompted a renewed direction towards the supply of Catalonia's large urban and industrial centres.Footnote 21
Besides these differences, there are also similarities between the two cities (Figure 4). There is an initial upward trend, which in Madrid concluded in 1909 and in Barcelona lasted until 1914. This is followed by a downward trend to a trough in 1918, as a result of the war in Europe. The third phase is characterized by a recovery to pre-war consumption levels. By 1925, levels fall again, possibly due to the large influx of migrants from other Spanish regions in the 1920s. According to Nicolau Nos and Pujol Andreu, however, this fall cannot be explained by a decline in consumption levels alone, and points instead to a diversification in diet.Footnote 22 Everything seems to indicate that improvements in transport, distribution, conservation and storage, as well as increased market integration, allowed traditional foodstuffs, such as meat, to be replaced by other animal protein foods such as fresh fish, milk and eggs.Footnote 23
Which social strata benefited from the increase in meat consumption between 1868 and 1885? Figuerola stated that in 1849:
Only 12,300 families (of a population of 127,693 inhabitants) included meat as an ingredient in their meals, but those fortunate enough to enjoy the privilege expressed by the figure for 1849 should remember that there are a further 16,000 families in Barcelona, 11,000 at the very least, who do not have the assurance of consuming this same portion of healthy food on a daily basis and thus restore the energies spent at work. . .and must take recourse to eating ‘poor man's meat’, that is to say, codfish.Footnote 24
The estimates that Cerdà made on the food of the working classes in 1856 confirm the scant presence of meat in the diet of this stratum of society.Footnote 25 In around 1900, the economist Antonio Flores de Lemus asserted that ‘the greatest enemy of livestock farming in Spain was salt cod’, due to a tariff policy that meant, inexplicably, that salt cod was taxed less than the total taxes for the same quantity of meat.Footnote 26
Using data obtained from budgetary estimates of ‘consumptions’, it is interesting to contrast the upward trend in meat consumption with the downward trend in the consumption of salted fish. This shift can be viewed as an indicator of the progressive change in diet, which affected a large section of society (Figure 5). Figure 5 shows a constant and pronounced drop in salted fish consumption in Barcelona: in 1859, consumption of this foodstuff stood at almost 65 grams per person per day, twice that of mutton and beef, but by 1910, salted fish consumption stood at just over 6 grams per person per day.Footnote 27 This is clear evidence of the progressive change in the diet of the working classes. There is also a sustained rise in the consumption of meat: beef, lamb and goat meat, as well as of pork. In fact, the consumption of pork tripled while that of mutton and beef stabilized. The data reveals a substitution process that would mark the first phase of the nutrition transition.
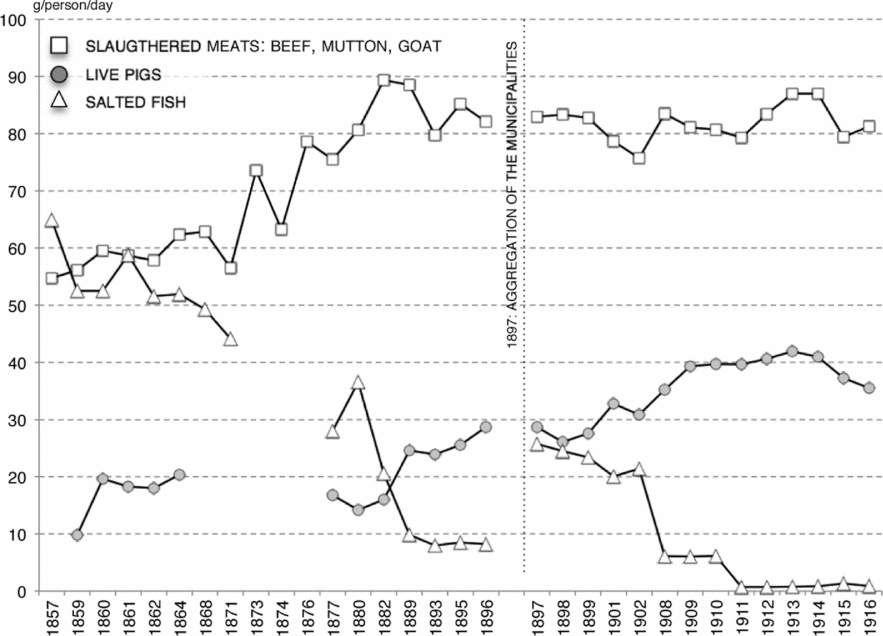
Figure 5: Comparative consumption of meat and salted fish in Barcelona, in grams per person per day, 1859–1916
We can only estimate which sections of society benefited from this surge in meat consumption in Barcelona, during a phase in which meat consumption was very closely related to the economic cycle. Although it is true that the increase in meat consumption per inhabitant corresponded with rises in real wages during the 1860s and, above all, in the years of the so-called ‘Gold Fever’ cycle (1871–82), it is no less true that these rises did not affect the wages of working women and that unskilled male workers remained unable regularly to afford meat until the turn of the twentieth century.Footnote 28 The surprising increase in salted fish consumption amongst the mainly working-class population resident on the plain of Barcelona in 1897 can only be explained by the disappearance of the many municipal boundaries which were previously susceptible to smuggling and by the improved control of illegal trafficking of foodstuffs (Figure 5).
In 1881, an article in La Vanguardia described meat as ‘the food of the future’, setting as an example the great consumption in the world's most advanced nations and, in particular, in leading western cities.Footnote 29 The issues involving the supply, quality and price of meat acquired growing prominence in public debate, and were reflected in local newspapers and in the city council's minutes. Two recurring criticisms were voiced: ‘In no other city of Europe is such poor meat eaten as in Barcelona’ and ‘meat in Barcelona has almost always been sold at high prices’.Footnote 30 In Madrid, there were also complaints regarding the quality of the meat.Footnote 31 It was around this time that the imperfections of the food market and the traditionally oligopolistic functioning of intermediaries became the focus of criticism. Once again, however, the city council failed to take the initiative.
Numerous articles published between the late nineteenth century and the 1920s criticized the poor quality of meat and the lack of control over its price. The causes were attributed to tax calculation methods that favoured lean animals, to the price and duration of railway transport and, above all, to the lack of a free market for livestock. During this same period, the Catalan Agricultural Institute of St Isidore used the same argument also to advocate for the establishment of a central wholesale market for fruit and vegetables. The purpose was to lower the prices of these goods to the benefit of consumers and producers, and to eradicate the profit made by the established oligopoly of intermediaries. In both the provision of meat and fruit and vegetables, price increases were attributed above all to the oligopolistic interests of the intermediaries and, specifically in the case of meat, to the suppliers who employed purchasing or commission agents in the production areas. An article from January 1896 stated categorically that ‘the establishment of the livestock market. . .does not suffice. . .Above all, it is necessary to shatter the monopoly that the suppliers have been exercising and to release butchers completely from commitments, putting them into direct contact with livestock breeders. It appears that none of this has been done or even attempted.’Footnote 32 As in the case of fruit and vegetables, the municipal administration was accused of neglect or even connivance. Nevertheless, in 1921, Rossell suggested that the recurrent campaigns against suppliers, while always well received by the public, were not always fully justified. He held that what raised the prices of meat was not the suppliers, but rather the commercial system in which they acted, and he defended the regulatory function of the central or free market. Rossell doubted that suppliers would be eliminated with greater controls, contrary to what some believed.Footnote 33
Public markets and butcher shops: retail outlets and the stratification of consumption
It is not easy to establish a direct correlation between the opening of new municipal markets and the increase in per capita meat consumption in cities. In 1840, nearly a decade after the point of inflexion on the consumption curve, the first two semi-covered markets were opened. The same can be said, to an extent, of the wave of new iron-framed markets that opened in 1876 – although they had been conceived during the six-year period following the Spanish Glorious Revolution (1868–74). In all, 14 new markets opened between 1836 and World War I, and the central slaughterhouse was inaugurated in 1891. The principal phase of meat consumption increase – from 1870 to 1914 – corresponded with the launch of these new facilities.
The building of the new slaughterhouse and the different district markets should be viewed in a context of urban development and modernization that drew its inspiration from large European cities and was accompanied by advances in supply infrastructures, health and nutrition, which would induce and spread new dietary habits. The new facilities were also urban policing measures that encompassed security, health, convenience and aesthetics. In this respect, it is important to observe the changes in the retail commerce of meat inside and outside municipal markets. By doing so, we can pinpoint how these habits were transformed and how they spread across the various areas of the city.
The demographic and urban growth of Barcelona, with new building in dispersed places, involved an extension of the meat distribution network and the establishment of retail premises close to consumers. Physical accessibility to stable sales points located close to potential consumers became an indispensable condition for meat consumption. As in other cities, Barcelona's butcher shops included those located inside public markets and those dispersed along the streets in the built-up fabric of the city. According to Cerdà’s data for 1852–56 and the Industrial and Commercial Tax Register, the number of tax-paying butchers more than doubled between 1856 and 1884, lowering the number of inhabitants per butcher shop from about 1,000 to less than 600. The aggregation of the working-class municipalities on the plain of Barcelona would again increase the number to over 700, a ratio that showed a progressive and slight decline in the first third of the twentieth century (Figure 6).Footnote 34

Figure 6: Evolution of butcher shops inside and outside public markets in Barcelona, 1852–1932/33
According to Cerdà’s 1856 data, of all the stalls selling meat at the five different municipal markets (none of which were in covered buildings except Santa Caterina and partially La Boqueria), almost half were located at La Boqueria. This was the city's largest meat market and, together with El Born, it accounted for 80 per cent of total meat sales.Footnote 35 The various butcher shops distributed throughout the city supplemented the meat retail network. Data in the Industrial and Commercial Tax Register and pertinent municipal documents for different years in the last third of the nineteenth century indicate that the number of butcher shops outside public markets grew less than the number of meat stalls located inside them. First, coinciding with the cycle of increasing meat consumption between 1868 and 1885, ‘new clusters’ formed at La Boqueria market with a total of 314 meat stalls in 1877, while at El Born market – with the opening of the covered market hall in 1876 – numbers rose from 56 to 124, to which 28 more stalls were added in 1885.Footnote 36 Between 1876 and 1889, the swift construction of a series of wrought-iron market halls significantly increased the number of butcher stalls for Barcelona's consumers. Finally, as a result of the municipal aggregation process (1897), new public markets were added to the network, forming a notable multicentred system with a total of 16 municipal markets (the majority of the covered type), which went to confirm the definitive predominance of meat stalls inside municipal markets with respect to those dispersed throughout the city. By the advent of the twentieth century, meat establishments at markets (excluding pork and poultry in all cases) numbered 1,033 stalls, representing 78 per cent of all the meat sales points in Barcelona. In stark comparison, only 284 butcher shops were located in scattered sites across the city.
The predominance of butcher shops in public market halls was further strengthened by the fact that markets also acted as poles of attraction for butcher shops that opened in nearby streets. In 1932, after a phase of de-concentration and scattering of butcher shops, between 18 per cent and 24 per cent of all the establishments selling meat and paying different taxes were still concentrated within a radius of 150 metres around the 18 market halls distributed throughout the city. When we analyse a radius of up to 300 metres, the aforementioned percentage rises to between 34.8 per cent and 40.4 per cent. In some lower-middle-class and working-class neighbourhoods, such as Gràcia, Montserrat Miller has found evidence that market vendors and shopkeepers were overlapping groups.Footnote 37 The relationship between the social class of the neighbourhood and the polarizing power of butcher shops is quite clear: neighbourhoods with higher meat retail concentration around the market hall were usually lower-middle class and working-class neighbourhoods such as Barceloneta, Santa Caterina, Hostafrancs and Sants, Gràcia as well as Sant Andreu and Poblenou (Figure 7).Footnote 38 Butcher shops in wealthy districts were instead scattered across the entire area.
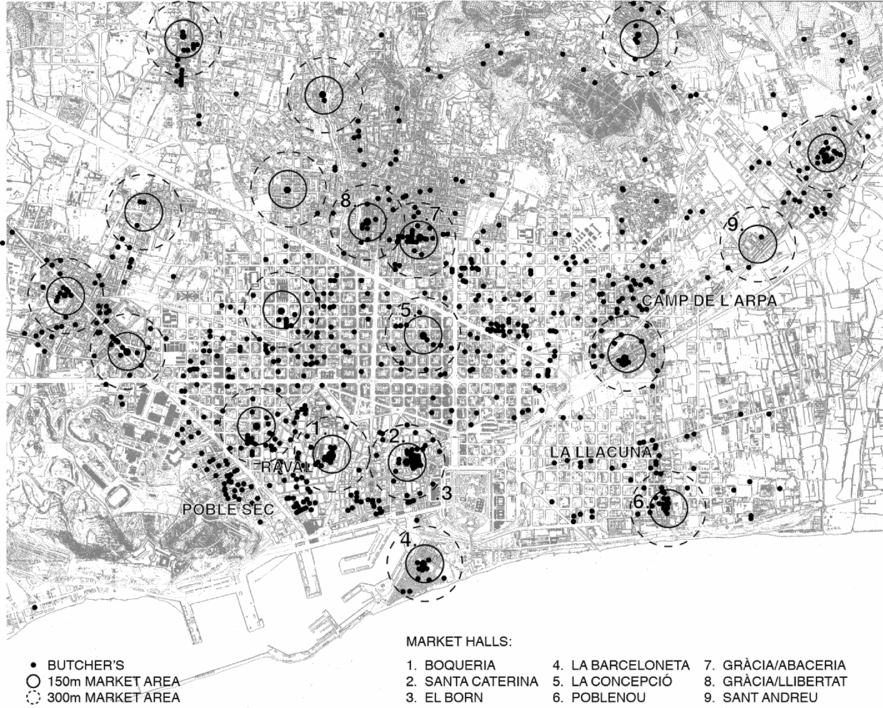
Figure 7: Map of Barcelona butcher shops, 1932–33
The trend for butcher shops to establish themselves in locations outside the public markets progressed inexorably in the following years. Between 1920 and 1921, 29 per cent of butcher shops were located outside municipal markets. By 1932–33, this figure had reached 43 per cent. In 1936, figures given by the association of butchers (Associació de Carnissers) stated that over half of the city's butcher shops were located outside the markets. The association also recorded complaints about the existence of numerous establishments being operated by rogue butchers.Footnote 39 The reason for the increase of butcher shops outside is clear: very few new markets had been erected since the beginning of World War I and almost all new butcher shops that opened during the period of urban population explosion, between the wars, were dispersed establishments (Figure 7). Stricter rules on minimum distances between butcher shops and between butcher shops and the markets – introduced in 1927 and 1936 – may also have encouraged sprawl. The spread of new butcher shops during the inter-war years in working-class and lower-middle-class neighbourhoods perhaps indicates how the rise in real wages as of the end of World War I and in the early 1920s and later, during the Spanish Republic, affected meat consumption among the working classes. Mixed working-class and lower-middle-class neighbourhoods like Raval Sud, Poble-sec, Camp de l'Arpa or La Llacuna lacked markets and were supplied by these new butcher shops which opened along their streets. This was not often the case in the new proletarian and immigrant neighbourhoods that mushroomed on the outskirts of the city after the end of World War I. Barcelona's suburbs, which boomed in the inter-war period, not only lacked covered markets but also a decent network of butcher shops. These ‘second peripheries’ were the city's most precarious meat retailing areas. While some of these new suburbs had one or several butcher shops, others had none at all, particularly those that were difficult to access and the shanty towns along the coast and on the mountain of Montjuïc.Footnote 40
The graph of average meat consumption (Figure 5) does not reflect the social differences and inequalities in consumption, but it does explain how salted fish (‘poor man's meat’) was replaced by meat. As of the end of the nineteenth century, however, this graph fails to reflect the expansion of the range of available high-protein foods, such as milk, eggs and fresh fish. It does reflect, however, the improvements in quality, such as the spread of young meats, such as veal, lamb and kid goat, which were more expensive than bull and cow meat and traditional mutton. The network of butcher shops located inside and outside the municipal markets actively contributed to the change in meat consumption in this second phase of the nutrition transition. This change, which significantly enriched the diet of Barcelona's inhabitants in terms of animal protein, may be verified by examining the data on the meat stalls at the municipal markets between 1902 and 1921. The number of stalls selling young meat versus the total number of meat stalls rose from 34 per cent in 1902 to 48 per cent in 1921.Footnote 41 At the beginning of the 1920s, almost half of the meat supply to Barcelona's market stalls was veal and, to a much lesser extent, lamb or kid goat. While the number of stalls selling mutton or beef decreased in absolute terms, the number of those selling meat from young animals grew by 215.
As Rossell suggested in El problema de les carns (The Meat Question) in 1921, the ‘smallholding’ structure of Barcelona's meat retail trade – involving a large number of very small butcher shops, practically all of them concentrated in the municipal markets – increased the demand for small cuts, which favoured the commercialization of young meat.Footnote 42 In the statistics for stalls at municipal markets, it is also interesting to note that the expansive phenomenon of the sale of meat from young animals was socially stratified, with highly significant changes across Barcelona's social space. Over the course of these 20 years, in the eight public markets in the city centre where the more prosperous classes lived, adult meat was gradually replaced by meat from young animals (young meat rose from 38 per cent of the total meat supply to 52 per cent) reaching 59 per cent at La Concepció market and 69 per cent at El Born market. In working-class and lower-middle-class suburbs, the composition of meat supply on the stalls of new public markets was different: in 1902, the supply of young meat represented only 23 per cent of the total meat supply. Although the supply of young meat on stalls did not equal that of adult meat at any of the markets, the number of stalls selling young meat had risen significantly to 40 per cent by 1921. This upward trend in the availability of young meat stalls in new markets in working-class and lower-middle-class suburbs was of a different character: new stalls selling young meat opened without replacing the stalls that sold adult meat, as was the case with the public markets of Barcelona's wealthier districts.
The consolidation of these young meats in the diet at the turn of the century acquired great impetus in the second decade of the twentieth century and especially during World War I. In 1920, 70 per cent of livestock at Barcelona's slaughterhouses were for veal, lamb or kid goat, and by the 1930s this figure had risen to over 80 per cent, with a spectacular drop in traditional mutton.Footnote 43 By the beginning of the 1930s, with the highest real wages since World War I, young meats became more accessible to Barcelona's unskilled workers because their purchase now represented only half their daily wages. Nevertheless, a fair proportion of unskilled immigrant workers – recently arrived from regions outside Catalonia such as Valencia, Aragon, Andalusia or Murcia – could not spend their wages on meat because of the irregular nature of their employment. Similar to the workers of the nineteenth century, they still maintained their diet of salted fish, as well as mutton meat in traditional escudella soup. Consequently, it is fair to say that meat consumption was not only stratified in terms of the urban space but also from a social perspective.
Conclusion
The case of Barcelona confirms that the concept of ‘nutrition transition’ is useful for describing the evolution of diet in the long term. At the same time, however, it shows how generalizations mask many specific and relevant aspects from their historical and geographical contexts. It allows us to state, first, how meat consumption from the Middle Ages until the eighteenth century was not as low as scholars from the nineteenth and twentieth centuries may have supposed, and that the high levels of relative consumption were probably common in part of the European urban world since the late Middle Ages. Secondly, although the increase in meat consumption as of 1836 may initially be simply due to the recovery of previous levels, its sustained character confirms the existence of a structural change. It is difficult, however, to attribute it to the liberal changes of a municipal policy characterized essentially by the continuity of the council controls and regulations.Footnote 44 The disentailment of church properties and the releasing of properties owned by the nobility were of a far greater significance as they allowed the expansion of agricultural production for the urban market. In the upward trend in consumption per capita, we should pay particular attention to the clear rise in consumption as of the 1870s when various rail links went into operation, allowing for the effective supply of Spain's major cities and the consolidation of an inland market during a period marked by protectionist policies. It was during the closing decades of the century that a policy was framed to construct public markets. This coincided with the building of the city's new slaughterhouse and the emergence of meat consumption as an object of public debate. Around the same time, the data demonstrates a process of diversification in the availability and consumption of other types of meats and a growing preference for younger meats.
Furthermore, by studying the evolution of the consumption of various key staples, two conclusions emerge. In an initial phase, during the latter half of the nineteenth century, we observe a process of salted fish substitution, especially that of salt cod (‘poor man's meat’), replaced by meat, which confirms the improvement of the working-class diet that had previously included only limited amounts of this foodstuff. In the last phase of the change, which occurred around 1920, the decrease in meat consumption per capita appears to have been due to the growth in consumption of other foods of animal origin that are high in protein, such as milk, eggs and fish.
It is more difficult to gain a clear understanding of the stratification of consumption. Although the fall in cod sales and the opening of butcher shops in working-class neighbourhoods confirm the extent of dietary improvements, all indicators suggest substantial differences between the various social strata. Documentary sources do not permit an exhaustive study of social differences in meat consumption. Some spatially related evidence regarding the retail sale of meat does suggest, however, that the diet of the newly arrived immigrant population included only small amounts of this staple. Only after 1959, with the economic liberalization carried out during the second stage of Franco's dictatorship, would the consumers of meats and other products with high-protein content also include the majority of Barcelona's working classes.

