Hostname: page-component-788cddb947-w95db Total loading time: 0 Render date: 2024-10-08T18:25:55.817Z Has data issue: false hasContentIssue false

Wall cooling effect on spectra and structures of thermodynamic variables in hypersonic turbulent boundary layers

Published online by Cambridge University Press:  07 November 2023

Dehao Xu*
Affiliation:
State Key Laboratory of Turbulence and Complex Systems, College of Engineering, Peking University, Beijing 100871, PR China
Jianchun Wang*
Affiliation:
Department of Mechanics and Aerospace Engineering, Southern University of Science and Technology, Shenzhen 518055, PR China
Shiyi Chen*
Affiliation:
State Key Laboratory of Turbulence and Complex Systems, College of Engineering, Peking University, Beijing 100871, PR China Department of Mechanics and Aerospace Engineering, Southern University of Science and Technology, Shenzhen 518055, PR China Eastern Institute for Advanced Study, Ningbo 315200, PR China
*
Email addresses for correspondence: [email protected], [email protected], [email protected]

Abstract

The wall cooling effect on the spectra and structures of thermodynamic variables are investigated in hypersonic turbulent boundary layers. The density and temperature can be divided into the acoustic and entropic modes based on the Kovasznay decomposition. The intensities of the pressure and the acoustic modes of density and temperature attain the maximum values near the wall, while those of the entropy and the entropic modes of density and temperature achieve their primary peaks near the edge of the boundary layer. In the near-wall region, the pressure and the acoustic modes of density and temperature are significantly enhanced when the wall is strongly cooled, which can be attributed to the appearance of the travelling-wave-like alternating positive and negative structures. Moreover, the intensities of the entropy and the entropic modes of density and temperature become stronger near the wall as the wall temperature decreases, due to the appearance of the streaky entropic structures (SES). The SES are mainly caused by the advection effect of the strong positive wall-normal gradient of the mean temperature associated with ejection and sweep events. It is also found that the profiles of the intensities of the entropy, density and temperature are similar to each other far from the wall, which is mainly due to the reason that the entropic modes are dominant in the fluctuating density and temperature in the far-wall region. The acoustic modes of density and temperature only have significant contributions in the near-wall region.

Type
JFM Papers
Copyright
© The Author(s), 2023. Published by Cambridge University Press

1. Introduction

The mechanisms of the hypersonic turbulent boundary layers are of great importance in the aerospace industry due to the direct application to hypersonic vehicles (Smits & Dussauge Reference Smits and Dussauge2006; Gatski & Bonnet Reference Gatski and Bonnet2009). It has been widely observed that the cold wall can significantly enhance the compressibility effect near the wall in hypersonic turbulent boundary layers (Duan, Beekman & Martin Reference Duan, Beekman and Martin2010; Zhang, Duan & Choudhari Reference Zhang, Duan and Choudhari2017, Reference Zhang, Duan and Choudhari2018; Xu et al. Reference Xu, Wang, Wan, Yu, Li and Chen2021a,Reference Xu, Wang, Wan, Yu, Li and Chenb, Reference Xu, Wang, Yu, Li and Chen2022b,Reference Xu, Wang, Yu, Li and Chenc; Huang, Duan & Choudhari Reference Huang, Duan and Choudhari2022; Xu, Wang & Chen Reference Xu, Wang and Chen2022a). Therefore, the systematic investigations of the properties of the physical quantities in the cooled wall hypersonic turbulent boundary layers are extraordinarily critical to better understanding of the underlying mechanisms and more accurate physics-based modelling for this type of flows.

Most of the previous investigations about the hypersonic turbulent boundary layers were concentrated on the flow statistics of velocities (Duan et al. Reference Duan, Beekman and Martin2010; Duan, Beekman & Martin Reference Duan, Beekman and Martin2011; Lagha et al. Reference Lagha, Kim, Eldredge and Zhong2011; Chu, Zhuang & Lu Reference Chu, Zhuang and Lu2013; Zhang et al. Reference Zhang, Duan and Choudhari2018; Xu et al. Reference Xu, Wang, Wan, Yu, Li and Chen2021a,Reference Xu, Wang, Wan, Yu, Li and Chenb, Reference Xu, Wang and Chen2022a,Reference Xu, Wang, Yu, Li and Chenb,Reference Xu, Wang, Yu, Li and Chenc; Huang et al. Reference Huang, Duan and Choudhari2022). Duan et al. (Reference Duan, Beekman and Martin2010) performed direct numerical simulation (DNS) of hypersonic turbulent boundary layers at Mach number five with isothermal boundary conditions. The ratio of the wall-to-edge temperature ranges from 1.0 to 5.4. The effect of wall cooling on Morkovin's scaling, Walz's equation, the strong Reynolds analogy (SRA), turbulent kinetic energy budgets, compressibility effect and near-wall coherent structures were systematically investigated. They found that many scaling relations for the non-adiabatic hypersonic turbulent boundary layers are similar to those found in adiabatic wall cases, and the compressibility effect is insignificantly enhanced by wall cooling. Furthermore, Zhang et al. (Reference Zhang, Duan and Choudhari2018) developed DNS databases of spatially evolving zero-pressure-gradient compressible turbulent boundary layers with nominal free stream Mach number ranging from 2.5 to 14 and wall-to-recovery temperature ranging from 0.18 to 1.0. They assessed the performance of compressibility transformations, including the Morkovin's scaling and SRA, as well as the mean velocity and temperature scaling. Recently, a series of researches aimed to reveal the effect of wall cooling on other complicated flow statistics beyond the well-observed compressibility transformations and the mean velocity and temperature scaling (Xu et al. Reference Xu, Wang, Wan, Yu, Li and Chen2021a,Reference Xu, Wang, Wan, Yu, Li and Chenb, Reference Xu, Wang and Chen2022a,Reference Xu, Wang, Yu, Li and Chenb,Reference Xu, Wang, Yu, Li and Chenc). Xu et al. (Reference Xu, Wang, Wan, Yu, Li and Chen2021a,Reference Xu, Wang, Wan, Yu, Li and Chenb) performed the DNS of hypersonic turbulent boundary layers at Mach numbers six and eight with wall-to-recovery temperature ranging from 0.15 to 0.8. They used the Helmholtz decomposition to divide the fluctuating velocities into the solenoidal and dilatational components. They investigated the interactions among mean and fluctuating fields of kinetic and internal energy (Xu et al. Reference Xu, Wang, Wan, Yu, Li and Chen2021a) as well as the kinetic energy transfer across different scales (Xu et al. Reference Xu, Wang, Wan, Yu, Li and Chen2021b). Furthermore, the flow topology and its effect on the kinetic energy transfer across different scales were also systematically investigated in Xu et al. (Reference Xu, Wang, Yu, Li and Chen2022b,Reference Xu, Wang, Yu, Li and Chenc). In order to explain the possible reasons of the overshoot phenomena of the wall skin friction and wall heat transfer in transitional hypersonic boundary layers, Xu et al. (Reference Xu, Wang and Chen2022a) applied the decomposition method on the wall skin friction and heat transfer coefficients based on two-fold repeated integration. Moreover, the effect of the wall cooling on the wall skin friction and heat transfer decomposition in hypersonic turbulent boundary layers was also discussed.

However, most of the previous studies were focused on the flow statistics and structures of velocities, while the mechanisms of the thermodynamic statistics in hypersonic turbulent boundary layers were less studied (Duan, Choudhari & Zhang Reference Duan, Choudhari and Zhang2016; Zhang et al. Reference Zhang, Duan and Choudhari2017; Ritos, Drikakis & Kokkinakis Reference Ritos, Drikakis and Kokkinakis2019; Cogo et al. Reference Cogo, Salvadore, Picano and Bernardini2022; Zhang et al. Reference Zhang, Wan, Liu, Sun and Lu2022). Recently, Zhang et al. (Reference Zhang, Wan, Liu, Sun and Lu2022) investigated the wall cooling effect on pressure fluctuations in compressible turbulent boundary layers. They explored the generating mechanisms of pressure fluctuations by dividing the pressure fluctuations into five components, among which the rapid pressure, slow pressure and compressible pressure are dominant. Furthermore, Cogo et al. (Reference Cogo, Salvadore, Picano and Bernardini2022) investigated the high-Reynolds-number effect in hypersonic turbulent boundary layers. They studied the structural properties of the uniform streamwise momentum and uniform temperature regions in the high-speed regime. Furthermore, they also evaluated the accuracy of different compressibility transformations and temperature–velocity relations at moderate-to-high Reynolds number. A revised scaling for the characteristic length scales of the spanwise spectra of the fluctuating velocity and temperature at various wall distances was proposed based on the local mean shear. Nevertheless, the wall cooling effect on the multiscale properties and the spatial structures of the pressure, density, temperature and entropy in hypersonic turbulent boundary layers needs more systematic investigation, for the sake of a better understanding of the underlying mechanisms and more accurate physics-based modelling of the thermodynamic variables.

The goal of this study is to systematically explore the wall cooling effect on the spectra and structures of the thermodynamic variables in hypersonic turbulent boundary layers by DNS. The fluctuating density and temperature are divided into the acoustic and entropic modes based on the Kovasznay decomposition (Kovasznay Reference Kovasznay1953; Chassaing et al. Reference Chassaing, Antoniz, Anselmet, Joly and Sarkar2002; Gauthier Reference Gauthier2017; Wang et al. Reference Wang, Wan, Chen, Xie, Wang and Chen2019). The streamwise and spanwise spectra of the thermodynamic variables are systematically studied to figure out the multiscale properties and spatial structures of thermodynamic variables. The streamwise and spanwise spectra of the fluctuating streamwise velocity are also investigated aiming for comparing with those of the thermodynamic variables. It is found that the wall cooling effect on the spectra and structures of the thermodynamic variables are much larger than those of the fluctuating streamwise velocity.

The remainder of the paper is organised as follows. The governing equations and simulation parameters are outlined in § 2. The turbulent intensities of the streamwise velocity and thermodynamic variables are shown in § 3. Section 4 presents the streamwise and spanwise spectra of the streamwise velocity and thermodynamic variables. Some discussions are given in § 5. Finally, summary and conclusions are given in § 6.

2. Governing equations and simulation parameters

The compressible Navier–Stokes equations can be non-dimensionalised by a set of reference scales: the reference length $L_{\infty }$; free stream density $\rho _{\infty }$; velocity $U_{\infty }$; temperature $T_{\infty }$; pressure $p_{\infty }= \rho _{\infty }U_{\infty }^{2}$; energy per unit volume $\rho _{\infty }U_{\infty }^{2}$; viscosity $\mu _{\infty }$; and thermal conductivity $\kappa _{\infty }$. Therefore, there are three non-dimensional governing parameters, namely the Reynolds number $Re= \rho _{\infty }U_{\infty }L_{\infty }/\mu _{\infty }$, Mach number $M= U_{\infty }/c_{\infty }$ and Prandtl number $Pr= \mu _{\infty } C_{p}/\kappa _{\infty }$. The ratio of specific heat at constant pressure $C_{p}$ to that at constant volume $C_{v}$ is defined as $\gamma = C_{p}/C_{v}=1.4$. The parameter $\alpha$ is defined as $\alpha = PrRe ( \gamma -1 )M^{2}$, where $Pr=0.7$.

The following compressible dimensionless Navier–Stokes equations in the conservative form are solved numerically (Liang & Li Reference Liang and Li2015; Xu et al. Reference Xu, Wang, Wan, Yu, Li and Chen2021a,Reference Xu, Wang, Wan, Yu, Li and Chenb, Reference Xu, Wang and Chen2022a,Reference Xu, Wang, Yu, Li and Chenb,Reference Xu, Wang, Yu, Li and Chenc):

(2.1)\begin{gather} \frac{\partial \rho }{\partial t}+\frac{\partial \left ( \rho u_{j} \right )}{\partial x_{j}}=0, \end{gather}
(2.2)\begin{gather}\frac{\partial \left ( \rho u_{i} \right )}{\partial t}+\frac{\partial \left [ \rho u_{i}u_{j}+p\delta_{ij} \right ]}{\partial x_{j}}=\frac{1}{Re}\frac{\partial \sigma_{ij}}{\partial x_{j}}, \end{gather}
(2.3)\begin{gather}\frac{\partial E}{\partial t}+\frac{\partial \left [ \left ( E+p \right )u_{j} \right ]}{\partial x_{j}}=\frac{1}{\alpha }\frac{\partial }{\partial x_{j}}\left ( \kappa \frac{\partial T}{\partial x_{j}} \right )+\frac{1}{Re}\frac{\partial \left ( \sigma_{ij}u_{i} \right )}{\partial x_{j}}, \end{gather}
(2.4)\begin{gather}p=\rho T/\left ( \gamma M^{2} \right ), \end{gather}

where $\rho$, $u_{i}$, $T$ and $p$ are the density, velocity component, temperature and pressure, respectively. The viscous stress $\sigma _{ij}$ is defined as

(2.5)\begin{equation} \sigma_{ij}=\mu \left ( \frac{\partial u_{i}}{\partial x_{j}}+\frac{\partial u_{j}}{\partial x_{i}} \right )-\frac{2}{3}\mu \theta \delta_{ij}, \end{equation}

where $\theta = \partial u_{k}/\partial x_{k}$ is the velocity divergence, and the viscosity $\mu$ is determined by Sutherland's law. The total energy per unit volume $E$ is

(2.6)\begin{equation} E=\frac{p}{\gamma -1}+\frac{1}{2}\rho \left ( u_{j}u_{j} \right ). \end{equation}

The convection terms of the compressible governing equations are discretised by a hybrid scheme. In order to judge on the local smoothness of the numerical solution, the modified Jameson sensor (Jameson, Schmidt & Turkel Reference Jameson, Schmidt and Turkel1981) is used in the hybrid scheme, which can be given by (Dang et al. Reference Dang, Liu, Guo, Duan and Li2022)

(2.7)\begin{gather} \left.\begin{gathered} \phi_{i}=\frac{\left | -p_{i-1}+2p_{i}-p_{i+1} \right |}{p_{i-1}+2p_{i}+p_{i+1}}, \\ \phi_{j}=\frac{\left | -p_{j-1}+2p_{j}-p_{j+1} \right |}{p_{j-1}+2p_{j}+p_{j+1}}, \\ \phi_{k}=\frac{\left | -p_{k-1}+2p_{k}-p_{k+1} \right |}{p_{k-1}+2p_{k}+p_{k+1}}, \end{gathered}\right\} \end{gather}
(2.8)\begin{gather} \varTheta =\phi_{i}+\phi_{j}+\phi_{k}. \end{gather}

The threshold $\varTheta _{1}$ is set to 0.02 (Dang et al. Reference Dang, Liu, Guo, Duan and Li2022). When $\varTheta \leq \varTheta _{1}$, the eighth-order central difference scheme is used; when $\varTheta > \varTheta _{1}$, the seventh-order weighted essentially non-oscillatory scheme (Balsara & Shu Reference Balsara and Shu2000) is applied. Furthermore, the viscous terms are approximated by an eighth-order central difference scheme. A third-order total variation diminishing type of the Runge–Kutta method is utilised for time advancing (Shu & Osher Reference Shu and Osher1988). The compressible governing equations are numerically solved by the OPENCFD code, which has been widely validated in compressible transitional and turbulent wall-bounded flows (Liang & Li Reference Liang and Li2015; Xu et al. Reference Xu, Wang, Wan, Yu, Li and Chen2021a,Reference Xu, Wang, Wan, Yu, Li and Chenb, Reference Xu, Wang and Chen2022a,Reference Xu, Wang, Yu, Li and Chenb,Reference Xu, Wang, Yu, Li and Chenc; Dang et al. Reference Dang, Liu, Guo, Duan and Li2022). The schematic of the hypersonic transitional and turbulent boundary layers is shown in figure 1. The spatially evolving hypersonic transitional and turbulent boundary layer is numerically simulated under the inflow and outflow boundary conditions, a wall boundary condition, an upper far-field boundary condition and a periodic boundary condition in the spanwise direction. A time-independent laminar compressible boundary-layer similarity solution is applied at the inflow boundary. The laminar flow is disturbed by the wall blowing and suction region, and then transitioned to the fully developed turbulent state. Moreover, in order to inhibit the reflection of disturbance due to the numerical treatment of the outflow boundary condition, a progressively coarse grid is implemented in the streamwise direction near the outflow boundary condition. The non-slip and isothermal boundary conditions are applied for the wall boundary, and the non-reflecting boundary condition is imposed for the upper boundary. More detailed descriptions the reader may refer to Pirozzoli, Grasso & Gatski (Reference Pirozzoli, Grasso and Gatski2004), Liang & Li (Reference Liang and Li2015) and Xu et al. (Reference Xu, Wang, Wan, Yu, Li and Chen2021a,Reference Xu, Wang, Wan, Yu, Li and Chenb, Reference Xu, Wang and Chen2022a,Reference Xu, Wang, Yu, Li and Chenb,Reference Xu, Wang, Yu, Li and Chenc).

Figure 1. The schematic of the hypersonic transitional and turbulent boundary layers.

In this study, $\bar {f}$ denotes the Reynolds average (spanwise and time average) of flow field $f$, and the fluctuating component of the Reynolds average is ${f}'=f-\bar {f}$. Furthermore, $\tilde {f}=\overline {\rho f}/\bar {\rho }$ represents the Favre average of $f$, and the fluctuating component is ${f}''=f-\tilde {f}$.

The DNS of three hypersonic transitional and turbulent boundary layers at Mach number eight with different wall temperatures are performed and the fundamental parameters of the database are listed in table 1. The free stream temperature $T_{\infty }$ is prescribed to be $T_{\infty }=169.44\ \textrm {K}$. Temperature $T_{w}$ is the wall temperature, and the recovery temperature $T_{r}$ can be defined as $T_{r}=T_{\infty } ( 1+r ( ( \gamma -1 )/2 )M_{\infty }^{2} )$ with recovery factor $r=0.9$ (Duan et al. Reference Duan, Beekman and Martin2010; Xu et al. Reference Xu, Wang and Chen2022a). The coordinates along the streamwise, wall-normal and spanwise directions are represented by $x$, $y$ and $z$, respectively. The computational domains $L_{x}$, $L_{y}$ and $L_{z}$ are non-dimensionalised by the inflow boundary layer thickness $\delta _{in}$, and the symbols $N_{x}$, $N_{y}$ and $N_{z}$ represent the grid resolutions along the streamwise, wall-normal and spanwise directions, respectively.

Table 1. Summary of computational parameters for the three DNS database at Mach number eight with different wall temperatures.

It should be pointed out that the non-ideal gas effect, as well as the non-equilibrium and radiative effects are neglected in the present DNS databases. The reasons are as follows. It is noted that the free stream temperature $T_{\infty }$ is prescribed to be $T_{\infty }=169.44\ \textrm {K}$ in the present study. The largest temperature in the highest wall temperature case M8T08 is approximately 1700 K. In the previous studies, the maximum temperatures of cases ‘M7’, ‘M8’ and ‘M12’ in Duan et al. (Reference Duan, Beekman and Martin2011) and $M_{\infty }=7.5$, 10, 15 and 20 in Lagha et al. (Reference Lagha, Kim, Eldredge and Zhong2011) are much larger than that of M8T08, and the non-ideal gas effect, as well as the non-equilibrium and radiative effects were also neglected in their study. Therefore, the neglect of the non-ideal gas, non-equilibrium and heat radiative effects is a reasonable simplification for the present study of the hypersonic turbulent boundary layers. The influence of the non-ideal gas, non-equilibrium and radiative effects in the hypersonic turbulent boundary layers will be considered in the future.

Three sets of data in a small streamwise window of $[ x_{a}-0.5\delta,x_{a}+0.5\delta ]$ extracted from the fully developed region of the above three transitional and hypersonic turbulent boundary layers are used for following statistical analysis, where $x_{a}$ is the reference streamwise location selected for statistical analysis, and $\delta$ is the boundary layer thickness at the streamwise location $x_{a}$. It is noted that a similar technique has been used by the previous studies of Pirozzoli & Bernardini (Reference Pirozzoli and Bernardini2011), Zhang et al. (Reference Zhang, Duan and Choudhari2018) and Huang et al. (Reference Huang, Duan and Choudhari2022), and the width of the streamwise window in this study is consistent with that of Huang et al. (Reference Huang, Duan and Choudhari2022). The fundamental parameters of the three sets of data are listed in table 2. The friction Reynolds number $Re_{\tau }$ is defined as $Re_{\tau }=\bar {\rho }_{w}u_{\tau }\delta /\bar {\mu }_{w}$, where $\bar {\rho }_{w}$ and $\bar {\mu }_{w}$ are the mean wall density and wall viscosity, respectively, and $u_{\tau }=\sqrt {\tau _{w}/\bar {\rho }_{w}}$ and $\tau _{w}= (\mu \partial \bar {u}/\partial y )_{y=0}$ are the friction velocity and the wall shear stress, respectively. Furthermore, $\Delta x^{+}=\Delta x /\delta _{\nu }$, $\Delta y_{w}^{+}=\Delta y_{w} /\delta _{\nu }$, $\Delta y_{e}^{+}=\Delta y_{e} /\delta _{\nu }$ and $\Delta z^{+}=\Delta z /\delta _{\nu }$ are the normalised spacing of the streamwise direction, the first point off the wall, the wall-normal grid at the edge of the boundary layer and the spanwise direction, respectively, where $\delta _{\nu }=\bar {\mu }_{w}/(\bar {\rho }_{w}u_{\tau })$ is the viscous length scale. The semilocal length scale is defined as $\delta _{\nu }^{*}=\bar {\mu }/ ( \bar {\rho }u_{\tau }^{*} )$, where $u_{\tau }^{*}=\sqrt {\tau _{w}/\bar {\rho }}$ (Huang, Coleman & Bradshaw Reference Huang, Coleman and Bradshaw1995). The semilocal Reynolds number can be defined as $Re_{\tau }^{*}=\delta / (\delta _{\nu }^{*} )_{e}$. It is noted that the grid resolutions $\Delta x^{+}$, $\Delta y^{+}_{w}$, $\Delta y^{+}_{e}$ and $\Delta z^{+}$ in three cases are comparable and even smaller than many previous investigations including Duan et al. (Reference Duan, Beekman and Martin2010), Pirozzoli & Bernardini (Reference Pirozzoli and Bernardini2013), Zhang et al. (Reference Zhang, Duan and Choudhari2018) and Huang et al. (Reference Huang, Duan and Choudhari2022), indicating that the grid resolutions of the present DNS study are fine enough. Furthermore, the accuracy of the DNS cases in this study are validated via comparisons with the available DNS database in Zhang et al. (Reference Zhang, Duan and Choudhari2018) in Appendix A.

Table 2. The fundamental parameters of the three sets of data.

The mean density and temperature profiles along the wall-normal direction are shown in figure 2. Here the ‘turning points’ marked by the green circles represent the minimum values of the mean density in figures 2(a), 2(b) and 2(c), and the maximum values of the mean temperature in figures 2(d), 2(e) and 2(f). The wall unit scaling is defined as $y^{+}=y/\delta _{\nu }$, and the semilocal scaling is defined as $y^{*}=y/\delta _{\nu }^{*}$. It is noted that the wall unit scaling $y^{+}$ and the semilocal scaling $y^{*}$ are the inner scaling in order to reveal the scaling relation in the near-wall region, while the outer scaling $y/\delta$ shows the statistical behaviour in the far-wall region.

Figure 2. (ac) The mean density profile along the wall-normal direction plotted against (a) wall unit scaling ($\,y^{+}$), (b) semilocal scaling ($\,y^{*}$) and (c) outer scaling ($\,y/\delta$). (df) The mean temperature profile along the wall-normal direction plotted against (d) wall unit scaling ($\,y^{+}$), (e) semilocal scaling ($\,y^{*}$) and (f) outer scaling ($\,y/\delta$). Here the ‘turning points’ marked by the green circles represent the minimum values of the mean density in (ac), and the maximum values of the mean temperature in (df).

The mean density and temperature are significantly influenced by the wall temperature. When the wall temperature is close to the recovery temperature $T_{r}$ (‘M8T08’ case), the mean temperature is nearly constant near the wall, and then decreases drastically when $y^{+}>4$. However, in ‘M8T04’ and ‘M8T015’, the mean temperature initially increases near the wall. After reaching the maximum value at the turning point, the mean temperature then decreases as $y$ increases. It is also found that as the wall temperature decreases, the positive values of the wall-normal gradient of the mean temperature become larger below the wall-normal location of the turning point, while the negative values of the wall-normal gradient of the mean temperature become smaller above it. Furthermore, when the wall temperature becomes cooler, the maximum value of the mean temperature decreases, while the wall-normal location $y^{+}$ of the turning point increases under the wall unit scaling. The semilocal scaling $y^{*}$ can significantly decrease the discrepancy of the wall-normal locations of turning points in different wall temperature cases. It should be noted that the mean density profiles reveal the opposite variation trends compared with the mean temperature profiles.

In order to investigate the effect of wall temperature on the compressibility effect, the turbulent Mach number $M_{t}=\sqrt {\overline {{u}''_{i}{u}''_{i}}}/\bar {c}$ and the root mean square (r.m.s.) values of the local Mach number based on the fluctuating velocities ${M}'_{rms}$ are evaluated in figure 3. Here the local Mach number based on the fluctuating velocities $M'$ is defined as ${M}'=\sqrt {{u}'_{i}{u}'_{i}}/c$, and $c$ represents the local sound speed. As the wall temperature decreases, the peak values of $M_{t}$ and ${M}'_{rms}$ increase, indicating that the cooling wall can enhance the compressibility effect, which is consistent with many previous studies including Zhang et al. (Reference Zhang, Duan and Choudhari2018), Xu et al. (Reference Xu, Wang, Wan, Yu, Li and Chen2021b) and Zhang et al. (Reference Zhang, Wan, Liu, Sun and Lu2022). Moreover, it is shown in figures 3(a) and 3(d) that the wall-normal locations $y^{+}$ of the peak values of $M_{t}$ and ${M}'_{rms}$ increase under the wall unit scaling as the wall temperature decreases, while it is found in figures 3(b) and 3(e) that the $M_{t}$ and ${M}'_{rms}$ profiles against the semilocal scaling attain their peaks at almost the same values of $y^{*}$ in different wall temperature cases.

Figure 3. (ac) The turbulent Mach number $M_{t}$ along the wall-normal direction plotted against (a) wall unit scaling ($\,y^{+}$), (b) semilocal scaling ($\,y^{*}$) and (c) outer scaling ($\,y/\delta$). The vertical dashed line represents $y^{*}=19$ in (b). (df) The r.m.s. values of the local Mach number ${M}'_{rms}$ along the wall-normal direction plotted against (d) wall unit scaling ($\,y^{+}$), (e) semilocal scaling ($\,y^{*}$) and (f) outer scaling ($\,y/\delta$). The vertical dashed line represents $y^{*}=15$ in (e).

3. The turbulent intensities of the streamwise velocity and the thermodynamic variables

The normalised turbulent intensity of the streamwise velocity $u_{rms}^{\prime \prime }/u_{\tau }^{*}$ along the wall-normal direction is shown in figure 4. It is found that $u_{rms}^{\prime \prime }/u_{\tau }^{*}$ attains its peak in the buffer layer (approximately $\,y^{*}\approx 18$). Furthermore, the peak values of $u_{rms}^{\prime \prime }/u_{\tau }^{*}$ are similar in the ‘M8T04’ and ‘M8T08’ cases. However, the peak value is slightly larger in ‘M8T015’, which can be ascribed to the strongly colder wall temperature and slightly larger friction Reynolds number $Re_{\tau }$.

Figure 4. The normalised turbulent intensity of the streamwise velocity $u_{rms}^{\prime \prime }/u_{\tau }^{*}$ plotted against (a) semilocal scaling ($\,y^{*}$) and (b) outer scaling ($\,y/\delta$). The vertical dashed line represents $y^{*}=18$ in (a).

The normalised turbulent intensity of the pressure $p_{rms}^{\prime }/\bar {p}$ along the wall-normal direction is plotted in figure 5. It is found that the $p_{rms}^{\prime }/\bar {p}$ profile in the nearly adiabatic wall case (the ‘M8T08’ case) reaches the maximum value at $y^{*} \approx 60$, and then decreases rapidly in the boundary layer to a flat platform. As the wall temperature decreases, the intensity of pressure $p_{rms}^{\prime }/\bar {p}$ significantly increases among the whole boundary layer. The profiles of $p_{rms}^{\prime }/\bar {p}$ in ‘M8T04’ and ‘M8T015’ have secondary peaks at $y^{*} \approx 60$, which are consistent with the wall-normal location of the primary peak in ‘M8T08’. A special phenomenon is observed that the intensities of $p_{rms}^{\prime }/\bar {p}$ are significantly enhanced near the wall when the wall is strongly cooled, which further result in the fact that the $p_{rms}^{\prime }/\bar {p}$ profiles attain their primary peaks at the wall in ‘M8T04’ and ‘M8T015’. The significant enhancement of $p_{rms}^{\prime }/\bar {p}$ near the wall can be ascribed to the appearance of a special acoustic structure (‘the travelling-wave-like alternating positive and negative structures’ (TAPNS)) in the near-wall region, which will be specifically discussed in § 4.

Figure 5. The normalised turbulent intensity of the pressure $p_{rms}^{\prime }/\bar {p}$ plotted against (a) semilocal scaling ($\,y^{*}$) and (b) outer scaling ($\,y/\delta$). The vertical dashed lines represent $y^{*}=2, 5, 60$ in (a).

The dimensionless entropy per unit mass $s$ can be defined as $s=C_{v}\,{\rm log} ( T/\rho ^{\gamma -1} )$ (Gerolymos & Vallet Reference Gerolymos and Vallet2014; Wang et al. Reference Wang, Wan, Chen, Xie, Wang and Chen2019). The normalised turbulent intensities $s_{rms}^{\prime }\gamma M^{2}$, $\rho _{rms}^{\prime }/\bar {\rho }$ and $T_{rms}^{\prime }/\bar {T}$ along wall-normal direction are shown in figure 6. It is found in figures 6(a) and 6(d) that the normalised turbulent intensity of the entropy $s_{rms}^{\prime }\gamma M^{2}$ attains its primary peak near the edge of the boundary layer ($\,y/\delta \approx 0.7$). Furthermore, a secondary peak is observed at $y^{*} \approx 50$ in ‘M8T08’, and this local secondary peak gradually disappears as the wall temperature decreases. It is also found that as the wall temperature decreases, the intensity $s_{rms}^{\prime }\gamma M^{2}$ decreases in the region between $y^{*} > 10$ and $y/\delta < 0.7$, while $s_{rms}^{\prime }\gamma M^{2}$ is significantly enhanced in the near-wall region ($\,y^{*} < 10$). An interesting phenomenon is found that a strong local secondary peak is observed at $y^{*} \approx 5$ in ‘M8T015’. It is noted that the local secondary peaks also appear in the near-wall region in the ‘M6Tw025’ and ‘M14Tw018’cases in Zhang et al. (Reference Zhang, Duan and Choudhari2018). However, to the best of our knowledge, previous studies have not provided a physical explanation for the strong local secondary peak of $s_{rms}^{\prime }\gamma M^{2}$ in the near-wall region when the wall is strongly cooled. In § 4, it is found that the above phenomenon can be attributed to the appearance of a special entropic structure (‘the streaky entropic structures’ (SES)) near the wall.

Figure 6. (a,d) The normalised turbulent intensity of the entropy $s_{rms}^{\prime }\gamma M^{2}$ along the wall-normal direction against (a) semilocal scaling ($\,y^{*}$) and (d) outer scaling ($\,y/\delta$). The vertical dashed lines represent $y^{*}=2, 5, 50$ in (a) and $y/\delta =0.7$ in (d), respectively. (b,e) The normalised turbulent intensity of the density $\rho _{rms}^{\prime }/\bar {\rho }$ along the wall-normal direction against (b) semilocal scaling ($\,y^{*}$) and (e) outer scaling ($\,y/\delta$). The vertical dashed lines represent $y^{*}=2$, 5, 40 in (b) and $y/\delta =0.6$ in (e), respectively. (c,f) The normalised turbulent intensity of the temperature $T_{rms}^{\prime }/\bar {T}$ along the wall-normal direction against (c) semilocal scaling ($\,y^{*}$) and (f) outer scaling ($\,y/\delta$). The vertical dashed lines represent $y^{*}=2$, 5, 50 in (c) and $y/\delta =0.8$ in (f), respectively.

It is also found that the intensities $\rho _{rms}^{\prime }/\bar {\rho }$ and $T_{rms}^{\prime }/\bar {T}$ have similar behaviours with $s_{rms}^{\prime }\gamma M^{2}$ among most regions of the boundary layer, except for the much larger values of $\rho _{rms}^{\prime }/\bar {\rho }$ in the vicinity of the wall ($\,y^{*} < 5$). The similarity among the intensities $\rho _{rms}^{\prime }/\bar {\rho }$, $T_{rms}^{\prime }/\bar {T}$ and $s_{rms}^{\prime }\gamma M^{2}$ can be explained based on the Kovasznay decomposition (Kovasznay Reference Kovasznay1953; Chassaing et al. Reference Chassaing, Antoniz, Anselmet, Joly and Sarkar2002; Gauthier Reference Gauthier2017; Wang et al. Reference Wang, Wan, Chen, Xie, Wang and Chen2019). It is noted that the Kovasznay decomposition can decompose the thermodynamic variables into the acoustic modes and the entropic modes (Kovasznay Reference Kovasznay1953; Chassaing et al. Reference Chassaing, Antoniz, Anselmet, Joly and Sarkar2002; Gauthier Reference Gauthier2017; Wang et al. Reference Wang, Wan, Chen, Xie, Wang and Chen2019).

In compressible turbulent flow, the acoustic modes of the thermodynamic variables can be defined as (Chassaing et al. Reference Chassaing, Antoniz, Anselmet, Joly and Sarkar2002; Gauthier Reference Gauthier2017; Wang et al. Reference Wang, Wan, Chen, Xie, Wang and Chen2019)

(3.1)\begin{gather} p'_{I}=p-\bar{p}, \end{gather}
(3.2)\begin{gather}{\rho }'_{I}=\frac{\bar{\rho }p'_{I}}{\gamma \bar{p}}, \end{gather}
(3.3)\begin{gather}{T}'_{I}=\frac{\left ( \gamma -1 \right )\bar{T}p'_{I}}{\gamma \bar{p}}; \end{gather}

and the entropic modes can be given by (Chassaing et al. Reference Chassaing, Antoniz, Anselmet, Joly and Sarkar2002; Gauthier Reference Gauthier2017; Wang et al. Reference Wang, Wan, Chen, Xie, Wang and Chen2019)

(3.4)\begin{gather} p'_{E}=0, \end{gather}
(3.5)\begin{gather}{\rho }'_{E}=\rho -\bar{\rho }-{\rho }'_{I}, \end{gather}
(3.6)\begin{gather}{T}'_{E}=T -\bar{T}-{T}'_{I}. \end{gather}

Therefore, the acoustic mode of the pressure $p'_{I}$ is consistent with the fluctuating pressure $p^{\prime }$, and the fluctuating density and temperature can be divided into the acoustic modes and the entropic modes, respectively: ${\rho }'={\rho }'_{I}+{\rho }'_{E}$; ${T}'={T}'_{I}+{T}'_{E}$. It is noted that the correlation coefficients between variables ${\varphi }'$ and ${\psi }'$ can be defined as

(3.7)\begin{equation} R\left ({\varphi }',{\psi }' \right )=\frac{\overline{{\varphi }'{\psi }'}}{\sqrt{\overline{{\varphi }^{\prime 2}}}\sqrt{\overline{{\psi }^{\prime 2}}}}. \end{equation}

The correlation coefficient $R ({\varphi }',{\psi }' )=1$ indicates that the variables ${\varphi }'$ and ${\psi }'$ are positively linearly correlated with each other; while $R ({\varphi }',{\psi }' )=-1$ suggests that the variables ${\varphi }'$ and ${\psi }'$ are negatively linearly correlated with each other.

The correlation coefficients $R ( \rho _{I} ^{\prime },T_{I}^{\prime } )$, $R ( \rho _{I} ^{\prime },p^{\prime } )$, $R ( \rho _{E} ^{\prime },T_{E}^{\prime } )$ and $R ( \rho _{E} ^{\prime },s^{\prime } )$ along the wall-normal direction are shown in figure 7. It is found that $R ( \rho _{I} ^{\prime },T_{I}^{\prime } )=1$ and $R ( \rho _{I} ^{\prime },p^{\prime } )=1$ along the wall-normal direction, confirming that $\rho _{I} ^{\prime }$, $T_{I}^{\prime }$ and $p^{\prime }$ are positively linearly correlated with each other. Furthermore, $R ( \rho _{E} ^{\prime },T_{E}^{\prime } ) \approx -1$ and $R ( \rho _{E} ^{\prime },s^{\prime } )\approx -1$, suggesting that $\rho _{E} ^{\prime }$ is almost negatively linearly correlated with $T_{E}^{\prime }$ and $s^{\prime }$, respectively. Accordingly, the acoustic modes of density and temperature $\rho _{I} ^{\prime }$ and $T_{I}^{\prime }$ are linearly correlated with the fluctuating pressure $p^{\prime }$, and the entropic modes of density and temperature $\rho _{E} ^{\prime }$ and $T_{E}^{\prime }$ are almost linearly correlated with the fluctuating entropy $s^{\prime }$.

Figure 7. The correlation coefficients (a) $R ( \rho _{I} ^{\prime },T_{I}^{\prime } )$, (b) $R ( \rho _{I} ^{\prime },p^{\prime } )$, (c) $R ( \rho _{E} ^{\prime },T_{E}^{\prime } )$ and (d) $R ( \rho _{E} ^{\prime },s^{\prime } )$ along the wall-normal direction plotted against semilocal scaling ($\,y^{*}$).

The normalised turbulent intensities of the acoustic and entropic modes of density and temperature along the wall-normal direction are shown in figure 8. It is found that the profiles of the intensities of the acoustic modes of density and temperature (figure 8a,c) are similar to that of the fluctuating pressure (figure 5a), and the intensities of the entropic modes of density and temperature (figure 8b,d) also have similar behaviours with that of the fluctuating entropy (figure 6a).

Figure 8. (a,b) The normalised turbulent intensity of (a) the acoustic mode of density $\rho _{I,rms}^{\prime }/\bar {\rho }$ and (b) the entropic mode of density $\rho _{E,rms}^{\prime }/\bar {\rho }$ along the wall-normal direction. (c,d) The normalised turbulent intensity of (c) the acoustic mode of temperature $T_{I,rms}^{\prime }/\bar {T}$ and (d) the entropic mode of temperature $T_{E,rms}^{\prime }/\bar {T}$ along the wall-normal direction.

The relative contributions $\rho _{E,rms}^{\prime }/ (\rho _{E,rms}^{\prime }+ \rho _{I,rms}^{\prime } )$ and $T_{E,rms}^{\prime }/ (T_{E,rms}^{\prime }+T_{I,rms}^{\prime } )$ along the wall-normal direction are shown in figure 9. It is noted that if the relative contributions $\rho _{E,rms}^{\prime }/ (\rho _{E,rms}^{\prime }+ \rho _{I,rms}^{\prime } )$ and $T_{E,rms}^{\prime }/ (T_{E,rms}^{\prime }+T_{I,rms}^{\prime } )$ are lower than 0.5, the acoustic modes of density and temperature are predominant over their entropic modes; on the contrary, if the relative contributions are larger than 0.5, the entropic modes are dominant. It is found that the relative contributions $\rho _{E,rms}^{\prime }/ (\rho _{E,rms}^{\prime }+ \rho _{I,rms}^{\prime } )$ and $T_{E,rms}^{\prime }/ (T_{E,rms}^{\prime }+T_{I,rms}^{\prime } )$ increase as the wall-normal location increases. Furthermore, the relative contribution $\rho _{E,rms}^{\prime }/ (\rho _{E,rms}^{\prime }+ \rho _{I,rms}^{\prime } )$ is, in total, smaller than $T_{E,rms}^{\prime }/ (T_{E,rms}^{\prime }+T_{I,rms}^{\prime } )$ among the boundary layer, suggesting that the entropic mode has a much larger contribution in fluctuating temperature than that in fluctuating density. In the near-wall region, the fluctuating density is mainly dominated by its acoustic mode, and the acoustic mode of temperature is slightly predominant over the entropic mode of temperature. However, in the far-wall region, the fluctuating density and temperature are mainly dominated by their entropic modes, which further lead to the similarity between the profiles of $s_{rms}^{\prime }\gamma M^{2}$, $\rho _{rms}^{\prime }/\bar {\rho }$ and $T_{rms}^{\prime }/\bar {T}$ shown in figure 6.

Figure 9. The relative contributions (a) $\rho _{E,rms}^{\prime }/ (\rho _{E,rms}^{\prime }+ \rho _{I,rms}^{\prime } )$ and (b) $T_{E,rms}^{\prime }/ (T_{E,rms}^{\prime }+T_{I,rms}^{\prime } )$ along the wall-normal direction. The vertical dashed lines represent $y^{*}=2, 5$ in (a,b).

It is also found that the wall temperature has a significant influence on the relative contributions. In the near-wall region, as the wall temperature decreases, the acoustic modes and the entropic modes of density and temperature are all enhanced, but the amounts of the growth of the entropic modes are slightly larger than those of the acoustic modes, which result in the increase of the relative contributions $\rho _{E,rms}^{\prime }/ (\rho _{E,rms}^{\prime }+ \rho _{I,rms}^{\prime } )$ and $T_{E,rms}^{\prime }/ (T_{E,rms}^{\prime }+T_{I,rms}^{\prime } )$ with colder wall temperature. In the far-wall region, when the wall temperature becomes colder, the acoustic modes are enhanced while the entropic modes are reduced, which lead to the decrease of the relative contributions of the entropic modes in the strongly cooled wall case. Therefore, as the wall temperature decreases, the increase of $\rho _{rms}^{\prime }/\bar {\rho }$ and $T_{rms}^{\prime }/\bar {T}$ near the wall is mainly due to the contributions of both the acoustic and entropic modes, while the decrease of $\rho _{rms}^{\prime }/\bar {\rho }$ and $T_{rms}^{\prime }/\bar {T}$ far from the wall can be ascribed to the major contributions of the entropic modes.

It has been noted previously in figure 6(b) that $\rho _{rms}^{\prime }/\bar {\rho }$ has much larger values than those of $s_{rms}^{\prime }\gamma M^{2}$ and $T_{rms}^{\prime }/\bar {T}$ in the vicinity of the wall ($\,y^{*} < 5$), especially in ‘M8T04’ and ‘M8T015’. This can be ascribed to the dominant contribution of the acoustic mode to the fluctuating density near the wall (figure 9a), and the fact that the acoustic mode of density attains the primary peak at the wall in ‘M8T04’ and ‘M8T015’ (figure 8a). Moreover, it is also found in figure 6(e) that the primary peak value of $\rho _{rms}^{\prime }/\bar {\rho }$ at $y/\delta \approx 0.6$ in ‘M8T015’ is slightly larger than that in ‘M8T04’, which is opposite to the behaviours of $s_{rms}^{\prime }\gamma M^{2}$ and $T_{rms}^{\prime }/\bar {T}$. This can be attributed to the facts that the intensity of the acoustic mode of density in ‘M8T015’ is much larger than that in ‘M8T04’ (figure 8a), and the acoustic mode of density in ‘M8T015’ has a much larger contribution to fluctuating density than that in ‘M8T04’ near the edge of the boundary layer (figure 9a).

4. The streamwise and spanwise spectra of the streamwise velocity and thermodynamic variables

In order to quantitatively characterise the characteristic length scales of the energetic structures of the streamwise velocity and thermodynamic variables, the premultiplied streamwise and spanwise spectra are further investigated. It is noted that $k_{x}$ and $k_{z}$ are the wavenumbers in the streamwise and spanwise directions, respectively. Here ${\lambda }_{x}$ and ${\lambda }_{z}$ are the corresponding wavelengths in the streamwise and spanwise directions, respectively. Furthermore, ${\lambda }_{x}^{+}={\lambda }_{x}/\delta _{\nu }$ and ${\lambda }_{x}^{*}={\lambda }_{x}/\delta _{\nu }^{*}$.

The normalised premultiplied streamwise and spanwise spectra of the fluctuating streamwise velocity $k_{x}E_{\rho u^{\prime \prime }u^{\prime \prime }}/ (\bar {\rho }{u_{\tau }^{*}}^{2} )$ and $k_{z}E_{\rho u^{\prime \prime }u^{\prime \prime }}/ (\bar {\rho }{u_{\tau }^{*}}^{2} )$ are shown in figure 10. It is found in figures 10(a) and 10(c) that the premultiplied streamwise and spanwise spectra of the fluctuating streamwise velocity achieve their primary peaks at $y^{*} \approx 18$, which are consistent with the primary peak location of $u_{rms}^{\prime \prime }/u_{\tau }^{*}$ (figure 4a). The peak of $u_{rms}^{\prime \prime }/u_{\tau }^{*}$ corresponds to the cycle of the near-wall streak generation (Jiménez & Pinelli Reference Jiménez and Pinelli1999; Hutchins & Marusic Reference Hutchins and Marusic2007b; Monty et al. Reference Monty, Hutchins, Ng, Marusic and Chong2009; Jiménez Reference Jiménez2013; Pirozzoli & Bernardini Reference Pirozzoli and Bernardini2013; Huang et al. Reference Huang, Duan and Choudhari2022). Furthermore, $k_{z}E_{\rho u^{\prime \prime }u^{\prime \prime }}/ (\bar {\rho }{u_{\tau }^{*}}^{2} )$ has a weak outer peak at nearly $y/\delta \approx 0.2$ (figure 10d), indicating the long streaky motion in the outer region (i.e. large-scale motions or very large-scale motions) (Hutchins & Marusic Reference Hutchins and Marusic2007a; Monty et al. Reference Monty, Hutchins, Ng, Marusic and Chong2009; Pirozzoli & Bernardini Reference Pirozzoli and Bernardini2011, Reference Pirozzoli and Bernardini2013; Hwang Reference Hwang2016; Huang et al. Reference Huang, Duan and Choudhari2022). However, the outer peak of $k_{x}E_{\rho u^{\prime \prime }u^{\prime \prime }}/ (\bar {\rho }{u_{\tau }^{*}}^{2} )$ is not evident (figure 10b), mainly due to the relatively low Reynolds number of the DNS database (Hwang Reference Hwang2016).

Figure 10. (a,b) The normalised premultiplied streamwise spectra of the fluctuating streamwise velocity $k_{x}E_{\rho u^{\prime \prime }u^{\prime \prime }}/ (\bar {\rho }{u_{\tau }^{*}}^{2} )$ in (a) inner scaling and (b) outer scaling. (c,d) The normalised premultiplied spanwise spectra of the fluctuating streamwise velocity $k_{z}E_{\rho u^{\prime \prime }u^{\prime \prime }}/ (\bar {\rho }{u_{\tau }^{*}}^{2} )$ in (c) inner scaling and (d) outer scaling. The filled contour represents the normalised premultiplied spectra in ‘M8T08’. The line contour levels are (0.2, 0.4, 0.6, 0.8) times the peak values. The horizontal dashed lines represent $y^{*}=18$ in (a,c) and $y/\delta =0.2$ in (b,d), respectively.

The normalised premultiplied streamwise and spanwise spectra of the fluctuating streamwise velocity $k_{x}E_{\rho u^{\prime \prime }u^{\prime \prime }}/ (\bar {\rho }{u_{\tau }^{*}}^{2} )$ and $k_{z}E_{\rho u^{\prime \prime }u^{\prime \prime }}/ (\bar {\rho }{u_{\tau }^{*}}^{2} )$ at $y^{*}=18$ and $y/\delta =0.2$ are shown in figures 11 and 12, respectively. It is found in figures 11(a) and 11(c) that the peak locations of the premultiplied streamwise and spanwise spectra of the fluctuating streamwise velocity in wall units $( {\lambda }_{x}^{+},{\lambda }_{z}^{+} )$ increase significantly as the wall temperature decreases, especially in the strongly cooled wall case ‘M8T015’. These peak locations represent the characteristic streamwise length and spanwise spacing of the near-wall streaks. However, the semilocal scaling $( {\lambda }_{x}^{*},{\lambda }_{z}^{*} )$ can significantly reduce the disparity between the peak locations of spectra (figure 11b,d), yielding the characteristic streamwise length ${\lambda }_{x}^{*} \approx 10^{3}$ and spanwise spacing ${\lambda }_{z}^{*} \approx 150$ in different wall temperature cases. Similar values of the characteristic streamwise length and spanwise spacing of the near-wall streaks have also been found in incompressible boundary layers (Hutchins & Marusic Reference Hutchins and Marusic2007b; Monty et al. Reference Monty, Hutchins, Ng, Marusic and Chong2009) and compressible boundary layers (Pirozzoli & Bernardini Reference Pirozzoli and Bernardini2013; Huang et al. Reference Huang, Duan and Choudhari2022). Furthermore, it is shown in figure 12 that the streamwise and spanwise spectra achieve their peak values at ${\lambda }_{x}/\delta \approx 2$ and ${\lambda }_{z}/\delta \approx 1$, respectively, at $y/\delta =0.2$, which represent the characteristic streamwise length and spanwise spacing of the long streaky motions in the outer region. Similar values of the characteristic spanwise spacing at $y/\delta =0.2$ was also obtained in a previous study of hypersonic turbulent boundary layers (Cogo et al. Reference Cogo, Salvadore, Picano and Bernardini2022).

Figure 11. (a,b) The normalised premultiplied streamwise spectra of the fluctuating streamwise velocity $k_{x}E_{\rho u^{\prime \prime }u^{\prime \prime }}/ (\bar {\rho }{u_{\tau }^{*}}^{2} )$ at $y^{*}=18$ plotted against (a) ${\lambda }_{x}^{+}$ and (b) ${\lambda }_{x}^{*}$. (c,d) The normalised premultiplied spanwise spectra of the fluctuating streamwise velocity $k_{z}E_{\rho u^{\prime \prime }u^{\prime \prime }}/ (\bar {\rho }{u_{\tau }^{*}}^{2} )$ at $y^{*}=18$ plotted against (c) ${\lambda }_{z}^{+}$ and (d) ${\lambda }_{z}^{*}$.

Figure 12. (a) The normalised premultiplied streamwise spectra of the fluctuating streamwise velocity $k_{x}E_{\rho u^{\prime \prime }u^{\prime \prime }}/ (\bar {\rho }{u_{\tau }^{*}}^{2} )$ at $y/\delta =0.2$ plotted against ${\lambda }_{x}/\delta$. (b) The normalised premultiplied spanwise spectra of the fluctuating streamwise velocity $k_{z}E_{\rho u^{\prime \prime }u^{\prime \prime }}/ (\bar {\rho }{u_{\tau }^{*}}^{2} )$ at $y/\delta =0.2$ plotted against ${\lambda }_{z}/\delta$.

The normalised premultiplied streamwise and spanwise spectra of the fluctuating pressure $k_{x}E_{ p^{\prime }p^{\prime }}/\bar {p}^{2}$ and $k_{z}E_{ p^{\prime }p^{\prime }}/\bar {p}^{2}$ are shown in figure 13. The $k_{x}E_{ p^{\prime }p^{\prime }}/\bar {p}^{2}$ and $k_{z}E_{ p^{\prime }p^{\prime }}/\bar {p}^{2}$ in the nearly adiabatic wall case ‘M8T08’ achieve their primary peaks at $y^{*} \approx 60$, while the pressure spectra of ‘M8T04’ and ‘M8T015’ achieve their primary peaks at the wall. These observations are consistent with the primary peak locations of $p_{rms}^{\prime }/\bar {p}$ (figure 5a).

Figure 13. (a,b) The normalised premultiplied streamwise spectra of the fluctuating pressure $k_{x}E_{ p^{\prime }p^{\prime }}/\bar {p}^{2}$ in (a) inner scaling and (b) outer scaling. (c,d) The normalised premultiplied spanwise spectra of the fluctuating pressure $k_{z}E_{ p^{\prime }p^{\prime }}/\bar {p}^{2}$ in (c) inner scaling and (d) outer scaling. The filled contour represents the normalised premultiplied spectra in ‘M8T08’. The line contour levels are (0.2, 0.4, 0.6, 0.8) times the peak values. The horizontal dashed lines represent $y^{*}=2, 5, 60$ in (a,c).

The normalised premultiplied streamwise and spanwise spectra of the fluctuating pressure $k_{x}E_{ p^{\prime }p^{\prime }}/\bar {p}^{2}$ and $k_{z}E_{ p^{\prime }p^{\prime }}/\bar {p}^{2}$ at $y^{*}=60$, $y^{*}=2$ and $y^{*}=5$ are shown in figures 14, 15 and 16, respectively. It is shown in figure 14 that as the wall temperature decreases, the peak values of $k_{x}E_{ p^{\prime }p^{\prime }}/\bar {p}^{2}$ and $k_{z}E_{ p^{\prime }p^{\prime }}/\bar {p}^{2}$ are drastically enhanced, and the peak locations also increase under the wall unit $({\lambda }_{x}^{+}, {\lambda }_{z}^{+})$ at $y^{*}=60$. The semilocal scaling $({\lambda }_{x}^{*}, {\lambda }_{z}^{*})$ significantly reduces the disparity between the peak locations, and $k_{x}E_{ p^{\prime }p^{\prime }}/\bar {p}^{2}$ and $k_{z}E_{ p^{\prime }p^{\prime }}/\bar {p}^{2}$ achieve their peaks at ${\lambda }_{x}^{*} \approx 400$ and ${\lambda }_{z}^{*} \approx 250$, respectively, at $y^{*}=60$.

Figure 14. (a,b) The normalised premultiplied streamwise spectra of the fluctuating pressure $k_{x}E_{ p^{\prime }p^{\prime }}/\bar {p}^{2}$ at $y^{*}=60$ plotted against (a) ${\lambda }_{x}^{+}$ and (b) ${\lambda }_{x}^{*}$. (c,d) The normalised premultiplied spanwise spectra of the fluctuating pressure $k_{z}E_{ p^{\prime }p^{\prime }}/\bar {p}^{2}$ at $y^{*}=60$ plotted against (c) ${\lambda }_{z}^{+}$ and (d) ${\lambda }_{z}^{*}$.

Figure 15. (a,b) The normalised premultiplied streamwise spectra of the fluctuating pressure $k_{x}E_{ p^{\prime }p^{\prime }}/\bar {p}^{2}$ at $y^{*}=2$ plotted against (a) ${\lambda }_{x}^{+}$ and (b) ${\lambda }_{x}^{*}$. (c,d) The normalised premultiplied spanwise spectra of the fluctuating pressure $k_{z}E_{ p^{\prime }p^{\prime }}/\bar {p}^{2}$ at $y^{*}=2$ plotted against (c) ${\lambda }_{z}^{+}$ and (d) ${\lambda }_{z}^{*}$.

Figure 16. (a,b) The normalised premultiplied streamwise spectra of the fluctuating pressure $k_{x}E_{ p^{\prime }p^{\prime }}/\bar {p}^{2}$ at $y^{*}=5$ plotted against (a) ${\lambda }_{x}^{+}$ and (b) ${\lambda }_{x}^{*}$. (c,d) The normalised premultiplied spanwise spectra of the fluctuating pressure $k_{z}E_{ p^{\prime }p^{\prime }}/\bar {p}^{2}$ at $y^{*}=5$ plotted against (c) ${\lambda }_{z}^{+}$ and (d) ${\lambda }_{z}^{*}$.

However, in the near-wall region ($\,y^{*}=2$), the behaviours of the pressure spectra are quite different. It is found in figure 15 that peak locations of $k_{x}E_{ p^{\prime }p^{\prime }}/\bar {p}^{2}$ and $k_{z}E_{ p^{\prime }p^{\prime }}/\bar {p}^{2}$ in the nearly adiabatic wall case ‘M8T08’ at $y^{*}=2$ are significantly different from those in cooled wall cases ‘M8T04’ and ‘M8T015’. This difference can be explained according to the instantaneous fields of the normalised fluctuating pressure $p^{\prime }/\bar {p}$ at $y^{*}=2$ as shown in figure 17. It is shown in figures 17(a) and 17(b) that the special structures marked by red dashed boxes are observed, and these are TAPNS. These structures are well organised as wave-like alternating positive and negative patterns along the streamwise direction, and have also been found in compressible channel flows (Yu, Xu & Pirozzoli Reference Yu, Xu and Pirozzoli2019; Tang et al. Reference Tang, Zhao, Wan and Liu2020) and turbulent boundary layers (Xu et al. Reference Xu, Wang, Wan, Yu, Li and Chen2021b; Zhang et al. Reference Zhang, Wan, Liu, Sun and Lu2022). Moreover, the TAPNS disappear in the nearly adiabatic wall case ‘M8T08’, and are strongly enhanced as the wall temperature decreases. Particularly, in the strongly cooled wall case ‘M8T015’ (figure 17a), the TAPNS are prevalent in the whole field. The extreme positive and negative values of $p^{\prime }/\bar {p}$ are mainly located among the TAPNS, which further lead to the significant enhancement of $p_{rms}^{\prime }/\bar {p}$ near the wall (figure 5a). The peak locations of $k_{x}E_{ p^{\prime }p^{\prime }}/\bar {p}^{2}$ and $k_{z}E_{ p^{\prime }p^{\prime }}/\bar {p}^{2}$ in the nearly adiabatic wall case ‘M8T08’ are ${\lambda }_{x}^{*} \approx 300$ and ${\lambda }_{z}^{*} \approx 200$, respectively, at $y^{*}=2$, which have similar aspect ratio ${\lambda }_{x}^{*}/{\lambda }_{z}^{*}$ to the characteristic scales at $y^{*}=60$. Nevertheless, the pressure spectra achieve their peaks at ${\lambda }_{x}^{*} \approx 120$ and ${\lambda }_{z}^{*} \approx 200$ in ‘M8T04’, and ${\lambda }_{x}^{*} \approx 210$ and ${\lambda }_{z}^{*} \approx 250$ in ‘M8T015’. As the wall temperature decreases from ‘M8T04’ to ‘M8T015’, the characteristic streamwise length scale ${\lambda }_{x}^{*}$ is significantly increased, while the characteristic spanwise spacing scale ${\lambda }_{z}^{*}$ is slightly enhanced, which is similar to the behaviour of the instantaneous wave-like alternating positive and negative structures shown in figures 17(a) and 17(b). Therefore, it can be inferred that the characteristic streamwise length scale ${\lambda }_{x}^{*}$ and spanwise spacing scale ${\lambda }_{z}^{*}$ of the cooled wall cases ‘M8T04’ and ‘M8T015’ represent the scales of the TAPNS. The TAPNS is short and fat (i.e. ${\lambda }_{x}^{*} < {\lambda }_{z}^{*})$. As the wall temperature decreases, the aspect ratio ${\lambda }_{x}^{*}/{\lambda }_{z}^{*}$ of TAPNS increases from almost 0.6 in ‘M8T04’ to 0.84 in ‘M8T015’, which indicates that the strongly cooled wall prefers to increase the streamwise length scale compared with the spanwise spacing scale of TAPNS. Moreover, the intensity of the TAPNS is strongly enhanced as the wall temperature decreases. It is noted that these wave-like alternating positive and negative patterns have also been reported in the fluctuating dilatation ${\theta }''\equiv \partial {u}''_{k}/\partial x_{k}$ in figure 6 of Xu et al. (Reference Xu, Wang, Wan, Yu, Li and Chen2021b). Therefore, it can be deduced that as the wall temperature decreases, the peak values of the pressure spectra and the turbulent intensities of the pressure are significantly enhanced in the near-wall region, which further leads to the enhanced compressibility near the wall (Duan et al. Reference Duan, Beekman and Martin2010; Zhang et al. Reference Zhang, Duan and Choudhari2018; Xu et al. Reference Xu, Wang, Wan, Yu, Li and Chen2021a,Reference Xu, Wang, Wan, Yu, Li and Chenb; Zhang et al. Reference Zhang, Wan, Liu, Sun and Lu2022). Moreover, it is shown above in figure 5(a) that the maximum values of $p^{\prime }/\bar {p}$ appears at the wall in ‘M8T04’ and ‘M8T015’. This phenomenon is attributed to the appearance of TAPNS near the wall in the cooled wall cases.

Figure 17. The instantaneous fields of the normalised fluctuating pressure $p^{\prime }/\bar {p}$ at $y^{*}=2$ in (a) ‘M8T015’, (b) ‘M8T04’ and (c) ‘M8T08’.

As the wall-normal location moves farther away from the wall (at $\,y^{*}=5$), it is shown in figure 16 that most of the peak locations of the streamwise and spanwise spectra are similar to those at $y^{*}=2$, except for the peak location of $k_{x}E_{ p^{\prime }p^{\prime }}/\bar {p}^{2}$ in ‘M8T04’. It is found in figure 16(b) that the peak of $k_{x}E_{ p^{\prime }p^{\prime }}/\bar {p}^{2}$ in ‘M8T04’becomes much wider than that at $y^{*}=2$, and the characteristic streamwise length scale of $k_{x}E_{ p^{\prime }p^{\prime }}/\bar {p}^{2}$ in ‘M8T08’ (${\lambda }_{x}^{*} \approx 300$) is also found in the streamwise spectra in ‘M8T04’. Here for better description, the pressure structures with the characteristic streamwise length scale in ‘M8T08’ are named as ‘the base acoustic structures’. The above observation indicates that the base acoustic structures also exist in the cooled wall cases ‘M8T04’ and ‘M8T015’. If the wall is significantly cooled and the wall-normal location $y^{*}$ is close to the wall, the strength of the TAPNS is much larger than that of the base pressure structures, and only the characteristic streamwise length scale ${\lambda }_{x}^{*}$ of TAPNS is dominant in $k_{x}E_{ p^{\prime }p^{\prime }}/\bar {p}^{2}$ (i.e. ‘M8T04’ and ‘M8T015’ in figure 15b and ‘M8T015’ in figure 16b). As the wall temperature increases and $y^{*}$ moves away from the wall, the intensity of the TAPNS becomes weaker. Therefore, the TAPNS and the base acoustic structures have similar intensities in these situations, which result in the wide peak in ‘M8T04’ in figure 16(b). When the wall temperature is nearly adiabatic (i.e. ‘M8T08’), the TAPNS disappear and only the base acoustic structures are dominant in the near-wall region.

The normalised premultiplied streamwise and spanwise spectra of the fluctuating entropy $k_{x}E_{ s^{\prime }s^{\prime }} ( \gamma M^{2} )^{2}$ and $k_{z}E_{ s^{\prime }s^{\prime }} ( \gamma M^{2} )^{2}$ are depicted in figure 18. The $k_{x}E_{ s^{\prime }s^{\prime }} ( \gamma M^{2} )^{2}$ and $k_{z}E_{ s^{\prime }s^{\prime }} ( \gamma M^{2} )^{2}$ achieve their primary peaks near the edge of the boundary layer, which are consistent with the primary peak location of $s_{rms}^{\prime }\gamma M^{2}$ (figure 6d). The secondary peaks of entropy spectra appear at $y^{*}\approx 50$ in ‘M8T08’ and ‘M8T04’, which are coincident with the secondary peak location of $s_{rms}^{\prime }\gamma M^{2}$ (figure 6a). However, for the strongly cooled wall case ‘M8T015’, the secondary peaks of entropy spectra appear at nearly $y^{*}=5$. The normalised premultiplied streamwise and spanwise spectra of the fluctuating entropy $k_{x}E_{ s^{\prime }s^{\prime }} ( \gamma M^{2} )^{2}$ and $k_{z}E_{ s^{\prime }s^{\prime }} ( \gamma M^{2} )^{2}$ at $y/\delta =0.7$, $y^{*}=50$, $y^{*}=2$ and $y^{*}=5$ are plotted in figures 19, 20, 21 and 22, respectively. It is shown in figure 19 that $k_{x}E_{ s^{\prime }s^{\prime }} ( \gamma M^{2} )^{2}$ and $k_{z}E_{ s^{\prime }s^{\prime }} ( \gamma M^{2} )^{2}$ attain their peaks at ${\lambda }_{x}/\delta \approx 1.3$ and ${\lambda }_{z}/\delta \approx 1$, respectively. Furthermore, the peak values of $k_{x}E_{ s^{\prime }s^{\prime }} ( \gamma M^{2} )^{2}$ and $k_{z}E_{ s^{\prime }s^{\prime }} ( \gamma M^{2} )^{2}$ decrease as the wall temperature decreases. It can be seen in figure 20 that the semilocal scaling can reduce the disparity between the peak locations of spectra. The $k_{x}E_{ s^{\prime }s^{\prime }} ( \gamma M^{2} )^{2}$ and $k_{z}E_{ s^{\prime }s^{\prime }} ( \gamma M^{2} )^{2}$ achieve their peaks at ${\lambda }_{x}^{*} \approx 700$ and ${\lambda }_{z}^{*} \approx 250$, respectively, at $y^{*}=50$. Furthermore, the peak values of the normalised premultiplied streamwise and spanwise spectra of the fluctuating entropy decrease as the wall temperature decreases, which are consistent with the observation that the values of $s_{rms}^{\prime }\gamma M^{2}$ decrease as the wall temperature decreases at $y^{*}=50$ (figure 6a).

Figure 18. (a,b) The normalised premultiplied streamwise spectra of the fluctuating entropy $k_{x}E_{ s^{\prime }s^{\prime }} ( \gamma M^{2} )^{2}$ in (a) inner scaling and (b) outer scaling. (c,d) The normalised premultiplied spanwise spectra of the fluctuating entropy $k_{z}E_{ s^{\prime }s^{\prime }} ( \gamma M^{2} )^{2}$ in (c) inner scaling and (d) outer scaling. The filled contour represents the normalised premultiplied spectra in ‘M8T08’. The line contour levels are (0.2, 0.4, 0.6, 0.8) times the peak values. The horizontal dashed lines represent $y^{*}=2, 5, 50$ in (a,c) and $y/\delta =0.7$ in (b,d), respectively.

Figure 19. (a) The normalised premultiplied streamwise spectra of the fluctuating entropy $k_{x}E_{ s^{\prime }s^{\prime }} ( \gamma M^{2} )^{2}$ at $y/\delta =0.7$ plotted against ${\lambda }_{x}/\delta$. (b) The normalised premultiplied spanwise spectra of the fluctuating entropy $k_{z}E_{ s^{\prime }s^{\prime }} ( \gamma M^{2} )^{2}$ at $y/\delta =0.7$ plotted against ${\lambda }_{z}/\delta$.

Figure 20. (a,b) The normalised premultiplied streamwise spectra of the fluctuating entropy $k_{x}E_{ s^{\prime }s^{\prime }} ( \gamma M^{2} )^{2}$ at $y^{*}=50$ plotted against (a) ${\lambda }_{x}^{+}$ and (b) ${\lambda }_{x}^{*}$. (c,d) The normalised premultiplied spanwise spectra of the fluctuating entropy $k_{z}E_{ s^{\prime }s^{\prime }} ( \gamma M^{2} )^{2}$ at $y^{*}=50$ plotted against (c) ${\lambda }_{z}^{+}$ and (d) ${\lambda }_{z}^{*}$.

Figure 21. (ac) The normalised premultiplied streamwise spectra of the fluctuating entropy $k_{x}E_{ s^{\prime }s^{\prime }} ( \gamma M^{2} )^{2}$ at $y^{*}=2$ plotted against (a) ${\lambda }_{x}^{+}$, (b) ${\lambda }_{x}^{*}$ and (c) ${\lambda }_{x}/\delta$. (df) The normalised premultiplied spanwise spectra of the fluctuating entropy $k_{z}E_{ s^{\prime }s^{\prime }} ( \gamma M^{2} )^{2}$ at $y^{*}=2$ plotted against (d) ${\lambda }_{z}^{+}$, (e) ${\lambda }_{z}^{*}$ and (f) ${\lambda }_{z}/\delta$.

Figure 22. (ac) The normalised premultiplied streamwise spectra of the fluctuating entropy $k_{x}E_{ s^{\prime }s^{\prime }} ( \gamma M^{2} )^{2}$ at $y^{*}=5$ plotted against (a) ${\lambda }_{x}^{+}$, (b) ${\lambda }_{x}^{*}$ and (c) ${\lambda }_{x}/\delta$. (df) The normalised premultiplied spanwise spectra of the fluctuating entropy $k_{z}E_{ s^{\prime }s^{\prime }} ( \gamma M^{2} )^{2}$ at $y^{*}=5$ plotted against (d) ${\lambda }_{z}^{+}$, (e) ${\lambda }_{z}^{*}$ and (f) ${\lambda }_{z}/\delta$.

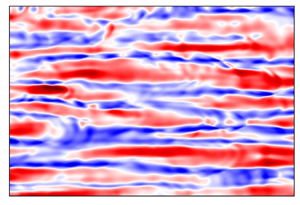
It is shown in figure 6(a) that a local secondary peak of $s_{rms}^{\prime }\gamma M^{2}$ appears near the wall in ‘M8T015’. The underlying mechanism of this phenomenon is revealed as follows. It is found in figure 21 that the peak values of the entropy spectra in ‘M8T04’ and ‘M8T015’ are significantly larger than those in ‘M8T08’, and the peak values increase as the wall temperature decreases. Furthermore, the $k_{x}E_{ s^{\prime }s^{\prime }} ( \gamma M^{2} )^{2}$ in ‘M8T015’ and ‘M8T04’ attain their peaks at ${\lambda }_{x}/\delta \approx 2.3$ and 1.3, respectively, and the peak locations of the $k_{z}E_{ s^{\prime }s^{\prime }} ( \gamma M^{2} )^{2}$ in ‘M8T015’ and ‘M8T04’ are ${\lambda }_{z}/\delta \approx 0.25$ and 0.2, respectively. The underlying structures of the characteristic scales of the entropy spectra are revealed by the instantaneous fields of the normalised fluctuating entropy $s^{\prime }\gamma M^{2}$ at $y^{*}=2$ shown in figure 23. It can be seen in figures 23(a) and 23(b) that the long and thin fluctuating entropy structures only appear when the wall is cooled (‘M8T015’ and ‘M8T04’). These special entropic structures exhibit the streaky patterns with alternating stripes of the high and low entropy, which is similar to the streaks of $u^{\prime }$ (shown in figure 5a in Xu et al. (Reference Xu, Wang, Wan, Yu, Li and Chen2021a)) with $R ( s ^{\prime },u ^{\prime } ) = 0.93$ at $y^{*}=2$ in ‘M8T015’. However, the entropy structures in the nearly adiabatic wall case ‘M8T08’ are pretty weak and fragmented. Here for the sake of description, the entropy structures in ‘M8T08’ are named as ‘the base entropic structures’, while the generated streaky patterns in ‘M8T04’ and ‘M8T015’ are called SES. It is shown in figure 18 that the characteristic length scale is significantly larger than the characteristic spanwise spacing scale (i.e. ${\lambda }_{x}/\delta \gg {\lambda }_{z}/\delta$) in ‘M8T015’ and ‘M8T04’, which is consistent with the long and thin nature of SES. Furthermore, the ${\lambda }_{x}/\delta$ and ${\lambda }_{z}/\delta$ in ‘M8T015’ are larger than those in ‘M8T04’, which is coincident with the observation that the SES become longer in the streamwise direction and fatter in the spanwise direction as the wall temperature decreases (figure 23a,b). Accordingly, it can be inferred that the characteristic streamwise length scale ${\lambda }_{x}/\delta$ and spanwise spacing scale ${\lambda }_{z}/\delta$ of the entropy spectra in ‘M8T015’ and ‘M8T04’ represent the scales of the SES. Furthermore, the aspect ratio ${\lambda }_{x}/{\lambda }_{z}$ of SES increases from 6.5 in ‘M8T04’ to 9.2 in ‘M8T015’, suggesting that the strongly cooled wall prefers to increase the streamwise length scale compared with the spanwise spacing scale of SES. Moreover, the intensity of the SES is significantly enhanced as the wall temperature decreases, which further leads to the significant enhancement of $s_{rms}^{\prime }\gamma M^{2}$ near the wall in the cooled wall cases (figure 6a). Specifically, the local secondary peak of $s_{rms}^{\prime }\gamma M^{2}$ near the wall in ‘M8T015’ is attributed to the strong intensity of the SES.

Figure 23. The instantaneous fields of the normalised fluctuating entropy $s^{\prime }\gamma M^{2}$ at $y^{*}=2$ in (a) ‘M8T015’, (b) ‘M8T04’ and (c) ‘M8T08’.

As the wall-normal location increases to $y^{*}=5$, it is seen in figure 22 that the entropy spectra in ‘M8T08’ and ‘M8T04’ have pretty small peak values, and attain their peaks at ${\lambda }_{x}^{*} \approx 450$ and ${\lambda }_{z}^{*} \approx 140$, respectively, at $y^{*}=5$, which have a similar characteristic aspect ratio ${\lambda }_{x}^{*}/{\lambda }_{z}^{*}$ with the characteristic scales at $y^{*}=50$. Furthermore, the peak values of the entropy spectra in ‘M8T08’ and ‘M8T04d’ decrease as the wall temperature decreases, which are coincident with the behaviours at $y^{*}=50$ and $y/\delta =0.7$. However, the peak values of the entropy spectra in the strongly cooled wall case ‘M8T015’ are significantly larger than those in the other two cases. The entropy spectra in ‘M8T015’ attain their peaks at ${\lambda }_{x}/\delta \approx 2.3$ and ${\lambda }_{z}/\delta \approx 0.25$, respectively, which are similar to the characteristic scales at $y^{*}=2$. The above observations indicate that the SES exist in ‘M8T015’, while they disappear in ‘M8T04’ at $y^{*}=5$. Therefore, it is implied that the SES can exist in a larger range of wall-normal distance $y^{*}$ as the wall temperature decreases.

The normalised premultiplied streamwise and spanwise spectra of the fluctuating density $k_{x}E_{ \rho ^{\prime }\rho ^{\prime }}/\bar {\rho }^{2}$ and $k_{z}E_{ \rho ^{\prime }\rho ^{\prime }}/\bar {\rho }^{2}$ are shown in figure 24. It is found that the spectra of the fluctuating density are similar to those of the fluctuating entropy at $y^{*}>20$, which is consistent with the observation in figure 9(a) that the fluctuating density is dominated by its entropic mode at $y^{*}>20$. The $k_{x}E_{ \rho ^{\prime }\rho ^{\prime }}/\bar {\rho }^{2}$ and $k_{z}E_{ \rho ^{\prime }\rho ^{\prime }}/\bar {\rho }^{2}$ in three cases achieve their primary peaks at $y/\delta \approx 0.6$, and the secondary peak locations of the density spectra in ‘M8T08’ and ‘M8T04’ are $y^{*} \approx 40$, which are coincident with peak locations of $\rho _{rms}^{\prime }/\bar {\rho }$ (figure 6b,e). However, a complicated behaviour of the density spectra appears in ‘M8T015’, mainly due to the strong variation of the relative contribution $\rho _{E,rms}^{\prime }/ (\rho _{E,rms}^{\prime }+ \rho _{I,rms}^{\prime } )$ at $y^{*}<20$ with a strongly cooled wall (figure 9a).

Figure 24. (a,b) The normalised premultiplied streamwise spectra of the fluctuating density $k_{x}E_{ \rho ^{\prime }\rho ^{\prime }}/\bar {\rho }^{2}$ in (a) inner scaling and (b) outer scaling. (c,d) The normalised premultiplied spanwise spectra of the fluctuating density $k_{z}E_{ \rho ^{\prime }\rho ^{\prime }}/\bar {\rho }^{2}$ in (c) inner scaling and (d) outer scaling. The filled contour represents the normalised premultiplied spectra in ‘M8T08’. The line contour levels are (0.2, 0.4, 0.6, 0.8) times the peak values. The horizontal dashed lines represent $y^{*}=2, 5, 40$ in (a,c) and $y/\delta =0.6$ in (b,d), respectively.

The normalised premultiplied streamwise and spanwise spectra of the fluctuating density $k_{x}E_{ \rho ^{\prime }\rho ^{\prime }}/\bar {\rho }^{2}$ and $k_{z}E_{ \rho ^{\prime }\rho ^{\prime }}/\bar {\rho }^{2}$ at $y/\delta =0.6$ and $y^{*}=40$ are depicted in figures 25 and 26, respectively. The $k_{x}E_{ \rho ^{\prime }\rho ^{\prime }}/\bar {\rho }^{2}$ and $k_{z}E_{ \rho ^{\prime }\rho ^{\prime }}/\bar {\rho }^{2}$ achieve their peaks at ${\lambda }_{x}/\delta \approx 1.3$ and ${\lambda }_{z}/\delta \approx 1$, respectively, at $y/\delta =0.6$ (figure 25), and the peak locations of the density spectra are ${\lambda }_{x}^{*} \approx 700$ and ${\lambda }_{z}^{*} \approx 250$, respectively, at $y^{*}=40$ (figure 26). It is noted that the peak locations of the density spectra are totally similar to those of the entropy spectra (figures 19 and 20), which are mainly due to the reason that the fluctuating density is dominated by its entropic mode at $y^{*}>20$ (figure 9a).

Figure 25. (a) The normalised premultiplied streamwise spectra of the fluctuating density $k_{x}E_{ \rho ^{\prime }\rho ^{\prime }}/\bar {\rho }^{2}$ at $y/\delta =0.6$ plotted against ${\lambda }_{x}/\delta$. (b) The normalised premultiplied spanwise spectra of the fluctuating density $k_{z}E_{ \rho ^{\prime }\rho ^{\prime }}/\bar {\rho }^{2}$ at $y/\delta =0.6$ plotted against ${\lambda }_{z}/\delta$.

Figure 26. (a,b) The normalised premultiplied streamwise spectra of the fluctuating density $k_{x}E_{ \rho ^{\prime }\rho ^{\prime }}/\bar {\rho }^{2}$ at $y^{*}=40$ plotted against (a) ${\lambda }_{x}^{+}$ and (b) ${\lambda }_{x}^{*}$. (c,d) The normalised premultiplied spanwise spectra of the fluctuating density $k_{z}E_{ \rho ^{\prime }\rho ^{\prime }}/\bar {\rho }^{2}$ at $y^{*}=40$ plotted against (c) ${\lambda }_{z}^{+}$ and (d) ${\lambda }_{z}^{*}$.

The normalised premultiplied streamwise and spanwise spectra of the fluctuating density $k_{x}E_{ \rho ^{\prime }\rho ^{\prime }}/\bar {\rho }^{2}$ and $k_{z}E_{ \rho ^{\prime }\rho ^{\prime }}/\bar {\rho }^{2}$ at $y^{*}=2$ and $y^{*}=5$ are depicted in figures 27 and 28, respectively.

Figure 27. (ac) The normalised premultiplied streamwise spectra of the fluctuating density $k_{x}E_{ \rho ^{\prime }\rho ^{\prime }}/\bar {\rho }^{2}$ at $y^{*}=2$ plotted against (a) ${\lambda }_{x}^{+}$, (b) ${\lambda }_{x}^{*}$ and (c) ${\lambda }_{x}/\delta$. (df) The normalised premultiplied spanwise spectra of the fluctuating density $k_{z}E_{ \rho ^{\prime }\rho ^{\prime }}/\bar {\rho }^{2}$ at $y^{*}=2$ plotted against (d) ${\lambda }_{z}^{+}$, (e) ${\lambda }_{z}^{*}$ and (f) ${\lambda }_{z}/\delta$.

Figure 28. (ac) The normalised premultiplied streamwise spectra of the fluctuating density $k_{x}E_{ \rho ^{\prime }\rho ^{\prime }}/\bar {\rho }^{2}$ at $y^{*}=5$ plotted against (a) ${\lambda }_{x}^{+}$, (b) ${\lambda }_{x}^{*}$ and (c) ${\lambda }_{x}/\delta$. (df) The normalised premultiplied spanwise spectra of the fluctuating density $k_{z}E_{ \rho ^{\prime }\rho ^{\prime }}/\bar {\rho }^{2}$ at $y^{*}=5$ plotted against (d) ${\lambda }_{z}^{+}$, (e) ${\lambda }_{z}^{*}$ and (f) ${\lambda }_{z}/\delta$.

At $y^{*}=2$ (figure 27), the peak locations of the density spectra are similar to those of the pressure spectra at $y^{*}=2$ in three cases, suggesting that the acoustic mode of density is dominant in the fluctuating density at $y^{*}=2$. However, the values of the density spectra at large values of ${\lambda }_{x}/\delta$ and ${\lambda }_{z}/\delta$ are much larger than those of the pressure spectra at $y^{*}=2$ in ‘M8T04’ and ‘M8T015’, which indicate that the relative contribution of the entropic mode to the fluctuating density is enhanced at $y^{*}=2$ when the wall is cooled.

The enhancement of the relative contribution of the entropic mode to the fluctuating density in the strongly cooled wall case becomes much more significant at $y^{*}=5$. It is found in figure 28 that the peak locations of the density spectra are also similar to those of the pressure spectra at $y^{*}=5$ in three cases, indicating that the acoustic mode of density still has a major contribution to the fluctuating density at $y^{*}=5$. However, a secondary peak of $k_{x}E_{ \rho ^{\prime }\rho ^{\prime }}/\bar {\rho }^{2}$ appears at ${\lambda }_{x}/\delta \approx 2.3$ in ‘M8T015’, suggesting that the relative contribution of the entropic mode to the fluctuating density becomes significantly larger in the strongly cooled wall case ‘M8T015’. It is shown in figure 9(a) that the relative contribution $\rho _{E,rms}^{\prime }/ (\rho _{E,rms}^{\prime }+ \rho _{I,rms}^{\prime } )$ in ‘M8T015’ has a hump marked by the green dashed box. Here, the density spectra at $y^{*}=5$ in ‘M8T015’ reveal that the hump is mainly due to the appearance of SES when the wall is strongly cooled. The SES significantly enhance the intensity of the entropic mode of density, which further enhance the relative contribution of the entropic mode to the fluctuating density.

The normalised premultiplied streamwise and spanwise spectra of the fluctuating temperatures $k_{x}E_{ T^{\prime }T^{\prime }}/\bar {T}^{2}$ and $k_{z}E_{ T^{\prime }T^{\prime }}/\bar {T}^{2}$ are shown in figure 29. It is found that the temperature spectra are similar to the entropy spectra (figure 18), indicating the dominant contribution of the entropic mode of temperature as shown in figure 9(b).

Figure 29. (a,b) The normalised premultiplied streamwise spectra of the fluctuating temperature $k_{x}E_{ T^{\prime }T^{\prime }}/\bar {T}^{2}$ in (a) inner scaling and (b) outer scaling. (c,d) The normalised premultiplied spanwise spectra of the fluctuating temperature $k_{z}E_{ T^{\prime }T^{\prime }}/\bar {T}^{2}$ in (c) inner scaling and (d) outer scaling. The filled contour represents the normalised premultiplied spectra in ‘M8T08’. The line contour levels are (0.2, 0.4, 0.6, 0.8) times the peak values. The horizontal dashed lines represent $y^{*}=2, 5, 50$ in (a,c) and $y/\delta =0.8$ in (b,d), respectively.

The normalised premultiplied streamwise and spanwise spectra of the fluctuating temperatures $k_{x}E_{ T^{\prime }T^{\prime }}/\bar {T}^{2}$ and $k_{z}E_{ T^{\prime }T^{\prime }}/\bar {T}^{2}$ at $y/\delta =0.8$ and $y^{*}=50$ are shown in figures 30 and 31, respectively. The temperature spectra attain their peaks at ${\lambda }_{x}/\delta \approx 1.3$ and ${\lambda }_{z}/\delta \approx 1$ at $y/\delta =0.8$, which are similar to the observation in Cogo et al. (Reference Cogo, Salvadore, Picano and Bernardini2022). Furthermore, the peak locations of the temperature spectra are ${\lambda }_{x}^{*} \approx 700$ and ${\lambda }_{z}^{*} \approx 250$, respectively, at $y^{*}=50$. It is noted that the peak locations of the temperature spectra far from the wall are similar to the behaviours of the entropy spectra, suggesting the dominance of the entropic mode in fluctuating temperature at $y^{*}>20$ (figure 9b).

Figure 30. (a) The normalised premultiplied streamwise spectra of the fluctuating temperature $k_{x}E_{ T^{\prime }T^{\prime }}/\bar {T}^{2}$ at $y/\delta =0.8$ plotted against ${\lambda }_{x}/\delta$. (b) The normalised premultiplied spanwise spectra of the fluctuating temperature $k_{z}E_{ T^{\prime }T^{\prime }}/\bar {T}^{2}$ at $y/\delta =0.8$ plotted against ${\lambda }_{z}/\delta$.

Figure 31. (a,b) The normalised premultiplied streamwise spectra of the fluctuating temperature $k_{x}E_{ T^{\prime }T^{\prime }}/\bar {T}^{2}$ at $y^{*}=50$ plotted against (a) ${\lambda }_{x}^{+}$ and (b) ${\lambda }_{x}^{*}$. (c,d) The normalised premultiplied spanwise spectra of the fluctuating temperature $k_{z}E_{ T^{\prime }T^{\prime }}/\bar {T}^{2}$ at $y^{*}=50$ plotted against (c) ${\lambda }_{z}^{+}$ and (d) ${\lambda }_{z}^{*}$.

The normalised premultiplied streamwise and spanwise spectra of the fluctuating temperatures $k_{x}E_{ T^{\prime }T^{\prime }}/\bar {T}^{2}$ and $k_{z}E_{ T^{\prime }T^{\prime }}/\bar {T}^{2}$ at $y^{*}=2$ and $y^{*}=5$ are shown in figures 32 and 33 respectively. The values of the temperature spectra at $y^{*}=2$ in ‘M8T08’ are pretty small, which is consistent with the small values of $T_{rms}^{\prime }/\bar {T}$ at $y^{*}=2$ in the nearly adiabatic wall case (figure 6c). The primary peak locations of $k_{x}E_{ T^{\prime }T^{\prime }}/\bar {T}^{2}$ in ‘M8T04’ and ‘M8T015’ are ${\lambda }_{x}^{*} \approx 120$ and 210 at $y^{*}=2$, respectively, which are similar to the peak locations of $k_{x}E_{ p^{\prime }p^{\prime }}/\bar {p}^{2}$ at $y^{*}=2$ (figure 15b). Moreover, the $k_{x}E_{ T^{\prime }T^{\prime }}/\bar {T}^{2}$ in ‘M8T04’ and ‘M8T015’ attain their secondary peaks at ${\lambda }_{x}/\delta \approx 1.3$ and 2.3, respectively, which are also coincident with the peak locations of $k_{x}E_{ s^{\prime }s^{\prime }} ( \gamma M^{2} )^{2}$ at $y^{*}=2$ (figure 21c). These observations indicate that both the acoustic and entropic modes have significant contributions to the fluctuating temperature at $y^{*}=2$ when the wall is cooled.

Figure 32. (ac) The normalised premultiplied streamwise spectra of the fluctuating temperature $k_{x}E_{ T^{\prime }T^{\prime }}/\bar {T}^{2}$ at $y^{*}=2$ plotted against (a) ${\lambda }_{x}^{+}$, (b) ${\lambda }_{x}^{*}$ and (c) ${\lambda }_{x}/\delta$. (df) The normalised premultiplied spanwise spectra of the fluctuating temperature $k_{z}E_{ T^{\prime }T^{\prime }}/\bar {T}^{2}$ at $y^{*}=2$ plotted against (d) ${\lambda }_{z}^{+}$, (e) ${\lambda }_{z}^{*}$ and (f) ${\lambda }_{z}/\delta$.

Figure 33. (ac) The normalised premultiplied streamwise spectra of the fluctuating temperature $k_{x}E_{ T^{\prime }T^{\prime }}/\bar {T}^{2}$ at $y^{*}=5$ plotted against (a) ${\lambda }_{x}^{+}$, (b) ${\lambda }_{x}^{*}$ and (c) ${\lambda }_{x}/\delta$. (df) The normalised premultiplied spanwise spectra of the fluctuating temperature $k_{z}E_{ T^{\prime }T^{\prime }}/\bar {T}^{2}$ at $y^{*}=5$ plotted against (d) ${\lambda }_{z}^{+}$, (e) ${\lambda }_{z}^{*}$ and (f) ${\lambda }_{z}/\delta$.

At $y^{*}=5$, it is found in figure 33 that the temperature spectra in ‘M8T08’ attain their peaks at ${\lambda }_{x}^{*} \approx 450$ and ${\lambda }_{z}^{*} \approx 140$, respectively, which are consistent with the peak locations of the entropy spectra at $y^{*}=5$ in ‘M8T08’. This observation indicates that the fluctuating temperature is dominated by its entropic mode at $y^{*}=5$ in the nearly adiabatic wall case. In ‘M8T04’, the $k_{x}E_{ T^{\prime }T^{\prime }}/\bar {T}^{2}$ has a relative wide peak at $y^{*}=5$, indicating that both the acoustic and entropic modes have strong contributions to the fluctuating temperature. This observation is consistent with the fact that $T_{E,rms}^{\prime }/ (T_{E,rms}^{\prime }+T_{I,rms}^{\prime } ) \approx 0.53$ at $y^{*}=5$ in ‘M8T04’ (figure 9b). However, the behaviours of the temperature spectra in ‘M8T015’ are quite different. To be specific, the $k_{x}E_{ T^{\prime }T^{\prime }}/\bar {T}^{2}$ in ‘M8T015’ attains its primary peak at ${\lambda }_{x}/\delta \approx 2.3$, and this primary peak location represents the characteristic length scale of the SES. Furthermore, the secondary peak location of the streamwise temperature spectra is similar to that of the streamwise pressure spectra, indicating that the TAPNS also appear in the fluctuating temperature when the wall is strongly cooled. Similar to the fluctuating density, it is shown in figure 9(b) that the relative contribution $T_{E,rms}^{\prime }/ (T_{E,rms}^{\prime }+T_{I,rms}^{\prime } )$ in ‘M8T015’ also has a hump, marked by the green dashed box. This hump is mainly attributed to the strong intensity of SES near the wall in strongly cooled wall case ‘M8T015’.

5. Discussions

According to the above numerical results, some discussions are made in this section.

5.1. Discussion about the relative contributions of the acoustic and entropic modes of density and temperature

As the wall temperature decreases, the intensities of the pressure and the acoustic modes of density and temperature significantly increase. Specifically, when the wall is strongly cooled, the TAPNS appear in the pressure and the acoustic modes of density and temperature at the wall and in the vicinity of the wall.

When the wall is strongly cooled, the SES appear in the entropy and the entropic modes of density and temperature near the wall. Different from the TAPNS locating at the wall and in the vicinity of the wall, the SES are relatively weak at the wall, and have the largest intensities slightly away from the wall (such as $y^{*}\approx 5$ in ‘M8T015’). It is shown above that the intensities of the entropy and the entropic modes of density and temperature near the wall are enhanced as the wall temperature decreases, and this enhancement is mainly caused by the SES. However, the intensities of the entropy and the entropic modes of density and temperature decrease as the wall temperature decreases in the far-wall region.

As shown in figure 9, the entropic modes of density and temperature are dominant far from the wall ($y^{*}>20$). It is found above that the intensities of the pressure and the acoustic modes of density and temperature attain their peak values near the wall and then monotonically decrease away from the wall, while the intensities of the entropy and the entropic modes of density and temperature achieve their primary peaks at the edge of the boundary layer. These observations further lead to the result that the relative contributions of the entropic modes of density and temperature increase as $y^{*}$ increases among the boundary layer. Moreover, the relative contributions of the entropic modes of density and temperature at $y^{*}>20$ decrease as the wall temperature decreases, which can be ascribed to the enhancement of the pressure and the acoustic modes of density and temperature, as well as the decrement of the entropy and the entropic modes of density and temperature as the wall temperature decreases.

However, the variations of the relative contributions of the entropic modes of density and temperature are rather complicated at $y^{*}<20$. In the nearly adiabatic wall case ‘M8T08’, the intensities of the acoustic modes of density and temperature are much larger than those of the entropic modes near the wall. Therefore, the acoustic modes of density and temperature are dominant in the near-wall region. When the wall is cooled, especially in ‘M8T015’, both the TAPNS and the SES appear near the wall. The intensities of the TAPNS are weaker than those of the SES at the wall and in the vicinity of the wall. Accordingly, the relative contributions of the entropic modes of density and temperature become larger in this region as the wall temperature decreases. As $y^{*}$ further increases, the intensities of the TAPNS decrease while those of the SES increase, leading to the enhancement of the relative contributions of the entropic modes of density and temperature. At $y^{*} \approx 5$ in ‘M8T015’, the SES have the strongest intensities, resulting in the local maximum values of the relative contributions of the entropic modes of density and temperature. As $y^{*}$ further increases, the intensities of the SES decrease, giving rise to the decrease of the relative contributions of the entropic modes of density and temperature in ‘M8T015’. Therefore, the humps marked by the green dashed boxes in figure 9 are mainly attributed to the strong intensities of the SES in ‘M8T015’.

5.2. Discussion about the generating mechanism of the SES

The generating mechanism of the SES appeared near the wall in the cooled wall cases is illustrated in this subsection.

It has been shown that the vortices lead to the streaky structures of the fluctuating streamwise velocity by advecting the mean velocity gradient (Blackwelder & Eckelmann Reference Blackwelder and Eckelmann1979; Jiménez & Pinelli Reference Jiménez and Pinelli1999). Therefore, similar to the analysis of the fluctuating streamwise velocity, the quadrant analysis (Wallace Reference Wallace2016) is introduced to investigate the generating mechanism of the SES.

Based on the quadrant analysis, four quadrants are created by the fluctuating temperature and the wall-normal fluctuating velocity, and the instantaneous turbulent heat flux ${T}^{\prime }{v}^{\prime }$ located in these four quadrants are called four events (Wallace Reference Wallace2016), that is, (i) $Q_{1}, {T}'>0,\,{v}'>0$; (ii) $Q_{2}, {T}'<0,\,{v}'>0$; (iii) $Q_{3}, {T}'<0,\,{v}'<0$; (iv) $Q_{4}, {T}'>0,\,{v}'<0$. Similarly, the instantaneous turbulent entropy flux ${s}^{\prime }{v}^{\prime }$ can be divided into four events: (i) $Q_{1}, {s}'>0,\,{v}'>0$; (ii) $Q_{2}, {s}'<0,\,{v}'>0$; (iii) $Q_{3}, {s}'<0,\,{v}'<0$; (iv) $Q_{4}, {s}'>0,\,{v}'<0$. The $Q$2 and $Q$4 events represent the ejection and sweep events, which are gradient-type motions; while the $Q$1 and $Q$3 events denote the outward and inward interactions, which are countergradient-type motions (Wallace Reference Wallace2016). The $Q$2 event describes the motion that the near-wall low-temperature or low-entropy streaks rise up to the far-wall fluid, while the $Q$4 event implies that the high-temperature or high-entropy streaks in the outer layer sweep down to the near-wall fluid.

Quadrant contributions to the turbulent heat flux $\overline {{T}^{\prime }{v}^{\prime }}$ and the turbulent entropy flux $\overline {{s}^{\prime }{v}^{\prime }}$ are shown in figure 34. It is shown that in the near-wall region where the wall-normal gradient of the mean temperature $\partial \bar {T}/\partial y$ is positive (figure 2e), the $Q$2 (ejection) and $Q$4 (sweep) events give strong positive contributions to $\overline {{T}^{\prime }{v}^{\prime }}$ and $\overline {{s}^{\prime }{v}^{\prime }}$, while the $Q$1 (outward) and $Q$3 (inward) events give small negative contributions to $\overline {{T}^{\prime }{v}^{\prime }}$ and $\overline {{s}^{\prime }{v}^{\prime }}$. As the wall-normal location $y^{*}$ increases, the sharp peaks appear at the wall-normal location of the ‘turning points’ where the wall-normal gradient of the mean temperature $\partial \bar {T}/\partial y$ is zero (shown by the green circles in figure 2e). As the wall-normal location $y^{*}$ further increases, the wall-normal gradient of the mean temperature $\partial \bar {T}/\partial y$ changes from positive to negative (figure 2e). Consequently, the $Q$1 (outward) and $Q$3 (inward) events give strong positive contributions to $\overline {{T}^{\prime }{v}^{\prime }}$ and $\overline {{s}^{\prime }{v}^{\prime }}$, while the $Q$2 (ejection) and $Q$4 (sweep) events give small negative contributions to $\overline {{T}^{\prime }{v}^{\prime }}$ and $\overline {{s}^{\prime }{v}^{\prime }}$. Therefore, it can be concluded that the SES that appeared near the wall in the cooled wall cases are mainly caused by the advection effect of the strong positive wall-normal gradient of the mean temperature. When $\partial \bar {T}/\partial y >0$, the ejection and sweep events give dominant positive contributions, and lead to the SES. As the wall temperature decreases, the positive values of $\partial \bar {T}/\partial y$ become larger, and the ejection and sweep events become stronger, which further lead to the stronger SES. Furthermore, the wall-normal range of the $\partial \bar {T}/\partial y >0$ region also increases as the wall temperature decreases (figure 2e), which further leads to the larger wall-normal region where the SES exist in colder wall case.

Figure 34. (a,b) Quadrant contributions to the turbulent heat flux $\overline {{T}^{\prime }{v}^{\prime }}$ along the wall-normal direction in (a) ‘M8T015’ and (b) ‘M8T04’. (c,d) Quadrant contributions to the turbulent entropy flux $\overline {{s}^{\prime }{v}^{\prime }}$ along the wall-normal direction in (c) ‘M8T015’ and (d) ‘M8T04’. The insets shown the sharp peaks of the quadrant contributions.

5.3. Discussion about the influence of the neglect of the non-ideal gas effect

It is noted above that the non-ideal gas effect, especially the vibrational mode of temperature, is neglected in the present study. However, the vibrational temperature is relatively significant in the nearly adiabatic case (M8T08). In this subsection, the rationality of the neglect of the vibrational temperature is listed as follows.

It can be seen in figure 2(d) that the mean temperature monotonically decreases as the wall-normal location increases in M8T08. Therefore, the vibrational temperature only has a strong intensity in the near-wall region. It is found above that the intensities of the pressure and the acoustic modes of density and temperature attain their peaks near the wall. Nevertheless, the pressure and the acoustic modes of density and temperature are only related to the translational and rotational temperature (Passiatore et al. Reference Passiatore, Sciacovelli, Cinnella and Pascazio2021). Accordingly, the neglect of the vibrational temperature has a negligible effect on the behaviours of the pressure and the acoustic modes of density and temperature in the present study.

On the other hand, the intensities of the entropy and the entropic modes of density and temperature are pretty small near the wall. In Passiatore et al. (Reference Passiatore, Sciacovelli, Cinnella and Pascazio2021), the vibrational temperature was considered in the hypersonic turbulent boundary layer with an adiabatic wall. It is found that the intensity of temperature in the hypersonic turbulent boundary layer with non-ideal gas effect in Passiatore et al. (Reference Passiatore, Sciacovelli, Cinnella and Pascazio2021) has similar behaviours with that under the ideal gas assumption in the present study. The intensity of temperature is relatively weak near the wall even when the vibrational temperature is considered (Passiatore et al. Reference Passiatore, Sciacovelli, Cinnella and Pascazio2021). Furthermore, it is shown in § 5.2 that the positive wall-normal gradient of the mean temperature $\partial \bar {T}/\partial y$ gives rise to the SES of the entropy and the entropic modes of density and temperature. It is found in Passiatore et al. (Reference Passiatore, Sciacovelli, Cinnella and Pascazio2021) that $\partial \bar {T}/\partial y$ is almost zero near the wall in the hypersonic turbulent boundary layer with non-ideal gas effect. It can be inferred that the SES of the entropy and the entropic modes of density and temperature do not appear in the hypersonic turbulent boundary layer with non-ideal gas effect. Therefore, the neglect of the vibrational temperature has a weak effect on the qualitative properties of the entropy and the entropic modes of density and temperature in the present study.

6. Summary and conclusion

In this paper, the wall cooling effect on the spectra and structures of the thermodynamic variables is systematically investigated in hypersonic turbulent boundary layers by DNSs. The turbulent intensities and the streamwise and spanwise spectra of the fluctuating streamwise velocity and thermodynamic variables, including the density, temperature, pressure and entropy, are meticulously studied. It is found that the wall cooling effect has a significantly larger influence on the thermodynamic variables compared with the fluctuating streamwise velocity, which leads to a great challenge to the accurate modelling of the thermodynamic variables.

The fluctuating density and temperature can be divided into the acoustic and entropic modes based on the Kovasznay decomposition. The fluctuating pressure is positively linearly correlated with the acoustic modes of density and temperature with $R ( \rho _{I} ^{\prime },p^{\prime } )=1$ and $R ( \rho _{I} ^{\prime },T_{I}^{\prime } )=1$. Furthermore, the entropic mode of density is almost negatively linearly correlated with the fluctuating entropy and the entropic mode of temperature with $R ( \rho _{E} ^{\prime },T_{E}^{\prime } ) \approx -1$ and $R ( \rho _{E} ^{\prime },s^{\prime } ) \approx -1$.

It is found that the intensities of the fluctuating pressure and the acoustic modes of density and temperature are significantly enhanced as the wall temperature decreases, especially at the wall and in the vicinity of the wall. When the wall is cooled, the TAPNS appear at the wall and in the vicinity of the wall. These TAPNS give rise to the fact that the intensities of the pressure and the acoustic modes of density and temperature in the cooled wall cases (i.e. ‘M8T04’ and ‘M8T015’) achieve their primary peaks at the wall. The TAPNS are short and fat (i.e. ${\lambda }_{x}^{*}<{\lambda }_{z}^{*}$). As the wall temperature decreases, the intensities and the characteristic streamwise length and spanwise spacing scales of the TAPNS increase, and the wall-normal range where the TAPNS exist also increases.

It is also shown that the entropy and the entropic modes of density and temperature achieve their primary peaks near the edge of the boundary layer. Furthermore, as the wall temperature decreases, the intensities of the entropy and the entropic modes of density and temperature decrease far from the wall, while are significantly enhanced in the near-wall region. The enhancement of the intensities of the entropy and the entropic modes of density and temperature near the wall in the cooled wall cases can be attributed to the appearance of the SES. Specifically, the interesting phenomena are observed in figures 6(a)–6(c) that the $s_{rms}^{\prime }\gamma M^{2}$, $\rho _{rms}^{\prime }/\bar {\rho }$ and $T_{rms}^{\prime }/\bar {T}$ in ‘M8T015’ have local secondary peaks at $y^{*}=5$, and these phenomena are mainly due to the strong intensities of the SES. The SES are long and thin (i.e. ${\lambda }_{x}/\delta \gg {\lambda }_{z}/\delta$). As the wall temperature decreases, the intensities and the characteristic streamwise length and spanwise spacing scales of the SES are enhanced, and the wall-normal range where the SES exist also increases.

It is shown in figures 6(a)–6(c) that the profiles of $s_{rms}^{\prime }\gamma M^{2}$, $\rho _{rms}^{\prime }/\bar {\rho }$ and $T_{rms}^{\prime }/\bar {T}$ are similar to each other, which are mainly due to the observation that the density and temperature are dominated by their entropic modes far from the wall ($y^{*}>20$). Moreover, the relative contributions of the entropic modes become weaker as the wall temperature decreases. However, in the near-wall region $y^{*}<20$, the wall temperature has a significant effect on the relative contributions of the entropic modes of density and temperature. When the wall is nearly adiabatic (i.e. ‘M8T08’), the acoustic modes of density and temperature are dominant in the vicinity of the wall. When the wall is cooled, the intensities of SES are larger than those of TAPNS, which further result in the enhancement of the relative contributions of the entropic modes of density and temperature near the wall.

Furthermore, the quadrant analysis shows that SES are mainly caused by the advection effect of the strong positive wall-normal gradient of the mean temperature associated with ejection and sweep events. As the wall temperature decreases, the magnitudes and the wall-normal range of the positive $\partial \bar {T}/\partial y$ significantly increase, which further leads to the stronger intensities and larger wall-normal range of SES.

The observations in the present study can be used to explain many interesting phenomena observed in the previous studies. For example, when the wall is strongly cooled, the primary peak of the intensity of pressure near the wall (figure 5) can be attributed to the TAPNS of the pressure, while the secondary peak of the intensity of entropy in the near-wall region (figure 6) can be ascribed to the SES of the entropy. Similarly, the secondary peaks of the intensities of density and temperature near the wall (figure 6) are due to the appearance of the TAPNS of the acoustic modes as well as the SES of the entropic modes of density and temperature. Furthermore, based on the SRA, the fluctuating streamwise velocity is negatively correlated with the fluctuating temperature far from the wall. However, when the wall is strongly cooled, the fluctuating streamwise velocity is positively correlated with the fluctuating temperature near the wall, and the positive correlation becomes stronger as the wall temperature decreases (Duan et al. Reference Duan, Beekman and Martin2010; Xu et al. Reference Xu, Wang, Wan, Yu, Li and Chen2021a; Huang et al. Reference Huang, Duan and Choudhari2022). This abnormal positive correlation in the near-wall region can be explained based on the observations in this paper: It is found in Xu et al. (Reference Xu, Wang, Wan, Yu, Li and Chen2021a) that the TAPNS appear in the dilatational component of the fluctuating streamwise velocity, and the high- and low-momentum streaky structures appear in the solenoidal component of the fluctuating streamwise velocity near the wall. In the cold wall case, the TAPNS appear in the acoustic mode of temperature in the near-wall region, which are similar to the TAPNS of the dilatational component of streamwise velocity; the SES appear in the entropic mode of temperature near the wall, which are similar to the streaky structures of the solenoidal component of streamwise velocity. The intensities of the TAPNS and the SES of the acoustic and entropic modes of temperature, respectively, are significantly enhanced as the wall temperature decreases, which further give rise to the stronger positive correlation between the fluctuating streamwise velocity and the fluctuating temperature.

The observations in this paper can also give a valuable a priori knowledge and guidance in constructing accurate models. When the wall is strongly cooled, the turbulent structures are highly modulated by the mean property gradients near the wall. Therefore, it is a big challenge to give accurate predictive models for the near-wall temperature fluctuation due to the invalidity of the SRA in the hypersonic turbulent boundary layer with a cold wall (Yu & Xu Reference Yu and Xu2022). Similar challenges also exist in giving accurate wall models for the wall heat flux (Chen et al. Reference Chen, Lv, Xu, Shi and Yang2022) as well as the accurate subgrid-scale (SGS) models for the SGS heat flux. Furthermore, the strong wall-normal gradient of the temperature results in the strong wall heat flux when the wall is cooled. An efficient heat reduction method is of great importance in supersonic and hypersonic aircraft. It is found that the SES of the entropic mode of temperature is mainly due to the advection effect of the strong positive wall-normal gradient of the mean temperature associated with ejection and sweep events in this paper, which has a similar generating mechanism with the high- and low-momentum streaky structures of the streamwise velocity. This observation is helpful for designing an efficient heat reduction method in the hypersonic turbulent boundary layer with a cold wall.

In conclusion, the wall cooling effect on the multiscale properties of the thermodynamic variables in hypersonic boundary layers is systematically investigated. Two special structures, TAPNS and SES, are observed in the near-wall region when the wall is cooled, and should be specially considered in the accurate modelling of the thermodynamic variables.

Funding

This work was supported by the NSFC Basic Science Center Program (grant no. 11988102), by the National Natural Science Foundation of China (NSFC grant nos. 91952104, 92052301, 12172161 and 91752201), by the Technology and Innovation Commission of Shenzhen Municipality (grant nos. KQTD20180411143441009 and JCYJ20170412151759222) and by the Department of Science and Technology of Guangdong Province (grant no. 2019B21203001). This work was also supported by the Center for Computational Science and Engineering of Southern University of Science and Technology.

Declaration of interests

The authors report no conflict of interest.

Appendix A. Validation of the DNS cases

In this appendix, the DNS cases in this study are validated via comparisons with the available DNS database in Zhang et al. (Reference Zhang, Duan and Choudhari2018).

It is noted that the van Driest transformed mean velocity $U^{+}_{VD}$ is defined as (Van Driest Reference Van Driest1951)

(A1)\begin{equation} U^{+}_{VD}=\int_{0}^{U^{+}}\left ( \bar{\rho }/\bar{\rho }_{w} \right )^{1/2}\,{\rm d}U^{+}, \end{equation}

where $U^{+}=U/u_{\tau }$, and $U$ is the mean streamwise velocity. The comparisons of the wall-normal grid spacing $\Delta y^{+}$, the van Driest transformed mean velocity $U^{+}_{VD}$, the intensities of the streamwise, wall-normal, spanwise fluctuating velocities and the Reynolds shear stress between the DNS cases in this study and the DNS database in Zhang et al. (Reference Zhang, Duan and Choudhari2018) are shown in figure 35.

Figure 35. The comparisons between the DNS cases in this study and the DNS database in Zhang et al. (Reference Zhang, Duan and Choudhari2018): (a) the wall-normal grid spacing $\Delta y^{+}$, (b) the van Driest transformed mean velocity $U^{+}_{VD}$, (c) the intensities of the streamwise fluctuating velocity $u_{rms}^{\prime }/u_{\tau }^{*}$, (d) the intensities of the wall-normal fluctuating velocity $v_{rms}^{\prime }/u_{\tau }^{*}$, (e) the intensities of the spanwise fluctuating velocity $w_{rms}^{\prime }/u_{\tau }^{*}$, (f) the Reynolds shear stress $- \langle u^{\prime }v^{\prime } \rangle /{u^{*}}^{2}$.

It is found in figure 35(a) that the wall-normal grid spacings $\Delta y^{+}$ in the DNS cases are smaller than those of the DNS database in Zhang et al. (Reference Zhang, Duan and Choudhari2018) at $y/\delta < 0.8$, and $\Delta y^{+} \approx 6$ at $y/\delta =1.0$, indicating that the wall-normal resolutions of the DNS cases in this study are fine enough. Furthermore, it is shown in figures 35(b)–35(f) that the profiles of $U^{+}_{VD}$, $u_{rms}^{\prime }/u_{\tau }^{*}$, $v_{rms}^{\prime }/u_{\tau }^{*}$, $w_{rms}^{\prime }/u_{\tau }^{*}$ and $- \langle u^{\prime }v^{\prime } \rangle /{u^{*}}^{2}$ in ‘M8T04’ are similar to those in ‘M8Tw048’ in Zhang et al. (Reference Zhang, Duan and Choudhari2018). When the wall is strongly cooled, the van Driest transformed mean velocity, the intensities of the fluctuating velocities and the Reynolds shear stress in ‘M8T015’ have similar behaviours to those in ‘M14Tw018’ in Zhang et al. (Reference Zhang, Duan and Choudhari2018). These observations validate the accuracy of the DNS cases in this study.

References

Balsara, D.S. & Shu, C. 2000 Monotonicity preserving weighted essentially non-oscillatory schemes with increasingly high order of accuracy. J. Comput. Phys. 160, 405452.CrossRefGoogle Scholar
Blackwelder, R.F. & Eckelmann, H. 1979 Streamwise vortices associated with the bursting phenomenon. J. Fluid Mech. 94, 577594.CrossRefGoogle Scholar
Chassaing, P., Antoniz, R., Anselmet, F., Joly, L. & Sarkar, S. 2002 Variable Density Fluid Turbulence, Fluid Mechanics and its Applications. Kluwer.CrossRefGoogle Scholar
Chen, P., Lv, Y., Xu, H., Shi, Y. & Yang, X. 2022 Les wall modeling for heat transfer at high speeds. Phys. Rev. Fluids 7, 014608.CrossRefGoogle Scholar
Chu, Y., Zhuang, Y. & Lu, X. 2013 Effect of wall temperature on hypersonic turbulent boundary layer. J. Turbul. 14, 3757.CrossRefGoogle Scholar
Cogo, M., Salvadore, F., Picano, F. & Bernardini, M. 2022 Direct numerical simulation of supersonic and hypersonic turbulent boundary layers at moderate-high Reynolds numbers and isothermal wall condition. J. Fluid Mech. 945, A30.CrossRefGoogle Scholar
Dang, G., Liu, S., Guo, T., Duan, J. & Li, X. 2022 Direct numerical simulation of compressible turbulence accelerated by graphics processing unit: an open-source high accuracy accelerated computational fluid dynamic software. Phys. Fluids 34, 126106.CrossRefGoogle Scholar
Duan, L., Beekman, I. & Martin, M.P. 2010 Direct numerical simulation of hypersonic turbulent boundary layers. Part 2. Effect of wall temperature. J. Fluid Mech. 655, 419445.CrossRefGoogle Scholar
Duan, L., Beekman, I. & Martin, M.P. 2011 Direct numerical simulation of hypersonic turbulent boundary layers. Part 3. Effect of Mach number. J. Fluid Mech. 672, 245267.CrossRefGoogle Scholar
Duan, L., Choudhari, M.M. & Zhang, C. 2016 Pressure fluctuations induced by a hypersonic turbulent boundary layer. J. Fluid Mech. 804, 578607.CrossRefGoogle ScholarPubMed
Gatski, T.B. & Bonnet, J.P. 2009 Compressibility, Turbulence and High Speed Flow. Elsevier.Google Scholar
Gauthier, S. 2017 Compressible Rayleigh–Taylor turbulent mixing layer between Newtonian miscible fluids. J. Fluid Mech. 830, 211256.CrossRefGoogle Scholar
Gerolymos, G.A. & Vallet, I. 2014 Pressure, density, temperature and entropy fluctuations in compressible turbulent plane channel flow. J. Fluid Mech. 757, 701746.CrossRefGoogle Scholar
Huang, J., Duan, L. & Choudhari, M. 2022 Direct numerical simulation of hypersonic turbulent boundary layers: effect of spatial evolution and Reynolds number. J. Fluid Mech. 937, A3.CrossRefGoogle Scholar
Huang, P., Coleman, G. & Bradshaw, P. 1995 Compressible turbulent channel flows: DNS results and modelling. J. Fluid Mech. 305, 185218.CrossRefGoogle Scholar
Hutchins, N. & Marusic, I. 2007 a Evidence of very long meandering features in the logarithmic region of turbulent boundary layers. J. Fluid Mech. 579, 128.CrossRefGoogle Scholar
Hutchins, N. & Marusic, I. 2007 b Large-scale influences in near-wall turbulence. Phil. Trans. R. Soc. Lond. A 365, 647664.Google ScholarPubMed
Hwang, Y. 2016 Mesolayer of attached eddies in turbulent channel flow. Phys. Rev. Fluids 1, 064401.CrossRefGoogle Scholar
Jameson, A., Schmidt, W. & Turkel, E. 1981 Numerical solution of the Euler equations by finite volume methods using Runge Kutta time stepping schemes. In 14th Fluid and Plasma Dynamics Conference (AIAA, 1981), p. 1259. American Institute of Aeronautics and Astronautics.CrossRefGoogle Scholar
Jiménez, J. 2013 Near-wall turbulence. Phys. Fluids 25, 101302.CrossRefGoogle Scholar
Jiménez, J. & Pinelli, A. 1999 The autonomous cycle of near-wall turbulence. J. Fluid Mech. 389, 335359.CrossRefGoogle Scholar
Kovasznay, L.S.G. 1953 Turbulence in supersonic flow. J. Aeronaut. Sci. 20, 657674.CrossRefGoogle Scholar
Lagha, M., Kim, J., Eldredge, J.D. & Zhong, X. 2011 A numerical study of compressible turbulent boundary layers. Phys. Fluids 23, 015106.CrossRefGoogle Scholar
Liang, X. & Li, X. 2015 Direct numerical simulation on Mach number and wall temperature effects in the turbulent flows of flat-plate boundary layer. Commun. Comput. Phys. 17, 189212.CrossRefGoogle Scholar
Monty, J., Hutchins, N., Ng, H.C.H., Marusic, I. & Chong, M.S. 2009 A comparison of turbulent pipe, channel and boundary layer flows. J. Fluid Mech. 632, 431442.CrossRefGoogle Scholar
Passiatore, D., Sciacovelli, L., Cinnella, P. & Pascazio, G. 2021 Finite-rate chemistry effects in turbulent hypersonic boundary layers: a direct numerical simulation study. Phys. Rev. Fluids 6, 054604.CrossRefGoogle Scholar
Pirozzoli, S. & Bernardini, M. 2011 Turbulence in supersonic boundary layers at moderate Reynolds number. J. Fluid Mech. 688, 120168.CrossRefGoogle Scholar
Pirozzoli, S. & Bernardini, M. 2013 Probing high-Reynolds-number effects in numerical boundary layers. Phys. Fluids 25, 021704.CrossRefGoogle Scholar
Pirozzoli, S., Grasso, F. & Gatski, T.B. 2004 Direct numerical simulation and analysis of a spatially evolving supersonic turbulent boundary layer at $M=2.25$. Phys. Fluids 16, 530545.CrossRefGoogle Scholar
Ritos, K., Drikakis, D. & Kokkinakis, I.W. 2019 Acoustic loading beneath hypersonic transitional and turbulent boundary layers. J. Sound Vib. 441, 5062.CrossRefGoogle Scholar
Shu, C.-W. & Osher, S. 1988 Efficient implementation of essentially non-oscillatory shock-capturing schemes. J. Comput. Phys. 77 (2), 439471.CrossRefGoogle Scholar
Smits, A.J. & Dussauge, J.P. 2006 Turbulent Shear Layers in Supersonic Flow. Springer.Google Scholar
Tang, J., Zhao, Z., Wan, Z. & Liu, N. 2020 On the near-wall structures and statistics of fluctuating pressure in compressible turbulent channel flows. Phys. Fluids 32, 115121.CrossRefGoogle Scholar
Van Driest, E.R. 1951 Turbulent boundary layer in compressible fluids. J. Aeronaut. Sci. 18 (3), 145160.CrossRefGoogle Scholar
Wallace, J.M. 2016 Quadrant analysis in turbulence research: history and evolution. Annu. Rev. Fluid Mech. 48, 131158.CrossRefGoogle Scholar
Wang, J., Wan, M., Chen, S., Xie, C., Wang, L. & Chen, S. 2019 Cascades of temperature and entropy fluctuations in compressible turbulence. J. Fluid Mech. 867, 195215.CrossRefGoogle Scholar
Xu, D., Wang, J. & Chen, S. 2022 a Skin-friction and heat-transfer decompositions in hypersonic transitional and turbulent boundary layers. J. Fluid Mech. 941, A4.CrossRefGoogle Scholar
Xu, D., Wang, J., Wan, M., Yu, C., Li, X. & Chen, S. 2021 a Compressibility effect in hypersonic boundary layer with isothermal wall condition. Phys. Rev. Fluids 6, 054609.CrossRefGoogle Scholar
Xu, D., Wang, J., Wan, M., Yu, C., Li, X. & Chen, S. 2021 b Effect of wall temperature on the kinetic energy transfer in hypersonic turbulent boundary layer. J. Fluid Mech. 929, A33.CrossRefGoogle Scholar
Xu, D., Wang, J., Yu, C., Li, X. & Chen, S. 2022 b Contribution of flow topology to the kinetic energy flux in hypersonic turbulent boundary layer. Phys. Fluids 34, 046103.CrossRefGoogle Scholar
Xu, D., Wang, J., Yu, C., Li, X. & Chen, S. 2022 c Effect of compressibility on the small-scale structures in hypersonic turbulent boundary layer. Phys. Fluids 34, 055121.CrossRefGoogle Scholar
Yu, M. & Xu, C. 2022 Predictive models for near-wall velocity and temperature fluctuations in supersonic wall-bounded turbulence. J. Fluid Mech. 937, A32.CrossRefGoogle Scholar
Yu, M., Xu, C. & Pirozzoli, S. 2019 Genuine compressibility effects in wall-bounded turbulence. Phys. Rev. Fluids 4, 123402.CrossRefGoogle Scholar
Zhang, C., Duan, L. & Choudhari, M. 2018 Direct numerical simulation database for supersonic and hypersonic turbulent boundary layers. AIAA J. 56, 42974311.CrossRefGoogle Scholar
Zhang, C., Duan, L. & Choudhari, M.M. 2017 Effect of wall cooling on boundary-layer-induced pressure fluctuations at Mach 6. J. Fluid Mech. 822, 530.CrossRefGoogle Scholar
Zhang, P., Wan, Z., Liu, N., Sun, D. & Lu, X. 2022 Wall-cooling effects on pressure fluctuations in compressible turbulent boundary layers from subsonic to hypersonic regimes. J. Fluid Mech. 946, A14.CrossRefGoogle Scholar
Figure 0

Figure 1. The schematic of the hypersonic transitional and turbulent boundary layers.

Figure 1

Table 1. Summary of computational parameters for the three DNS database at Mach number eight with different wall temperatures.

Figure 2

Table 2. The fundamental parameters of the three sets of data.

Figure 3

Figure 2. (ac) The mean density profile along the wall-normal direction plotted against (a) wall unit scaling ($\,y^{+}$), (b) semilocal scaling ($\,y^{*}$) and (c) outer scaling ($\,y/\delta$). (df) The mean temperature profile along the wall-normal direction plotted against (d) wall unit scaling ($\,y^{+}$), (e) semilocal scaling ($\,y^{*}$) and (f) outer scaling ($\,y/\delta$). Here the ‘turning points’ marked by the green circles represent the minimum values of the mean density in (ac), and the maximum values of the mean temperature in (df).

Figure 4

Figure 3. (ac) The turbulent Mach number $M_{t}$ along the wall-normal direction plotted against (a) wall unit scaling ($\,y^{+}$), (b) semilocal scaling ($\,y^{*}$) and (c) outer scaling ($\,y/\delta$). The vertical dashed line represents $y^{*}=19$ in (b). (df) The r.m.s. values of the local Mach number ${M}'_{rms}$ along the wall-normal direction plotted against (d) wall unit scaling ($\,y^{+}$), (e) semilocal scaling ($\,y^{*}$) and (f) outer scaling ($\,y/\delta$). The vertical dashed line represents $y^{*}=15$ in (e).

Figure 5

Figure 4. The normalised turbulent intensity of the streamwise velocity $u_{rms}^{\prime \prime }/u_{\tau }^{*}$ plotted against (a) semilocal scaling ($\,y^{*}$) and (b) outer scaling ($\,y/\delta$). The vertical dashed line represents $y^{*}=18$ in (a).

Figure 6

Figure 5. The normalised turbulent intensity of the pressure $p_{rms}^{\prime }/\bar {p}$ plotted against (a) semilocal scaling ($\,y^{*}$) and (b) outer scaling ($\,y/\delta$). The vertical dashed lines represent $y^{*}=2, 5, 60$ in (a).

Figure 7

Figure 6. (a,d) The normalised turbulent intensity of the entropy $s_{rms}^{\prime }\gamma M^{2}$ along the wall-normal direction against (a) semilocal scaling ($\,y^{*}$) and (d) outer scaling ($\,y/\delta$). The vertical dashed lines represent $y^{*}=2, 5, 50$ in (a) and $y/\delta =0.7$ in (d), respectively. (b,e) The normalised turbulent intensity of the density $\rho _{rms}^{\prime }/\bar {\rho }$ along the wall-normal direction against (b) semilocal scaling ($\,y^{*}$) and (e) outer scaling ($\,y/\delta$). The vertical dashed lines represent $y^{*}=2$, 5, 40 in (b) and $y/\delta =0.6$ in (e), respectively. (c,f) The normalised turbulent intensity of the temperature $T_{rms}^{\prime }/\bar {T}$ along the wall-normal direction against (c) semilocal scaling ($\,y^{*}$) and (f) outer scaling ($\,y/\delta$). The vertical dashed lines represent $y^{*}=2$, 5, 50 in (c) and $y/\delta =0.8$ in (f), respectively.

Figure 8

Figure 7. The correlation coefficients (a) $R ( \rho _{I} ^{\prime },T_{I}^{\prime } )$, (b) $R ( \rho _{I} ^{\prime },p^{\prime } )$, (c) $R ( \rho _{E} ^{\prime },T_{E}^{\prime } )$ and (d) $R ( \rho _{E} ^{\prime },s^{\prime } )$ along the wall-normal direction plotted against semilocal scaling ($\,y^{*}$).

Figure 9

Figure 8. (a,b) The normalised turbulent intensity of (a) the acoustic mode of density $\rho _{I,rms}^{\prime }/\bar {\rho }$ and (b) the entropic mode of density $\rho _{E,rms}^{\prime }/\bar {\rho }$ along the wall-normal direction. (c,d) The normalised turbulent intensity of (c) the acoustic mode of temperature $T_{I,rms}^{\prime }/\bar {T}$ and (d) the entropic mode of temperature $T_{E,rms}^{\prime }/\bar {T}$ along the wall-normal direction.

Figure 10

Figure 9. The relative contributions (a) $\rho _{E,rms}^{\prime }/ (\rho _{E,rms}^{\prime }+ \rho _{I,rms}^{\prime } )$ and (b) $T_{E,rms}^{\prime }/ (T_{E,rms}^{\prime }+T_{I,rms}^{\prime } )$ along the wall-normal direction. The vertical dashed lines represent $y^{*}=2, 5$ in (a,b).

Figure 11

Figure 10. (a,b) The normalised premultiplied streamwise spectra of the fluctuating streamwise velocity $k_{x}E_{\rho u^{\prime \prime }u^{\prime \prime }}/ (\bar {\rho }{u_{\tau }^{*}}^{2} )$ in (a) inner scaling and (b) outer scaling. (c,d) The normalised premultiplied spanwise spectra of the fluctuating streamwise velocity $k_{z}E_{\rho u^{\prime \prime }u^{\prime \prime }}/ (\bar {\rho }{u_{\tau }^{*}}^{2} )$ in (c) inner scaling and (d) outer scaling. The filled contour represents the normalised premultiplied spectra in ‘M8T08’. The line contour levels are (0.2, 0.4, 0.6, 0.8) times the peak values. The horizontal dashed lines represent $y^{*}=18$ in (a,c) and $y/\delta =0.2$ in (b,d), respectively.

Figure 12

Figure 11. (a,b) The normalised premultiplied streamwise spectra of the fluctuating streamwise velocity $k_{x}E_{\rho u^{\prime \prime }u^{\prime \prime }}/ (\bar {\rho }{u_{\tau }^{*}}^{2} )$ at $y^{*}=18$ plotted against (a) ${\lambda }_{x}^{+}$ and (b) ${\lambda }_{x}^{*}$. (c,d) The normalised premultiplied spanwise spectra of the fluctuating streamwise velocity $k_{z}E_{\rho u^{\prime \prime }u^{\prime \prime }}/ (\bar {\rho }{u_{\tau }^{*}}^{2} )$ at $y^{*}=18$ plotted against (c) ${\lambda }_{z}^{+}$ and (d) ${\lambda }_{z}^{*}$.

Figure 13

Figure 12. (a) The normalised premultiplied streamwise spectra of the fluctuating streamwise velocity $k_{x}E_{\rho u^{\prime \prime }u^{\prime \prime }}/ (\bar {\rho }{u_{\tau }^{*}}^{2} )$ at $y/\delta =0.2$ plotted against ${\lambda }_{x}/\delta$. (b) The normalised premultiplied spanwise spectra of the fluctuating streamwise velocity $k_{z}E_{\rho u^{\prime \prime }u^{\prime \prime }}/ (\bar {\rho }{u_{\tau }^{*}}^{2} )$ at $y/\delta =0.2$ plotted against ${\lambda }_{z}/\delta$.

Figure 14

Figure 13. (a,b) The normalised premultiplied streamwise spectra of the fluctuating pressure $k_{x}E_{ p^{\prime }p^{\prime }}/\bar {p}^{2}$ in (a) inner scaling and (b) outer scaling. (c,d) The normalised premultiplied spanwise spectra of the fluctuating pressure $k_{z}E_{ p^{\prime }p^{\prime }}/\bar {p}^{2}$ in (c) inner scaling and (d) outer scaling. The filled contour represents the normalised premultiplied spectra in ‘M8T08’. The line contour levels are (0.2, 0.4, 0.6, 0.8) times the peak values. The horizontal dashed lines represent $y^{*}=2, 5, 60$ in (a,c).

Figure 15

Figure 14. (a,b) The normalised premultiplied streamwise spectra of the fluctuating pressure $k_{x}E_{ p^{\prime }p^{\prime }}/\bar {p}^{2}$ at $y^{*}=60$ plotted against (a) ${\lambda }_{x}^{+}$ and (b) ${\lambda }_{x}^{*}$. (c,d) The normalised premultiplied spanwise spectra of the fluctuating pressure $k_{z}E_{ p^{\prime }p^{\prime }}/\bar {p}^{2}$ at $y^{*}=60$ plotted against (c) ${\lambda }_{z}^{+}$ and (d) ${\lambda }_{z}^{*}$.

Figure 16

Figure 15. (a,b) The normalised premultiplied streamwise spectra of the fluctuating pressure $k_{x}E_{ p^{\prime }p^{\prime }}/\bar {p}^{2}$ at $y^{*}=2$ plotted against (a) ${\lambda }_{x}^{+}$ and (b) ${\lambda }_{x}^{*}$. (c,d) The normalised premultiplied spanwise spectra of the fluctuating pressure $k_{z}E_{ p^{\prime }p^{\prime }}/\bar {p}^{2}$ at $y^{*}=2$ plotted against (c) ${\lambda }_{z}^{+}$ and (d) ${\lambda }_{z}^{*}$.

Figure 17

Figure 16. (a,b) The normalised premultiplied streamwise spectra of the fluctuating pressure $k_{x}E_{ p^{\prime }p^{\prime }}/\bar {p}^{2}$ at $y^{*}=5$ plotted against (a) ${\lambda }_{x}^{+}$ and (b) ${\lambda }_{x}^{*}$. (c,d) The normalised premultiplied spanwise spectra of the fluctuating pressure $k_{z}E_{ p^{\prime }p^{\prime }}/\bar {p}^{2}$ at $y^{*}=5$ plotted against (c) ${\lambda }_{z}^{+}$ and (d) ${\lambda }_{z}^{*}$.

Figure 18

Figure 17. The instantaneous fields of the normalised fluctuating pressure $p^{\prime }/\bar {p}$ at $y^{*}=2$ in (a) ‘M8T015’, (b) ‘M8T04’ and (c) ‘M8T08’.

Figure 19

Figure 18. (a,b) The normalised premultiplied streamwise spectra of the fluctuating entropy $k_{x}E_{ s^{\prime }s^{\prime }} ( \gamma M^{2} )^{2}$ in (a) inner scaling and (b) outer scaling. (c,d) The normalised premultiplied spanwise spectra of the fluctuating entropy $k_{z}E_{ s^{\prime }s^{\prime }} ( \gamma M^{2} )^{2}$ in (c) inner scaling and (d) outer scaling. The filled contour represents the normalised premultiplied spectra in ‘M8T08’. The line contour levels are (0.2, 0.4, 0.6, 0.8) times the peak values. The horizontal dashed lines represent $y^{*}=2, 5, 50$ in (a,c) and $y/\delta =0.7$ in (b,d), respectively.

Figure 20

Figure 19. (a) The normalised premultiplied streamwise spectra of the fluctuating entropy $k_{x}E_{ s^{\prime }s^{\prime }} ( \gamma M^{2} )^{2}$ at $y/\delta =0.7$ plotted against ${\lambda }_{x}/\delta$. (b) The normalised premultiplied spanwise spectra of the fluctuating entropy $k_{z}E_{ s^{\prime }s^{\prime }} ( \gamma M^{2} )^{2}$ at $y/\delta =0.7$ plotted against ${\lambda }_{z}/\delta$.

Figure 21

Figure 20. (a,b) The normalised premultiplied streamwise spectra of the fluctuating entropy $k_{x}E_{ s^{\prime }s^{\prime }} ( \gamma M^{2} )^{2}$ at $y^{*}=50$ plotted against (a) ${\lambda }_{x}^{+}$ and (b) ${\lambda }_{x}^{*}$. (c,d) The normalised premultiplied spanwise spectra of the fluctuating entropy $k_{z}E_{ s^{\prime }s^{\prime }} ( \gamma M^{2} )^{2}$ at $y^{*}=50$ plotted against (c) ${\lambda }_{z}^{+}$ and (d) ${\lambda }_{z}^{*}$.

Figure 22

Figure 21. (ac) The normalised premultiplied streamwise spectra of the fluctuating entropy $k_{x}E_{ s^{\prime }s^{\prime }} ( \gamma M^{2} )^{2}$ at $y^{*}=2$ plotted against (a) ${\lambda }_{x}^{+}$, (b) ${\lambda }_{x}^{*}$ and (c) ${\lambda }_{x}/\delta$. (df) The normalised premultiplied spanwise spectra of the fluctuating entropy $k_{z}E_{ s^{\prime }s^{\prime }} ( \gamma M^{2} )^{2}$ at $y^{*}=2$ plotted against (d) ${\lambda }_{z}^{+}$, (e) ${\lambda }_{z}^{*}$ and (f) ${\lambda }_{z}/\delta$.

Figure 23

Figure 22. (ac) The normalised premultiplied streamwise spectra of the fluctuating entropy $k_{x}E_{ s^{\prime }s^{\prime }} ( \gamma M^{2} )^{2}$ at $y^{*}=5$ plotted against (a) ${\lambda }_{x}^{+}$, (b) ${\lambda }_{x}^{*}$ and (c) ${\lambda }_{x}/\delta$. (df) The normalised premultiplied spanwise spectra of the fluctuating entropy $k_{z}E_{ s^{\prime }s^{\prime }} ( \gamma M^{2} )^{2}$ at $y^{*}=5$ plotted against (d) ${\lambda }_{z}^{+}$, (e) ${\lambda }_{z}^{*}$ and (f) ${\lambda }_{z}/\delta$.

Figure 24

Figure 23. The instantaneous fields of the normalised fluctuating entropy $s^{\prime }\gamma M^{2}$ at $y^{*}=2$ in (a) ‘M8T015’, (b) ‘M8T04’ and (c) ‘M8T08’.

Figure 25

Figure 24. (a,b) The normalised premultiplied streamwise spectra of the fluctuating density $k_{x}E_{ \rho ^{\prime }\rho ^{\prime }}/\bar {\rho }^{2}$ in (a) inner scaling and (b) outer scaling. (c,d) The normalised premultiplied spanwise spectra of the fluctuating density $k_{z}E_{ \rho ^{\prime }\rho ^{\prime }}/\bar {\rho }^{2}$ in (c) inner scaling and (d) outer scaling. The filled contour represents the normalised premultiplied spectra in ‘M8T08’. The line contour levels are (0.2, 0.4, 0.6, 0.8) times the peak values. The horizontal dashed lines represent $y^{*}=2, 5, 40$ in (a,c) and $y/\delta =0.6$ in (b,d), respectively.

Figure 26

Figure 25. (a) The normalised premultiplied streamwise spectra of the fluctuating density $k_{x}E_{ \rho ^{\prime }\rho ^{\prime }}/\bar {\rho }^{2}$ at $y/\delta =0.6$ plotted against ${\lambda }_{x}/\delta$. (b) The normalised premultiplied spanwise spectra of the fluctuating density $k_{z}E_{ \rho ^{\prime }\rho ^{\prime }}/\bar {\rho }^{2}$ at $y/\delta =0.6$ plotted against ${\lambda }_{z}/\delta$.

Figure 27

Figure 26. (a,b) The normalised premultiplied streamwise spectra of the fluctuating density $k_{x}E_{ \rho ^{\prime }\rho ^{\prime }}/\bar {\rho }^{2}$ at $y^{*}=40$ plotted against (a) ${\lambda }_{x}^{+}$ and (b) ${\lambda }_{x}^{*}$. (c,d) The normalised premultiplied spanwise spectra of the fluctuating density $k_{z}E_{ \rho ^{\prime }\rho ^{\prime }}/\bar {\rho }^{2}$ at $y^{*}=40$ plotted against (c) ${\lambda }_{z}^{+}$ and (d) ${\lambda }_{z}^{*}$.

Figure 28

Figure 27. (ac) The normalised premultiplied streamwise spectra of the fluctuating density $k_{x}E_{ \rho ^{\prime }\rho ^{\prime }}/\bar {\rho }^{2}$ at $y^{*}=2$ plotted against (a) ${\lambda }_{x}^{+}$, (b) ${\lambda }_{x}^{*}$ and (c) ${\lambda }_{x}/\delta$. (df) The normalised premultiplied spanwise spectra of the fluctuating density $k_{z}E_{ \rho ^{\prime }\rho ^{\prime }}/\bar {\rho }^{2}$ at $y^{*}=2$ plotted against (d) ${\lambda }_{z}^{+}$, (e) ${\lambda }_{z}^{*}$ and (f) ${\lambda }_{z}/\delta$.

Figure 29

Figure 28. (ac) The normalised premultiplied streamwise spectra of the fluctuating density $k_{x}E_{ \rho ^{\prime }\rho ^{\prime }}/\bar {\rho }^{2}$ at $y^{*}=5$ plotted against (a) ${\lambda }_{x}^{+}$, (b) ${\lambda }_{x}^{*}$ and (c) ${\lambda }_{x}/\delta$. (df) The normalised premultiplied spanwise spectra of the fluctuating density $k_{z}E_{ \rho ^{\prime }\rho ^{\prime }}/\bar {\rho }^{2}$ at $y^{*}=5$ plotted against (d) ${\lambda }_{z}^{+}$, (e) ${\lambda }_{z}^{*}$ and (f) ${\lambda }_{z}/\delta$.

Figure 30

Figure 29. (a,b) The normalised premultiplied streamwise spectra of the fluctuating temperature $k_{x}E_{ T^{\prime }T^{\prime }}/\bar {T}^{2}$ in (a) inner scaling and (b) outer scaling. (c,d) The normalised premultiplied spanwise spectra of the fluctuating temperature $k_{z}E_{ T^{\prime }T^{\prime }}/\bar {T}^{2}$ in (c) inner scaling and (d) outer scaling. The filled contour represents the normalised premultiplied spectra in ‘M8T08’. The line contour levels are (0.2, 0.4, 0.6, 0.8) times the peak values. The horizontal dashed lines represent $y^{*}=2, 5, 50$ in (a,c) and $y/\delta =0.8$ in (b,d), respectively.

Figure 31

Figure 30. (a) The normalised premultiplied streamwise spectra of the fluctuating temperature $k_{x}E_{ T^{\prime }T^{\prime }}/\bar {T}^{2}$ at $y/\delta =0.8$ plotted against ${\lambda }_{x}/\delta$. (b) The normalised premultiplied spanwise spectra of the fluctuating temperature $k_{z}E_{ T^{\prime }T^{\prime }}/\bar {T}^{2}$ at $y/\delta =0.8$ plotted against ${\lambda }_{z}/\delta$.

Figure 32

Figure 31. (a,b) The normalised premultiplied streamwise spectra of the fluctuating temperature $k_{x}E_{ T^{\prime }T^{\prime }}/\bar {T}^{2}$ at $y^{*}=50$ plotted against (a) ${\lambda }_{x}^{+}$ and (b) ${\lambda }_{x}^{*}$. (c,d) The normalised premultiplied spanwise spectra of the fluctuating temperature $k_{z}E_{ T^{\prime }T^{\prime }}/\bar {T}^{2}$ at $y^{*}=50$ plotted against (c) ${\lambda }_{z}^{+}$ and (d) ${\lambda }_{z}^{*}$.

Figure 33

Figure 32. (ac) The normalised premultiplied streamwise spectra of the fluctuating temperature $k_{x}E_{ T^{\prime }T^{\prime }}/\bar {T}^{2}$ at $y^{*}=2$ plotted against (a) ${\lambda }_{x}^{+}$, (b) ${\lambda }_{x}^{*}$ and (c) ${\lambda }_{x}/\delta$. (df) The normalised premultiplied spanwise spectra of the fluctuating temperature $k_{z}E_{ T^{\prime }T^{\prime }}/\bar {T}^{2}$ at $y^{*}=2$ plotted against (d) ${\lambda }_{z}^{+}$, (e) ${\lambda }_{z}^{*}$ and (f) ${\lambda }_{z}/\delta$.

Figure 34

Figure 33. (ac) The normalised premultiplied streamwise spectra of the fluctuating temperature $k_{x}E_{ T^{\prime }T^{\prime }}/\bar {T}^{2}$ at $y^{*}=5$ plotted against (a) ${\lambda }_{x}^{+}$, (b) ${\lambda }_{x}^{*}$ and (c) ${\lambda }_{x}/\delta$. (df) The normalised premultiplied spanwise spectra of the fluctuating temperature $k_{z}E_{ T^{\prime }T^{\prime }}/\bar {T}^{2}$ at $y^{*}=5$ plotted against (d) ${\lambda }_{z}^{+}$, (e) ${\lambda }_{z}^{*}$ and (f) ${\lambda }_{z}/\delta$.

Figure 35

Figure 34. (a,b) Quadrant contributions to the turbulent heat flux $\overline {{T}^{\prime }{v}^{\prime }}$ along the wall-normal direction in (a) ‘M8T015’ and (b) ‘M8T04’. (c,d) Quadrant contributions to the turbulent entropy flux $\overline {{s}^{\prime }{v}^{\prime }}$ along the wall-normal direction in (c) ‘M8T015’ and (d) ‘M8T04’. The insets shown the sharp peaks of the quadrant contributions.

Figure 36

Figure 35. The comparisons between the DNS cases in this study and the DNS database in Zhang et al. (2018): (a) the wall-normal grid spacing $\Delta y^{+}$, (b) the van Driest transformed mean velocity $U^{+}_{VD}$, (c) the intensities of the streamwise fluctuating velocity $u_{rms}^{\prime }/u_{\tau }^{*}$, (d) the intensities of the wall-normal fluctuating velocity $v_{rms}^{\prime }/u_{\tau }^{*}$, (e) the intensities of the spanwise fluctuating velocity $w_{rms}^{\prime }/u_{\tau }^{*}$, (f) the Reynolds shear stress $- \langle u^{\prime }v^{\prime } \rangle /{u^{*}}^{2}$.