


1. Introduction
Particle segregation in flowing granular materials has significant implications for flow mobility, rheology and mixing, a fact reflected in the extensive attention given to this topic in granular flow mechanics, geophysical flows and chemical engineering processes (Ottino & Khakhar Reference Ottino and Khakhar2000; Ottino & Lueptow Reference Ottino and Lueptow2008; Frey & Church Reference Frey and Church2009; Cúñez, Patel & Glade Reference Cúñez, Patel and Glade2024; Kamrin et al. Reference Kamrin, Hill, Goldman and Andrade2024). Recent advances in continuum advection–diffusion–segregation models allow successful prediction of segregation in canonical granular flow configurations (Gray Reference Gray2018; Umbanhowar, Lueptow & Ottino Reference Umbanhowar, Lueptow and Ottino2019; Thornton Reference Thornton2021), although this approach requires building generalized constitutive relations for segregation. Nevertheless, the basics are straightforward: segregation in dense granular flows is driven by gravity and shear (Fan & Hill Reference Fan and Hill2011a; Jing et al. Reference Jing, Ottino, Lueptow and Umbanhowar2021; Liu, Singh & Henann Reference Liu, Singh and Henann2023).
Gravity-induced segregation is generated by percolation of small particles through voids between large particles (Savage & Lun Reference Savage and Lun1988) and buoyancy effects whereby heavier particles sink relative to lighter particles (Xiao et al. Reference Xiao, Umbanhowar, Ottino and Lueptow2016). Shear-induced segregation can be driven by enhanced percolation due to kinetic sieving (shear opens voids beneath small particles), a mechanism whose description draws inspiration from the kinetic theory of dense gases (Jenkins & Mancini Reference Jenkins and Mancini1987; Savage & Lun Reference Savage and Lun1988; Jenkins & Yoon Reference Jenkins and Yoon2002; Larcher & Jenkins Reference Larcher and Jenkins2015; Berzi, Jenkins & Richard Reference Berzi, Jenkins and Richard2020), as well as migration of particles along shear gradients (Fan & Hill Reference Fan and Hill2011a). These mechanisms can cooperate or compete depending on the forces driving the flow, leading to complex and sometimes seemingly contradictory phenomena (Guillard, Forterre & Pouliquen Reference Guillard, Forterre and Pouliquen2016; Jing et al. Reference Jing, Ottino, Lueptow and Umbanhowar2021). For example, while large particles typically rise to the top of gravity-driven free-surface granular flows (Staron & Phillips Reference Staron and Phillips2014), there are also conditions for which large particles instead sink to the bottom of the flow (Thomas Reference Thomas2000; Félix & Thomas Reference Félix and Thomas2004) or migrate to high-shear-rate regions (Fan & Hill Reference Fan and Hill2011a). There can be a benefit to these effects: size segregation and density segregation can be used strategically to offset one another to avoid segregation altogether (Alonso, Satoh & Miyanami Reference Alonso, Satoh and Miyanami1991; Duan et al. Reference Duan, Umbanhowar, Ottino and Lueptow2021, Reference Duan, Peckham, Umbanhowar, Ottino and Lueptow2023). Although these strategies and observations have advanced our knowledge, much remains to be understood about segregation in granular flows, particularly with regard to the driving forces at the particle scale.
Recent detailed characterization of the driving and resisting forces of segregation on individual particles or collections of particles in granular flows has informed an emerging bottom-up framework for segregation flux modelling (Rousseau et al. Reference Rousseau, Chassagne, Chauchat, Maurin and Frey2021; Tripathi et al. Reference Tripathi, Kumar, Nema and Khakhar2021; Duan et al. Reference Duan, Jing, Umbanhowar, Ottino and Lueptow2022; Sahu et al. Reference Sahu, Kumawat, Agrawal and Tripathi2023; Yennemadi & Khakhar Reference Yennemadi and Khakhar2023). The essential idea is to first ascertain the segregation driving force,  $F_{seg}$, and the resistive drag force,
  $F_{drag}$, at the particle level (Guillard et al. Reference Guillard, Forterre and Pouliquen2016; van der Vaart et al. Reference van der Vaart, van Schrojenstein Lantman, Weinhart, Luding, Ancey and Thornton2018; Jing et al. Reference Jing, Ottino, Lueptow and Umbanhowar2020, Reference Jing, Ottino, Lueptow and Umbanhowar2021, Reference Jing, Ottino, Umbanhowar and Lueptow2022; Liu & Müller Reference Liu and Müller2021) and then derive the stress gradients between particle species at the continuum level based on homogenization (Rousseau et al. Reference Rousseau, Chassagne, Chauchat, Maurin and Frey2021; Duan et al. Reference Duan, Jing, Umbanhowar, Ottino and Lueptow2022). This approach can form the basis for further derivations of the segregation flux in a mixture theory framework (Gray & Thornton Reference Gray and Thornton2005; Rousseau et al. Reference Rousseau, Chassagne, Chauchat, Maurin and Frey2021). In this process, the key step is determining the functional forms of
  $F_{seg}$ and
  $F_{drag}$, as discussed extensively in recent literature. Briefly, at the single-intruder limit,
  $F_{seg}$ consists of a gravity-induced, buoyancy-like term and a shear-gradient-induced term (Guillard et al. Reference Guillard, Forterre and Pouliquen2016; van der Vaart et al. Reference van der Vaart, van Schrojenstein Lantman, Weinhart, Luding, Ancey and Thornton2018; Jing et al. Reference Jing, Ottino, Lueptow and Umbanhowar2021; Liu & Müller Reference Liu and Müller2021), whereas
  $F_{drag}$ can be characterized by a Stokes-like drag (Tripathi & Khakhar Reference Tripathi and Khakhar2011; Jing et al. Reference Jing, Ottino, Umbanhowar and Lueptow2022). However, a complete description of how
  $F_{seg}$ and
  $F_{drag}$ depend on particle concentration remains to be developed (Bancroft & Johnson Reference Bancroft and Johnson2021; Duan et al. Reference Duan, Jing, Umbanhowar, Ottino and Lueptow2022). Here we focus on
  $F_{seg}$ and its dependence on particle concentration in flows where both buoyancy and shear-gradient effects may be present.
The segregation force is defined as the net force on a particle in the segregation direction resulting from interactions with other flowing particles, which, when combined with other forces acting on the particle (such as its weight), drives segregation (Guillard et al. Reference Guillard, Forterre and Pouliquen2016; Jing et al. Reference Jing, Ottino, Lueptow and Umbanhowar2021). Despite its simple definition, measuring  $F_{seg}$ directly is challenging in physical experiments due to the small magnitude of
  $F_{seg}$ relative to the force fluctuations in rapidly flowing granular materials. Alternatively, although discrete element method (DEM) or other particle dynamics simulation methods can provide detailed force information on any particle in a granular mixture, direct calculation of the net contact force on freely segregating particles fails to accurately characterize
  $F_{seg}$ because a quasi-equilibrium state often occurs in which the measured net contact force (i.e. a combination of segregation and drag forces) is balanced by the particle weight. Furthermore, it is difficult to differentiate between segregation forces and drag forces at the particle level. For example, Staron (Reference Staron2018) examined two-dimensional simulations with both single free intruders and bidisperse granular mixtures. In both cases, the ‘lift force’ acting on the larger grains is not measurable because the mean vertical force exerted on the larger grains exactly balances their weight and is the sum of both the segregation force and the drag force, which cannot be split a priori. Similarly, Tunuguntla, Weinhart & Thornton (Reference Tunuguntla, Weinhart and Thornton2016) computed the species-specific contact stresses for bidisperse mixtures in inclined chute flow and found that the gradient of the species-specific contact stress is effectively balanced by the gravitational force such that no measurable momentum exchange between the two species can be found for a freely segregating mixture.
To solve this problem, a ‘virtual force meter’ was proposed by Guillard et al. (Reference Guillard, Forterre and Pouliquen2016) and rapidly adapted to a variety of flows (Guillard et al. Reference Guillard, Forterre and Pouliquen2016; van der Vaart et al. Reference van der Vaart, van Schrojenstein Lantman, Weinhart, Luding, Ancey and Thornton2018; Jing et al. Reference Jing, Ottino, Lueptow and Umbanhowar2020, Reference Jing, Ottino, Lueptow and Umbanhowar2021; Liu & Müller Reference Liu and Müller2021). This approach uses DEM simulations to consider the single-intruder limit (i.e. where the volume concentration of species  $i$ in a bidisperse granular mixture approaches zero,
  $c_i\rightarrow 0$) in a ‘bed’ of flowing particles, which are typically smaller than the intruder. The single spherical intruder particle is attached to a virtual spring that acts only in the segregation direction, typically the
  $z$ direction, which is perpendicular to the flow in the
  $x$ direction. The spring constrains the intruder to remain at an average equilibrium
  $z$ position, but does not restrict its other degrees of freedom. Most importantly, the mean spring extension provides the spring force from which the segregation force
  $F_{seg}$ for a given set of simulation conditions can be found after accounting for the particle weight (or other forces).
Using the virtual spring approach, we developed a model (Jing et al. Reference Jing, Ottino, Lueptow and Umbanhowar2021) for  $F_{seg}$ on a single intruder particle of species
  $i$, denoted
  ${F}_{i,0} \equiv F_{seg}|_{c_i\rightarrow 0}$, which has been validated in various free-surface and wall-confined granular flows at steady state where the acceleration term is negligible and the flow is assumed incompressible. This single-intruder segregation force model has two terms, one related to gravity and the other related to flow kinematics:
 \begin{equation} F_{i,0}={-}f^g(R)\frac{\partial{p}}{\partial{z}}V_i+f^k(R)\frac{p}{\dot\gamma} \frac{\partial\dot\gamma}{\partial{z}}V_i, \end{equation}
where superscripts  $g$ and
  $k$ indicate gravity- and kinematics-related mechanisms, respectively, the dimensionless functions
  $f^g(R)$ and
  $f^k(R)$ depend on the intruder-to-bed-particle size ratio
  $R$ (expressions are provided later in equation (3.1)),
  $V_i$ is the intruder volume,
  $p$ is the pressure,
  $\dot \gamma$ is the local shear rate and
  $\rho$ is the density of both the intruder and the bed particles. Here, ‘pressure’ and vertical ‘normal stress’ are interchangeable (
 $p\equiv \sigma _{zz}$) under the assumptions that granular flows at steady state are incompressible and the deviatoric stress aligns with the strain rate tensor (Kim & Kamrin Reference Kim and Kamrin2023). In dimensionless form, (1.1) can be expressed as
 \begin{equation} \hat{F}_{i,0}=\hat{F}^g_{i,0} + \hat{F}^k_{i,0}, \end{equation}
where the hat diacritic ( $~\hat {}~$) denotes dimensionless forces scaled for reference by particle weight,
  $m_ig_0$, in Earth gravity,
  $g_0=9.81$ m s
 $^{-2}$. Accordingly, the normalized gravity- and kinematics-induced segregation forces on a lone intruder particle are
 $$\begin{gather} \hat{F}^g_{i,0}={-}f^g(R)\frac{\partial p}{\partial z} \frac{1}{\rho g_0}, \end{gather}$$
 $$\begin{gather}\hat{F}^k_{i,0}=f^k(R)\frac{\partial \dot\gamma}{\partial z} \frac{p} {\dot\gamma \rho g_0}. \end{gather}$$
Note that although here we use  $g_0$ for normalization, our models work for arbitrary values of gravitational acceleration (including
  $g=0$) as shown previously (Jing et al. Reference Jing, Ottino, Lueptow and Umbanhowar2020, Reference Jing, Ottino, Lueptow and Umbanhowar2021). The intruder segregation force model (1.2) is a semi-empirical fit to the simulation data, with the first term solely associated with gravity and the second term dependent on the bulk shear rate and its gradient. The shear-rate-gradient term
  $\hat {F}^k_{i,0}$ has a singularity in the shear rate at
  $\dot \gamma =0$. This singularity also exists in the viscosity defined at the continuum level and represented as
  $\eta =\tau /\dot \gamma,$ where
  $\tau$ is the shear stress. However, when incorporating this segregation force model (1.2) into the force/momentum balance along with interspecies drag, the singularities are eliminated as
  $\dot \gamma \rightarrow 0$, since
  $\hat {F}^k_{i,0}$ and drag dominate, and both scale as
  $1/\dot \gamma$. We have previously shown (Jing et al. Reference Jing, Ottino, Lueptow and Umbanhowar2021) that if a local rheology is assumed, (1.2a) is equivalent to an earlier model of similar form in which the shear stress gradient is used instead of the shear rate gradient (Guillard et al. Reference Guillard, Forterre and Pouliquen2016). Although other intruder segregation force models exist, including ones related to Saffman lift (van der Vaart et al. Reference van der Vaart, van Schrojenstein Lantman, Weinhart, Luding, Ancey and Thornton2018), kinetic theory (Liu & Müller Reference Liu and Müller2021) and granular temperature gradients (Fan & Hill Reference Fan and Hill2011b; Hill & Tan Reference Hill and Tan2014), (1.2) is the only model to be thoroughly validated over a range of three-dimensional flow configurations including confined wall-driven flows and free-surface gravity-driven flows. While the kinetic theory of granular flow (Jenkins & Mancini Reference Jenkins and Mancini1987) offers insights into the relationship between the granular temperature and the segregation force, it is difficult to use as a first-principles approach to modelling the segregation force in the dense flow regime.
The single-intruder limit for the segregation force,  ${F}_{i,0} = F_{seg}|_{c_i\rightarrow 0}$, is now relatively well studied, but
  ${F}_{i}=F_{seg}|_{c_i\in (0,1)}$ on a single particle in a mixture of particles with an arbitrary value of
  $c_i$ between
  $0$ and
  $1$ is much less understood, although linear and quadratic dependencies of
  ${F}_{i}$ on
  $c_i$ have been previously assumed (Rousseau et al. Reference Rousseau, Chassagne, Chauchat, Maurin and Frey2021; Tripathi et al. Reference Tripathi, Kumar, Nema and Khakhar2021). To explore the segregation force at finite concentrations, we extended the virtual spring approach for a single intruder particle (Guillard et al. Reference Guillard, Forterre and Pouliquen2016) to size-bidisperse mixtures of arbitrary species concentration (Duan et al. Reference Duan, Jing, Umbanhowar, Ottino and Lueptow2022) in order to characterize the dependence of the gravity-induced portion of the segregation force,
  $F_i^g$, on
  $c_i$ in a controlled horizontal uniform-shear flow (i.e.
  $\partial \dot \gamma /\partial {z}=0$). An example of the concentration dependence of
  $F_i^g$ at large-to-small particle size ratio
  $R=d_l/d_s=2$ is shown in figure 1 for a DEM simulation of plane shear flow (as described in § 2). Consistent with previous results (Duan et al. Reference Duan, Jing, Umbanhowar, Ottino and Lueptow2022), data points for
  $\hat {F}_i^g=F_{i,0}^g/m_i g_0$ approach the single-intruder limit,
  $\hat {F}_{i,0}^g$, as
  $c_i\rightarrow 0$. For large particles,
  $\hat {F}_{l,0}^g>1$ as
  $c_i\rightarrow 0$, indicating that the upward segregation force exceeds the particle weight, resulting in a tendency for a large particle to rise; for small particles,
  $\hat {F}_{s,0}^g<1$ as
  $c_i\rightarrow 0$, indicating that the upward segregation force is less than the particle weight, resulting in a tendency for a small particle to sink. At
  $c_i=1$,
  $\hat {F}_{i,0}^g=1$ for both large and small particles, indicating that the segregation force equals the particle weight such that no segregation occurs as required for the monodisperse case.

Figure 1. Example of gravity-induced segregation force scaled by particle weight  $\hat F_i^g=F_i^g/m_ig_0$ versus species concentration
  $c_i$ for large and small particles with size ratio
  $R=d_l/d_s=2$ in uniform shear flow (
 ${\hat F^k_i=0}$) with
  $\dot \gamma =100$ s
 $^{-1}$. Error bars show the standard deviation of depth-averaged
  $\hat F_i^g$ from DEM simulations (Duan et al. Reference Duan, Jing, Umbanhowar, Ottino and Lueptow2022). Filled circles at
  $c_i=0$ and curves are predictions of intruder force model (1.2b) and mixture force model (1.3), respectively.
A semi-empirical model (Duan et al. Reference Duan, Jing, Umbanhowar, Ottino and Lueptow2022) can be used to express the concentration-dependent gravity-induced segregation force on particles of species  $i,$
$i,$  $F_i^g,$ in terms of the gravity-induced segregation force on a single intruder particle,
  ${F}^g_{i,0}$, and the small and large particles concentrations,
  $c_s$ and
  $c_l$, respectively, such that for a large particle
 \begin{equation} \hat F_l^g=1+(\hat{F}^g_{l,0}-1)\tanh{\left( \frac{1-\hat{F}^g_{s,0}}{\hat{F}^g_{l,0}-1}\frac{c_s}{c_l} \right)}, \end{equation}
where  $\hat {F}^g_{l,0}$ and
  $\hat {F}^g_{s,0}$ are the gravity-induced dimensionless segregation forces on a small or large intruder particle, respectively, and
  $c_s+c_l=1$. The analogous equation for a small particle is
 \begin{equation} \hat{F}^g_{s}=1-(\hat{F}^g_{l,0}-1){\frac{c_l}{c_s}}\tanh{\left( \frac{1-\hat{F}^g_{s,0}}{\hat{F}^g_{l,0}-1}\frac{c_s}{c_l} \right)}. \end{equation}
 Equation (1.3) fits the data in figure 1 quite well. The empirically determined (1.3) saturates at the extremes of the domain, as is the case here where  $\hat {F}_i^g$ approaches the single-intruder limit as
  $c_i\rightarrow 0$ and approaches the monodisperse limit of 1 as
  $c_i\rightarrow 1$. Note that the asymmetry between segregation forces for large and small particles leads to different expressions for the two species. Furthermore, the two equations in (1.3) depend only on the segregation force on small and large intruder particles,
  $\hat {F}^g_{s,0}$ and
  $\hat {F}^g_{l,0}$, and the concentration of small and large particles,
  $c_s$ and
  $c_l$. No knowledge of the segregation force for
  $0< c_i\leq 1$ is needed. Moreover, the hyperbolic tangent dependence of the large particle segregation force (1.3a) satisfies the theoretical constraints, namely that
  $\lim _{c_l\rightarrow 0}\tanh {(c_s/c_l)}=1$ and
  $\lim _{c_l\rightarrow 1}\tanh {(c_s/c_l)}=0$ such that
  $\hat F_l^g=\hat {F}_{l,0}^g$ at
  $c_l=0$ and
  $\hat F_l^g=1$ at
  $c_l=1$. Likewise for a small particle, (1.3b) satisfies
  $\hat F_s^g=\hat {F}_{s,0}^g$ at
  $c_s=0$ (since
  $\tanh (A) \approx A$ for
  $A\rightarrow 0$) and
  $\hat F_s^g=1$ at
  $c_s=1$. These equations also meet the requirement that the total segregation force across both species for the entire system sums to the total particle weight under the assumption of negligible acceleration, which can be expressed as (Duan et al. Reference Duan, Jing, Umbanhowar, Ottino and Lueptow2022)
 \begin{equation} c_l \hat F_l^g + c_s \hat F_s^g=1. \end{equation}
 With the concentration-dependent expression for the gravity-driven segregation force (1.3) specified, the challenge at this point, and the focus of this paper, is extending the finite concentration framework to include the single-intruder limit kinematics-related term in (1.2c). To this end, we build upon the models portrayed in (1.2) and (1.3) to extend this approach to the total segregation force,  $F_i$, on a particle due to both gravity-induced and kinematics-induced effects for arbitrary concentration size-bidisperse mixtures. We then validate the predictions of the full model with comparisons with DEM results from a variety of canonical granular flows. The ultimate goal is a segregation force model encompassing the full range of flow and particle conditions that can be broadly applied to a wide variety of situations.
2. Method
An in-house DEM code running on CUDA-enabled NVIDIA GPUs simulates size-bidisperse particle mixtures with species-specific volume concentration  $c_i$, diameter
  $d_i$ and density
  $\rho _i=1$ g cm
 $^{-3}$ (
 $i=l,s$ for large or small particles, respectively). Mixtures are sheared in the streamwise (
 $x$) direction. Boundary conditions are periodic in
  $x$ and
  $y$ with length
  $L=35d_l$ and width
  $W=10d_l$, respectively. The height is
  $H=25d_l$ to
  $50d_l$ (varied as needed) in the
  $z$ direction, which is normal to the flow direction. Gravity may be aligned with the
  $z$ direction, as shown in figure 2, at an angle
  $\theta$ with respect to
  $z$ for inclined chute flow, or parallel to the flow aligned with
  $x$ for vertical chute flow. In some cases, gravity is set to zero. The standard linear spring–dashpot model (Cundall & Strack Reference Cundall and Strack1979) is used to resolve particle–particle and particle–wall contacts of spherical particles using a friction coefficient of
  $\mu =0.5$, a restitution coefficient of 0.9 and a binary collision time of 0.15 ms. We have confirmed that our results are relatively insensitive to these values except for very low friction coefficients (
 $\mu \lesssim 0.2$) (Duan et al. Reference Duan, Umbanhowar, Ottino and Lueptow2020; Jing et al. Reference Jing, Ottino, Lueptow and Umbanhowar2020), where a decreasing friction coefficient reduces size-induced segregation fluxes (Jing, Kwok & Leung Reference Jing, Kwok and Leung2017). Here, we focus on cases where segregation flux is nearly independent of
  $\mu$ for
  $\mu \gtrsim 0.3$ (Duan et al. Reference Duan, Umbanhowar, Ottino and Lueptow2020), noting that friction coefficients reported in the literature for granular flow simulations typically fall between 0.3 and 0.6 (Girolami et al. Reference Girolami, Hergault, Vinay and Wachs2012). Large (
 $d_l=4$ mm) and small (
 $d_s$ varied to adjust the size ratio,
  $R=d_l/d_s$) particle species have a
  $\pm$10 % uniform size distribution to minimize layering (Staron & Phillips Reference Staron and Phillips2014) (increasing the size variation to
  $\pm$20 % does not alter the results). From 26 000 to 150 000 particles are included in each simulation depending on the value of
  $R$. The local inertial number, I, ranges from 0 to 0.4 away from boundaries depending on the flow conditions. While certain flows may exhibit a quasi-static regime (
 $I < 10^{-3}$), our modelling approach is intended for application in the inertial regime.

Figure 2. Large (4 mm, blue) and small (2 mm, red) particles ( $c_l=c_s=0.5$) in a generic shear flow partitioned into
  $2.5d_l$-thick layers (shading). Within each layer, a vertical spring-like restoring force measurement approach quantifies the average local segregation force across all particles of a particular species (small or large) in that layer.
The modified virtual spring approach used to measure  $F_i$ in finite concentration uniform shear flows (Duan et al. Reference Duan, Jing, Umbanhowar, Ottino and Lueptow2022) must be further modified for flows with shear rate gradients since, as (1.2c) indicates, the kinematic term can be depth dependent through the pressure (depending on
  $g$), the shear rate gradient, or both. For the method used previously to measure
  $F_i$ (Duan et al. Reference Duan, Jing, Umbanhowar, Ottino and Lueptow2022) in uniform shear flow, a spring-like vertical restoring force proportional to the relative displacement of the vertical centres of mass of the two initially mixed species is applied uniformly to all particles of each species at each simulation time step. From this restoring force, the average value of
  $F_i$ for each species is determined based on the average vertical displacement and the applied spring constant. Not only does this allow the measurement of
  $F_i$, but it also simultaneously suppresses segregation throughout the flow domain, which otherwise would change the local species concentration.
In the variation of this approach used here for depth-varying segregation forces, the flow domain is partitioned into layers normal to the segregation direction that are  $2.5d_l$ (
 $1$ cm) thick (alternating shaded and unshaded regions in the
  $H=25d_l$-deep bed in figure 2). Particles are labelled according to the vertical layer in which they are initially located and then remain part of that layer's group regardless of their subsequent vertical displacement. At each time step a layer-specific vertical restoring force is uniformly applied to each particle of species
  $i$ associated with the layer,
  $F_{res,i}=-k( \bar z_{i}-\bar z_j)/N_i$, where the centre of mass of species
  $i$ is
  $\bar z_{i}={\sum _{p\in i}^{N_i} z_p}/N$, subscript
  $j$ indicates the other species and
  $N_i$ and
  $N$ are the number of particles of species
  $i$ and the total number of particles associated with the layer, respectively. In each layer, the applied vertical restoring forces balance, i.e.
  $F_{res,i} N_i+F_{res,j}N_j=0$, and the bulk flow behaviour (e.g. shear flow, bulk pressure) is unaltered. The spring constant is typically
  $k=100$ N m
 $^{-1}$, although results are not sensitive to
  $k$ (Jing et al. Reference Jing, Ottino, Lueptow and Umbanhowar2021; Duan et al. Reference Duan, Jing, Umbanhowar, Ottino and Lueptow2022). As shown in the free body diagram for a large particle in the lower right of figure 2, the segregation force,
  $F_i$, is determined from the magnitude of the restoring force after accounting for the weight of the particle due to gravity,
  $g_0$, or the component of gravity in the
  $z$ direction,
  $g_z=g_0\cos {\theta }$. Individual particles otherwise move freely in the streamwise and spanwise directions.
The advantages of the restoring force measurement approach lie in its ability to suppress overall particle segregation and characterize depth-varying segregation forces while simultaneously allowing individual particles to move freely. The effectiveness of the restoring force in suppressing segregation is demonstrated in a previous study (Duan et al. Reference Duan, Jing, Umbanhowar, Ottino and Lueptow2022), where segregation results for uniform shear flows are compared at different times in scenarios with and without the added restoring force. The restoring force approach is further validated by converting the measured segregation force into a constant additional body force equivalent to a fixed density difference between species. The absence of segregation observed under these conditions confirms that the segregation force measured using the restoring force approach is indeed representative of the segregation force in the absence of virtual springs.
For all simulation conditions, collisional diffusion results in some particles dispersing outside their initial layer, which may corrupt the segregation force measurement when the segregation force varies with depth. Additionally, species-dependent differences in diffusion rates can potentially affect the force balance measurement approach for particles close to boundaries. Consider, for example, a uniform flow with  $\partial p/\partial z=0$ and
  $\partial \dot \gamma /\partial z=0$ such that there are no segregation forces. If large particles assigned to a wall-adjacent layer diffuse away from the wall more rapidly than small particles in the same layer, the resulting increase in the centre of mass position difference between the two species will produce an associated restoring force. To quantify the potential effects of diffusion on the measured segregation forces, results for particles assigned to layers based on their initial vertical positions are compared with results where the layer assignment occurs at the start of the measurement averaging interval, which varies from 3 to 30 s after shear onset for the various flow conditions. The latter approach ensures that diffusion over a relatively short averaging interval (2 s) is insignificant. The overall differences in these two approaches are less than 5 % in all cases, indicating that particle diffusion has minimal impact on the restoring force measurement approach even near the boundaries. Nevertheless, to minimize the potential effects of diffusion on force measurement, we initially assign particles to the vertical layers at shear onset to prevent segregation and then reassign particles to their current layers at the start of the measurement averaging interval.
The force measurement approach illustrated in figure 2 is applied to a variety of flow configurations, including controlled shear flows and natural uncontrolled flows, each of which is shown schematically in figure 3. For the controlled shear flows (figure 3a–d), a stabilizing algorithm (explained below) enforces a prescribed velocity profile between the two geometrically smooth, frictionless horizontal walls. By imposing a specific velocity profile, we control the shear rate and shear rate gradient, which, according to (1.2c), play direct roles in determining  $\hat {F}_{i,0}$. The presence of gravity, figure 3(a,d), results in a pressure gradient in
  $z$, which also influences
  $\hat {F}_{i,0}$ by virtue of both (1.2b) and (1.2c).

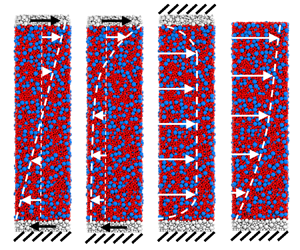
Figure 3. Schematics of flow configurations studied here (streamwise length shown is one-fifth the simulated length) with periodic streamwise ( $x$) and spanwise (
 $\kern 1.5pt y$) boundaries and vertical wall boundaries as indicated (no friction/rough, fixed vertical position/pressure
  $P_0$, streamwise stationary/moving). Controlled shear flows with prescribed (a) linear velocity profile with gravity; (b) exponential velocity profile without gravity; (c) parabolic velocity profile without gravity; and (d) exponential velocity profile with gravity. Natural flows: (e) wall-driven without gravity; ( f) wall-driven with gravity; (g) vertical chute with gravity; and (h) inclined chute with gravity. Walls with hash marks do not move vertically.
Three controlled-velocity profiles are investigated:  $u=Uz/H$ (linear),
  $U\,{\rm e}^{k(z/H-1)}$ (exponential) and
  $4U(z/H-z^2/H^2)$ (parabolic). The linear velocity profile corresponds to ideal uniform shear flow driven by a moving wall (figure 3a). A confining overburden pressure,
  $P_0$, is applied to the upper wall, which is free to move vertically, and
  $g$ is in the
  $z$ direction. This flow configuration matches the flow field that provided the basis for the dependence of the gravity-induced segregation force on the mixture concentration, (1.3), and there is no kinematics-induced segregation, since
  $\partial \dot \gamma /\partial z = 0$. The exponential velocity profile is an idealization of free-surface flow down a heap (Fan et al. Reference Fan, Umbanhowar, Ottino and Lueptow2013), except with an upper bounding wall and without gravity (figure 3b) in order to focus on kinematics-induced segregation. Likewise, the parabolic velocity profile (figure 3c), which is an idealization of vertical chute flow, has only kinematics-induced segregation. Since gravity does not contribute to the segregation force in a vertical chute, we set
  $g=0$ so the segregation force is a consequence of only the imposed parabolic velocity. We also consider a second version of an exponential velocity profile, except with a confining pressure,
  $P_0$, and a gravitational field in
  $z$ (figure 3d) to examine combined gravity-induced and kinematics-induced segregation.
In controlled shear flows (figure 3a–d), a specified velocity profile,  $u(z)$, is achieved by applying a small streamwise stabilizing force
  $k_v [u(z)-u_p(z_p)]$ to each particle at each DEM simulation time step to maintain the desired velocity profile, where
  $u_p$ and
  $z_p$ are the instantaneous particle velocity and position, respectively, and
  $k_v$ is a gain parameter (Lerner, Düring & Wyart Reference Lerner, Düring and Wyart2012; Clark et al. Reference Clark, Thompson, Shattuck, Ouellette and O'Hern2018; Fry et al. Reference Fry, Umbanhowar, Ottino and Lueptow2018; Jing et al. Reference Jing, Ottino, Lueptow and Umbanhowar2020, Reference Jing, Ottino, Lueptow and Umbanhowar2021, Reference Jing, Ottino, Umbanhowar and Lueptow2022). For the two controlled-pressure cases with gravity-induced pressure gradients, figure 3(a,d), and based on a recent analysis (Jing et al. Reference Jing, Ottino, Umbanhowar and Lueptow2022), we vary
  $k_v$ from 0.01 kg s
 $^{-1}$ at the top of the bed to 0.03 kg s
 $^{-1}$ at the bottom to account for the gravitational pressure gradient while avoiding altering the granular flow rheology and ensuring the desired velocity profile. For the two fixed-volume cases with
  $g=0$ and uniform pressure (figure 3b,c), the velocity profile is enforced with a constant
  $k_v=0.02$ kg s
 $^{-1}$, no overburden pressure is applied and the distance between the two walls,
  $H$, is fixed. Varying
  $k_v$ between 0.0001 and 0.1 indicates that
  $k_v \geq 0.01$ kg s
 $^{-1}$ is necessary to maintain the imposed velocity profile. Although the walls do not drive the flow, the upper wall moves with velocity
  $u(H)=U$ for cases in figure 3(a,b,d) and the lower wall is fixed,
  $u(0)=0$. Note that in the cases with exponential velocity profiles, figure 3(b,d), the imposed velocity
  $u$ does not go to zero at the lower wall, i.e.
  $u(z=0)\approx 0.1 U \neq 0$. Because the imposed velocity is relatively small near the lower wall and the wall is frictionless and smooth, the finite wall slip does not affect the results.
To confirm that the imposed velocity fields do not unnaturally alter the results, we also consider four cases where the velocity field is not directly controlled, as shown in figure 3(e–h). The flow kinematics of these uncontrolled ‘natural flows’ are driven entirely by the combined effects of gravity and boundary conditions. The walls are rough in all cases, formed from a  $2.5d_l$-thick layer of bonded large and small particles that move collectively. For the wall-driven flows, figure 3(e, f), an overburden pressure
  $P_0$ is imposed on the upper wall, which is otherwise free to move vertically, and which fluctuates by no more than
  $\pm$0.05 % after an initial rapid dilatation of the particles at flow onset. Gravity results in a pressure gradient in
  $z$ for the case in figure 3( f). In both cases, the upper wall moves at velocity
  $u(H) = U$ in the
  $x$ direction and the lower wall at
  $u(0) = -U$ in the
  $-x$ direction. With gravity, figure 3( f), the flow velocity changes rapidly with depth near the upper wall and slowly with depth near the bottom wall, while without gravity, figure 3(e), the velocity profile varies linearly with depth as expected. Both cases show little to no slip at either wall. The vertical chute flow, shown in figure 3(g), is driven by gravity aligned parallel to the rough bounding walls, resulting in a generally uniform velocity at the centre of the channel that goes to zero at the walls. In this case, there is no pressure gradient in
  $z$ to drive segregation, so any segregation in
  $z$ is driven by shear alone. Finally, the inclined chute flow has no upper wall (free boundary) so that particles flow due to a streamwise component of gravity, as shown in figure 3(h). Here the pressure gradient in the segregation direction is
  $g_0 \cos {\theta }$, where
  $\theta$ is the inclination angle of the base (lower wall) relative to
  $\boldsymbol {g}$.
3. Segregation force model
To predict the segregation force  $F_i$ at arbitrary non-zero concentrations, it is useful to know the segregation force at zero concentration,
  $F_{i,0}$. The challenge in predicting
  $F_{i,0}$ resides in the dependence of
  $f^g$ and
  $f^k$ on the intruder-to-bed particle size ratio
  $R$ in the intruder force model (1.2). Jing et al. (Reference Jing, Ottino, Lueptow and Umbanhowar2021) provide empirical fits of
  $f^g$ and
  $f^k$ that are derived from numerous controlled-shear-flow DEM simulations:
 $$\begin{gather} f^g(R)=\Bigg[ 1-c^g_1
\exp\Bigg(-\frac{R}{R^g_1}\Bigg) \Bigg] \Bigg[
1+c^g_2\exp\Bigg(-\frac{R}{R^g_2}\Bigg) \Bigg],
\end{gather}$$
$$\begin{gather} f^g(R)=\Bigg[ 1-c^g_1
\exp\Bigg(-\frac{R}{R^g_1}\Bigg) \Bigg] \Bigg[
1+c^g_2\exp\Bigg(-\frac{R}{R^g_2}\Bigg) \Bigg],
\end{gather}$$ $$\begin{gather}f^k(R)=f^k_\infty \Bigg[
\tanh{\Bigg(\frac{R-1}{R^k_1}\Bigg)} \Bigg] \Bigg[
1+c^k_2\exp\Bigg(-\frac{R}{R^k_2}\Bigg) \Bigg],
\end{gather}$$
$$\begin{gather}f^k(R)=f^k_\infty \Bigg[
\tanh{\Bigg(\frac{R-1}{R^k_1}\Bigg)} \Bigg] \Bigg[
1+c^k_2\exp\Bigg(-\frac{R}{R^k_2}\Bigg) \Bigg],
\end{gather}$$
where  $R^g_1=0.92$,
  $R^g_2=2.94$,
  $c^g_1=1.43$,
  $c^g_2=3.55$,
  $f^k_\infty =0.19$,
  $R^k_1=0.59$,
  $R^k_2=5.48$ and
  $c^k_2=3.63$ are fitting parameters for a variety of flow conditions. Note that
  $f^k$ and
  $f^g$ do not depend systematically on
  $I$ in the dense granular flow regime (Jing et al. Reference Jing, Ottino, Lueptow and Umbanhowar2021). In applying these functions over a range of concentrations, we need to consider both large and small particles as the intruder in the corresponding intruder-to-bed particle size ratios of
  $d_l/d_s$ and
  $d_s/d_l$. Here we restrict our attention to size ratios of 1.5, 2, and 3 (
 $\,f^g=2.254$ and
  $f^k=0.493$ for
  $R=1.5$, and
  $f^g=1.176$ and
  $f^k=-0.410$ for
  $R=1/1.5$;
  $f^g=2.343$ and
  $f^k=0.625$ for
  $R=2$, and
  $f^g=0.677$ and
  $f^k=-0.565$ for
  $R=1/2$;
  $f^g=2.154$ and
  $f^k=0.588$ for
  $R=3$, and
  $f^g=0.019$ and
  $f^k=-0.680$ for
  $R=1/3$).
Since (1.3) was developed for situations where gravity is normal to the flow direction ( $g_z=g_0$), the inclined chute configuration studied here makes it necessary to account for gravity acting at an angle
  $\theta$ with respect to
  $z$. Replacing
  $g_0$ with
  $g_z=g_0 \cos \theta$, (1.3) are rewritten as
 $$\begin{gather} \hat F_l^g=\cos{\theta}+(\hat{F}^g_{l,0}-\cos{\theta})\textrm{tanh}\left( \frac{\cos{\theta}-\hat{F}^g_{s,0}}{\hat{F}^g_{l,0}-\cos{\theta}}\frac{c_s}{c_l} \right), \end{gather}$$
 $$\begin{gather}\hat{F}^g_{s}=\cos{\theta}-(\hat{F}^g_{l,0}-\cos{\theta}){\frac{c_l}{c_s}}\textrm{tanh}\left( \frac{\cos{\theta}-\hat{F}^g_{s,0}}{\hat{F}^g_{l,0}-\cos{\theta}}\frac{c_s}{c_l} \right). \end{gather}$$
 Here, we propose and then confirm that the total segregation force at an arbitrary mixture concentration and including both the gravity-induced term and the kinematics-induced term can be represented in terms of the same hyperbolic tangent relationship. Replacing  $\hat {F}^{g}_i$ with
  $\hat {F}_i = \hat {F}^{g}_i + \hat {F}^k_i$ in (3.2a) and (3.2b) yields
 \begin{equation} \hat F_l=\cos{\theta}+(\hat{F}_{l,0}-\cos{\theta})\tanh\left( \frac{\cos{\theta}-\hat{F}_{s,0}}{\hat{F}_{l,0}-\cos{\theta}}\frac{c_s}{c_l} \right) \end{equation}
and
 \begin{equation} \hat{F}_{s}=\cos{\theta}-(\hat{F}_{l,0}-\cos{\theta}){\frac{c_l}{c_s}}\tanh\left( \frac{\cos{\theta}-\hat{F}_{s,0}}{\hat{F}_{l,0}-\cos{\theta}}\frac{c_s}{c_l} \right). \end{equation}
Analogous to (1.4), the total concentration-weighted segregation force across both species sums to the total particle weight in the segregation direction, which can be expressed as
 \begin{equation} c_l \hat{F}_l + c_s \hat{F}_s=\cos\theta. \end{equation}
Thus, the complete model for the concentration-dependent particle segregation force in flows of size-bidisperse mixtures with pressure and shear rate gradients is specified by (1.2), (3.1) and (3.3).
Finally, we remark that the segregation force can be recast as a species-specific partial pressure (normal stress) within a continuum model framework (Duan et al. Reference Duan, Jing, Umbanhowar, Ottino and Lueptow2022):
 \begin{equation} \frac{\partial p_i}{\partial z}={-}n_i F_{i} ={-}\rho \phi g_0 c_i \hat F_i , \end{equation}
where  $n_i$ is the number density of species
  $i$ and
  $\phi$ is the solid volume fraction. For uniform shear flow with constant segregation force, (3.5) can be written as
  $p_i=c_i \hat F_i p$, where
  $p$ is the bulk pressure. Details of the derivation from the full momentum balance are provided in the supplementary material. Note that the segregation force is independent of other terms in the momentum balance, such as interspecies drag or forces related to diffusion/remixing.
4. Results
4.1. Controlled shear flows
To test the concentration-dependent particle-level segregation force model described above, i.e. (1.2), (3.1) and (3.3), we first examine the controlled shear flows illustrated in figure 3(a–d), as these artificial velocity profiles allow us to consider the gravity-induced and kinematics-induced contributions both separately and in combination. We can then evaluate the accuracy of the mixture segregation force model predictions derived from (3.3a) and (3.3b) by comparing them with DEM measurements in various flow configurations. For the controlled shear flows we use two size ratios,  $R=2$ and
  $R=3$, and an equal volume mixture of large and small particles (
 $c_l=c_s=0.5$), although other species volume concentrations are considered in § 4.2.
Flow field details of the four controlled shear flows are shown in figure 4 for  $R=2$. Results are similar for
  $R=3$ (see supplementary material). The imposed and measured streamwise velocity profiles are shown in figure 4(a). The effectiveness of the control scheme for the velocity is evident in the close match between the DEM data points and the curves representing the target velocity profile. Figure 4(b,c) shows the dimensionless shear rate and shear rate gradient, both of which contribute to the kinematics-induced portion of the segregation force in (1.2b). The DEM results (data points), based on finite differences for the
  $z$ gradients (central difference for the interior data points and single-sided difference for the edge data points), match the curves from the derivatives of the imposed velocity profiles except near the walls (
 $z/H=0$ and
  $z/H=1$). In the near-wall region, the DEM results deviate slightly from the imposed velocity profile, barely evident in figure 4(a), but amplified by the higher derivatives associated with the shear rate and shear rate gradient in figure 4(b,c). The velocity profiles in figure 4(a) are chosen so that the shear rate gradients are zero in one case (linear, column (i)) and non-zero in the other cases. The exponential velocity profile (columns (ii) and (iv)) has a non-zero shear rate and shear rate gradient, and both are nonlinear. For the imposed parabolic velocity profile (column (iii)), the shear rate and shear rate gradient measured from DEM simulations match the targeted linearly varying and constant value, respectively, only in the middle two-thirds of the channel, and their magnitudes are much larger than the other cases.

Figure 4. Scaled flow field profiles for controlled shear flows with different velocity profiles and  $R=2$. Here
  $d_l=4$ mm,
  $d_s=2$ mm,
  $\rho _l=\rho _s=1$ g cm
 $^{-3}$,
  $H\approx 0.2\ \mathrm {m}=50d_l$ and
  $U=20$ m s
 $^{-1}$. Gravity
  $g=g_0=9.81$ m s
 $^{-2}$ in the negative
  $z$ direction for columns (i) and (iv), and
  $g=0$ in columns (ii) and (iii). Values for
  $P_0$ are
  $P_0=0.5\rho \phi g_0H$ for the applied overburden pressure (columns (i) and (iv)),
  $P_0=0.61\rho \phi g_0H$ for the exponential profile (column (ii)) and
  $P_0=0.73\rho \phi g_0H$ for the parabolic profile (column (iii)). In (e),
  $c_l$ is in colour and
  $\phi$ is black.
The flows in figure 4 also differ in their pressure fields, shown in figure 4(d). It is important to note that the pressure gradient not only plays the primary role in the gravity-induced term of the intruder segregation force, (1.2b), but also influences the kinematics-induced term, (1.2c). The theoretical lithostatic pressure (solid line) is  $p=P_0+\rho \phi g_0(H-z)$, where the solid volume fraction is assumed to be a constant
  $\phi =0.55$, and the applied overburden pressure is half of the maximum lithostatic pressure,
  $P_0=0.5\rho \phi g_0H$. The measured DEM pressures (data points), including both the dynamic, which is negligible, and the static components (Luding Reference Luding2008), match the expected values. For the linear and exponential velocity profiles (columns (i) and (iv)), gravity is imposed perpendicular to the flow direction. As a result, the pressure increases linearly with depth from the imposed overburden pressure,
  $P_0$, applied at the top wall, to
  $3 P_0$ at the bottom wall due to the added weight of the flowing particles (figure 4d(i),(iv)). The resulting pressure gradient,
  ${\partial p}/{\partial z}$, is constant due to the linear pressure increase with depth. For the two other cases (columns (ii) and (iii)),
  $g=0$ and the flow volume is constant because the walls are constrained to be
  $H=0.2$ m apart. Consequently, the resulting pressures are constant (see caption) and the pressure gradients in the
  $z$ direction are zero (figure 4d(ii),(iii)). Although
  $g=0$ in these two cases,
  $P_0$ is expressed relative to Earth's gravity,
  $g_0=9.81$ m s
 $^{-2}$, to allow comparison with the
  $g\neq 0$ cases and to provide physical context.
Figure 4(e) shows the concentration profile of large particles,  $c_l$ (colour), and the solid volume fraction profile,
  $\phi$ (black). In all cases,
  $c_l=0.5$ (vertical coloured line) within the uncertainty except near the walls, where size exclusion effects become significant. The concentration is nearly constant because segregation is suppressed by the restoring force, as described earlier in the context of figure 2. The solid volume fraction shows only minimal variation with depth, and remains near
  $\phi =0.55$ (vertical black line) in all cases, which is typical for these flow conditions (Jing et al. Reference Jing, Ottino, Lueptow and Umbanhowar2020).
With the various flow fields characterized, the intruder segregation force,  $\hat {F}_{i,0}$, can be determined and incorporated into the concentration-dependent form for the local segregation force on a particle,
  $\hat {F}_{i}$. Specifically,
  $\hat {F}_{i}$ is calculated from the corresponding local values of
  $\dot \gamma$,
  $\partial \dot \gamma /\partial z$,
  $p$ and
  $\partial p/\partial z$ according to (1.2) with coefficients from (3.1) and modified per (3.3) to account for the particle concentration. The values of
  $\dot \gamma$,
  $\partial \dot \gamma /\partial z$,
  $p$ and
  $\partial p/\partial z$ can be based on either their imposed values (solid curves in figure 4) or their measured DEM values (data points in figure 4). Hence, we plot three
  $\hat {F}_{i}$ results for
  $R=2$ in figure 5(a,b): a dashed black curve for
  $\hat {F}_{i}$ based on the imposed values of
  $\partial \dot \gamma /\partial z$,
  $p$ and
  $\partial p/\partial z$; a coloured solid curve for
  $\hat {F}_{i}$ based on the DEM measurements of
  $\partial \dot \gamma /\partial z$,
  $p$ and
  $\partial p/\partial z$; and data points for the values of
  $\hat {F}_{i}$ based on direct force measurements from DEM. Error bars indicate the DEM data standard deviation over the 2 s window, sampled at 0.01 s intervals (shown only for every fourth data point to avoid obscuring other data). Shaded error bands represent the uncertainty in force prediction, derived from the standard deviations of the time-averaged flow fields that propagate through the force model,
  $\sigma _F=F \sqrt { 2({\sigma _p}/{p})^2+ ({\sigma _{c_l}}/{c_l})^2 +({\sigma _{c_s}}/{c_s})^2 +({\sigma _{\dot \gamma }}/{\dot \gamma })^2}$. Again, we express
  $\hat {F}_i={F_i}/m_ig_0$ values relative to
  $g_0=9.81$ m s
 $^{-2}$, even when the imposed gravitational field is zero to allow comparison with the non-zero gravity cases and to provide physical context. The vertical dotted lines in figure 5(a,b) indicate the value about which
  $\hat {F}_{l}$ and
  $\hat {F}_{s}$ balance according to (3.4), which is
  $\cos \theta$ for
  $g\neq 0$ and 0 for
  $g=0$ (zero gravity component in the segregation direction is equivalent to
  $\theta =\pi /2$).

Figure 5. Segregation force profiles for large,  $\hat {F}_l={F_l}/m_lg_0$ (a), and small,
  $\hat {F}_s={F_s}/m_sg_0$ (b), particles at
  $R=2$ from the model (3.3) using the imposed velocity profile (dashed black curves) and the measured profiles (solid coloured curves) in figure 4 as well as direct DEM measurements (symbols) from 2 s time averages after the flow reaches steady state. Note the different horizontal axes limits in (a,b). Vertical dotted lines indicate the value about which
  $\hat {F}_{l}$ and
  $\hat {F}_{s}$ balance according to (3.4). (c) Inertial number profiles,
  $I=\dot {\gamma } \bar {d} / \sqrt {p/\rho }$ (see text).
Figure 5 shows that, overall, the predicted segregation forces,  $\hat {F}_l$ in figure 5(a) for large particles and
  $\hat {F}_s$ in figure 5(b) for small particles, match the DEM data for all cases, regardless of whether the prediction is based on the imposed velocity profile (dashed black curves) or the measured profiles (solid coloured curves). The good match is unsurprising for the uniform shear flow as this is the gravity-induced segregation case upon which the concentration dependence in (1.3) is based. However, the strong agreement in the other three cases demonstrates the validity of our approach.
In detail, first consider the linear velocity profile in column (i) of figure 5. Here the kinematics-induced segregation is zero and all segregation is due to gravity, for which  $\partial p / \partial z$ is constant. Hence, the segregation forces,
  $\hat {F}_l$ and
  $\hat {F}_s$, are constant with depth. More importantly,
  $\hat {F}_{i}$ based on the imposed values of
  $\partial p/\partial z$ (dashed black lines),
  $\hat {F}_{i}$ based on the DEM measurements of
  $\partial p/\partial z$ (solid coloured curves) and
  $\hat {F}_{i}$ based on direct force measurements (data points) match well. Due to the imposed restoring forces (see figure 2), the initial mixed concentration profile,
  $c_l=c_s=0.5$, remains uniform throughout the domain. Also note that the concentration weighted sum of
  $\hat {F}_l$ and
  $\hat {F}_s$ is one. In other words, the total segregation force across both species for the entire system sums to the total particle weight, as indicated by (3.4). This is evident in figure 5, column (i), as
  $\hat {F}_l$ and
  $\hat {F}_s$ being equidistant on either side of the dashed vertical line at
  $\hat {F}_i=1$ for both the DEM measurements and the model predictions.
The match between the model predictions and the DEM data for the exponential velocity profile in column (ii) of figure 5, while imperfect, indicates that kinematics-induced segregation can be captured by the extension of the intruder particle segregation force in (1.2) using the concentration dependence described by (3.3). In this case,  $\hat {F}_l$ and
  $\hat {F}_s$ depend only on the kinematics-induced term in (1.2c) to which
  $\dot \gamma$,
  $\partial \dot \gamma /\partial z$ and
  $p$ all contribute. However, even though
  $\dot \gamma$ and
  $\partial \dot \gamma /\partial z$ vary with depth for the exponential profile (see figure 4b(ii),c(ii)), the product
  $(1/\dot \gamma ) \partial \dot \gamma /\partial z$ is constant, as is
  $p$. Hence, the kinematics-induced segregation force is depth-independent. The model predictions based on both the imposed velocity profile (dashed black line) and the measured velocity (coloured solid curve) slightly overestimate the magnitude of
  $\hat {F}_l$ and
  $\hat {F}_s$. The model's underestimate of the segregation forces does not appear to be related to issues with the profiles in figure 4, for which the measured profiles for
  $\dot \gamma$,
  $\partial \dot \gamma /\partial z$ and
  $p$ seem to follow the imposed profiles quite closely. Nevertheless,
  $\hat {F}_l>0$, indicating a segregation force due to the shear that is in the positive
  $z$ direction for the large particles, reflecting the tendency of large particles to segregate toward regions of higher shear rate in dense flows (Fan & Hill Reference Fan and Hill2011b; Jing et al. Reference Jing, Ottino, Lueptow and Umbanhowar2021). In contrast,
  $\hat {F}_s<0$, which reflects the tendency of small particles to segregate toward low-shear regions. Additionally, because
  $g=0$ in this case, the total segregation force sums to 0 instead of 1 (equation (3.4) becomes
  $c_l \hat {F}_l + c_s \hat {F}_s=0$), as is evident in figure 5(a(ii),b(ii)) and verified mathematically from the data.
Predicting segregation forces for the parabolic velocity profile is more challenging, particularly near  $z/H=0.5$ where the flow is quasi-static. Since the pressure gradient is zero, the segregation force is again entirely kinematics-induced but with two complications at
  $z/H=0.5$. First, there is a singularity in the kinematics-induced term in (1.2c), because
  $\dot \gamma = 0$, and, second, the segregation force switches sign. Both effects are evident in the measured segregation force and the model predictions. It is therefore not surprising that the model predictions deviate substantially from the measured segregation force around
  $z/H=0.5$. While the model predicts the strong curvature in the dependence of the segregation forces on
  $z$, it again overpredicts the segregation forces compared with DEM measurements. The exception is near the walls where the DEM measurements lie between the model prediction determined using the imposed velocity profile (dashed black curve) and the model prediction determined using the measured velocity profile (solid coloured curve). Clearly, the model captures the qualitative dependence of the segregation force on the local kinematics, although the quantitative agreement could be better. Again, since
  $g=0$,
  $c_l \hat {F}_l + c_s \hat {F}_s=0$, as is evident in figure 5(a(iii),b(iii)) and verified mathematically from the data.
The last controlled shear flow that we consider combines gravity-induced and kinematics-induced segregation using an exponential velocity profile with gravity (see column (iv) of figure 5). Here the combined effects of the pressure and shear rate gradients result in a linear dependence of  $\hat {F}_i$ on
  $z$. The upward segregation force on large particles increases with depth, while the segregation force on small particles decreases with depth to the point of changing from positive to negative near
  $z/h \approx 0.2$. Nevertheless,
  $\hat {F}_l$ and
  $\hat {F}_s$ are equidistant on either side of the dotted vertical line at
  $\hat {F}_i=1$, indicating that (3.4) is satisfied. The match between the model predictions and the DEM measurements of the segregation force is reasonable. It is also evident that the model predictions based on the measured velocity profile capture a portion of the impact of the lower wall on the segregation force.
To further assess the applicability of the segregation force model proposed here, we also plot profiles of the local inertial number,  $I=\dot {\gamma } \bar {d} / \sqrt {p/\rho }$ where
  $\bar {d}=\sum c_id_i$, in figure 5(c). The large variation in
  $I$ from nearly zero to
  $0.4$ confirms the insensitivity of the segregation force to
  $I$ found in previous studies on the intruder segregation force (Jing et al. Reference Jing, Ottino, Lueptow and Umbanhowar2021); that is, pre-factors
  $f^g(R)$ and
  $f^k(R)$ of model (3.1) do not depend systematically on
  $I$ in the dense flow regime. Note that this does not contradict the general dependence of the segregation velocity on
  $I$, as the inter-species drag force during segregation is dependent on
  $I$ (Bancroft & Johnson Reference Bancroft and Johnson2021; Jing et al. Reference Jing, Ottino, Umbanhowar and Lueptow2022).
4.2. Varying concentration
The previous section considers only uniform mixtures of equal small and large particle volumes ( $c_s=c_l=0.5$). However, the concentration dependence of the segregation force based on (3.3) should be valid for any concentration,
  $0 \leq c_l \leq 1$ with
  ${c_s=1-c_l}$, and for non-uniform spatial concentration as well. To test this, we consider the exponential velocity profile case of figure 3(d) because it includes both gravity-induced and kinematics-induced segregation. Model predictions for
  $\hat {F}_i$ for uniform concentrations of
  $c_l=0.2$ and
  $c_l=0.8$ at
  $R=2$ are shown in figure 6. Whether based on imposed profiles for
  $\dot \gamma$,
  $\partial \dot \gamma /\partial z$,
  $p$ and
  $\partial p/\partial z$ or measured profiles of these same quantities, the model predictions generally coincide with each other as well as with the DEM results, although the measured
  $\hat {F}_i$ values for the lower-concentration species tend to be closer to zero than the predicted values. This is likely because the segregation forces have large uncertainty and the fitting parameters used in (3.1) have some associated uncertainty. Although it is not evident from figure 6, the total segregation force for both
  $c_l=0.2$ and
  $c_l=0.8$ sums to one as expected from (3.4).

Figure 6. Segregation force profiles for  $\hat {F}_l={F_l}/m_lg_0$ (blue circles) and
  $\hat {F}_s={F_s}/m_sg_0$ (red triangles) with
  $R=2$ for the exponential velocity profile with bulk large-particle concentrations (a)
  $c_l=0.2$ and (b)
  $c_l=0.8$, based on the imposed velocity profiles (dashed lines) and the measured profiles (solid curves) compared with DEM measurements (symbols) averaged over 2 s in steady state. Vertical dotted lines indicate the value about which
  $\hat {F}_{l}$ and
  $\hat {F}_{s}$ balance according to (3.4). Error bars indicate DEM data standard deviation. Shaded bands represent the uncertainty of the segregation force calculated from the measured flow profiles.
Up to this point and in all cases, we start with a uniform concentration of small and large particles in the flow domain, apply a spring-like restoring force to the particles within each layer to maintain the fully mixed condition, and measure the local segregation force for each particle type, as outlined in the context of figure 2. However, the same approach can also be applied when the concentration varies with depth. Here, we consider this situation with controlled linear and exponential velocity profiles with gravity, i.e. the flows shown in figure 3(a,d).
Three large-particle concentration profiles are considered (with  $c_s=1-c_l$), as shown in figure 7(a): increasing
  $c_l$ with depth, decreasing
  $c_l$ with depth and decreasing
  $c_l$ in the top half of the flow and increasing
  $c_l$ in the bottom half of the flow. In all three cases, the solid volume fraction
  $\phi$ is nearly constant. Note that the concentration profiles in the first two cases (figure 7a(i),(ii)) are slightly nonlinear due to packing that occurs after initially filling the system with a linearly varying concentration of particles, and, in all cases, a slight wall exclusion effect is evident in
  $c_l$, as expected. Also, as a result of the non-trivial dependence of
  $c_l$ and
  $c_s$ on
  $z$, it is not possible to determine the model-predicted values of
  $\hat {F}_i$ based on the imposed velocity profiles, which are shown as dashed black curves in preceding figures.

Figure 7. Concentration, solid volume fraction and segregation force profiles for  $\hat {F}_l={F_l}/m_lg_0$ (blue) and
  $\hat {F}_s={F_s}/m_sg_0$ (red) at
  $R=2$ for large-particle concentrations varying with depth (a). Segregation force profiles for large (circles) and small (triangles) particles in a controlled uniform shear flow with gravity (b) and an exponential velocity profile with gravity (c) with the same conditions as in figure 4. Here
  $\hat {F}_i$ is based on the measured profiles (solid curves) as well as DEM measurements (symbols) averaged over 2 s in steady state. Vertical dotted lines indicate the value about which
  $\hat {F}_{l}$ and
  $\hat {F}_{s}$ balance when weighted by the concentration according to (3.4). Note that the truncated data point in (c,iii) near
  $z/H=0$ with
  $\hat F_s=-3.12$ nearly matches the model prediction of
  $-$2.72 (red curve) within the range of uncertainty.
When the concentration of large particles increases with depth (column (i)), the predicted segregation forces match the measured forces for both the linear (figure 7b(i)) and exponential (figure 7c(i)) velocity profiles. Specifically, for the linear velocity profile (figure 7b(i)),  $\hat {F}_l$ remains slightly above one through the entire depth, but
  $\hat {F}_s$ decreases further below one with increasing depth, particularly for small
  $z/H$. This is consistent with the fact that the segregation velocity of a species increases as its local concentration decreases for most segregation velocity models (Jones et al. Reference Jones, Isner, Xiao, Ottino, Umbanhowar and Lueptow2018) and experimental scalings (Trewhela, Ancey & Gray Reference Trewhela, Ancey and Gray2021) – as
  $c_l$ increases with depth, the segregation velocity of small particles increases. However, the segregation force is not restricted to have the same trend as the segregation velocity because the segregation velocity results from the imbalance of all forces acting on a particle including the drag force, which we do not consider here. The segregation forces are larger for the exponential velocity profile (figure 7c(i)). For both velocity profiles, the model predictions based on the measured concentration and flow fields match the DEM measurements of the segregation force. Note that the measured segregation force,
  $\hat {F}_i$, has large uncertainty when
  $c_i$ is small due to the small number of associated particles available for averaging at low concentrations.
When the large-particle concentration decreases with depth (column (ii)), again  $\hat {F}_l>1$ and
  $\hat {F}_l$ increases deeper in the bed where
  $c_l$ is smaller, particularly for the exponential velocity profile (figure 7c(ii)). As in column (i),
  $\hat {F}_s<1$. The model prediction matches the DEM measurement reasonably well for both the linear and exponential velocity profiles. Similarly for the
  $c_l$ profile with a minimum at
  $z/H=0.5$ (column (iii)), the model prediction matches the measured segregation force reasonably well, even with large changes in the concentration gradient. For all cases in figure 7, (3.4) is satisfied locally.
Unlike flows with uniform particle concentrations, particles in flows with depth-varying concentration profiles tend to diffuse toward a uniform concentration state in the absence of segregation forces. In this case, the force-measurement-imposed restoring forces balance not only the segregation forces but also the remixing/diffusive forces, consequently influencing the measurement of the segregation force. However, the fact that the segregation force model (3.3) still predicts the measured segregation force reasonably well for cases in figure 7 indicates that the concentration gradients have negligible impact for these cases. The possible effects of diffusion on the restoring force approach are further discussed in the supplementary material.
Overall, it is evident that the concentration-dependent segregation force model (3.3), which relies on the intruder segregation-force-based model (1.2), can estimate segregation even when the concentration fields are spatially varying. Additionally, this prediction capability implies that the segregation force is relatively insensitive to concentration gradients.
4.3. Natural shear flows
As demonstrated above, the intruder segregation force model (1.2) with gravity- and kinematics-driven terms can be extended to apparently arbitrary concentrations and concentration fields via (3.3) in a variety of flows where the velocity field is artificially controlled. We now examine four uncontrolled wall- or gravity-driven flows illustrated in figure 3(e–h) in which the velocity field develops naturally via the boundary conditions and gravity-induced body forces. Of note in the three examples with gravity (figure 3f–h) is the direction of gravity with respect to the flow, which is characterized by the angle of the bottom wall with respect to horizontal,  $\theta$. For wall-driven flow,
  $g$ is perpendicular to the flow direction (in
  $z$), such that
  $\theta =0$; for inclined chute flow,
  $\theta$ is greater than or equal to the critical angle for flow to occur; and for vertical chute flow,
  $g$ is parallel to
  $z$, such that
  $\theta =\pi /2$ and
  $\partial P/\partial z=0$.
As in the analysis of the controlled-velocity flow fields in the previous sections, we first plot dimensionless depth profiles of  $u$,
$u$,  $\dot \gamma$,
  $\partial \dot \gamma /\partial z$,
  $p$,
$p$,  $c_l$ and
  $\phi$ with
  $c_l=c_s=0.5$ for the natural flows, as shown in figure 8. The kinematic terms are scaled with
  $g_0$ and
  $H$, since there is no intrinsic velocity scale for the vertical- or inclined-chute cases. We use
  $R=1.5$ here to test a third size ratio (similar results for these natural flows are achieved for other size ratios).

Figure 8. Scaled flow fields of natural shear flows with  $R=1.5$,
  $d_l=4$ mm,
  $d_s=8/3$ mm,
  $\rho _l=\rho _s=1$ g cm
 $^{-3}$. Plane shear (i) without and (ii) with gravity, (iii) vertical chute and (iv) inclined chute. Here
  $H\approx 0.2\ \mathrm {m}=50d_l$ for wall-bounded cases and fixed
  $H=0.2$ m for vertical chute case,
  $g=g_0=9.81$ m s
 $^{-2}$, and
  $\theta =28^{\circ }$ for the inclined chute. Applied overburden pressure
  $P_0=\rho \phi g_0H$ (i,ii). Depth-averaged pressure for the vertical chute
  $P_0=0.89\rho \phi g_0H$ (iii). In (e)
  $c_l$ data symbols are coloured and
  $\phi$ data symbols are black.
Consider first the wall-driven flow without gravity (column (i)). The velocity profile is nearly linear with depth, except for a slight deviation near the lower wall which is amplified for  $\dot \gamma$ and
  $\partial \dot \gamma /\partial z$. The slightly asymmetric velocity profile near the top and bottom walls is due to the top wall being able to move vertically to accommodate dilation during flow, while the bottom wall is fixed vertically. The profiles of pressure and solid volume fraction,
  $\phi$, are nearly constant, while the concentration profile shows small deviations from its mean value near the walls. With gravity (column (ii)), the wall-driven flow velocity profile is steep near the upper moving wall at
  $z/H=1$ but flattens in the bottom half of the flow where the pressure is higher. This results in
  $\dot \gamma$ and
  $\partial \dot \gamma /\partial z$ decreasing near the bottom of the flow. At the same time the pressure increases linearly with depth, and the pressure gradient is nearly constant. There is a small increase in
  $\phi$ with depth as particles near the bottom wall dilate less due to the larger local overburden pressure.
The vertical chute flow (column (iii)) has a plug-like velocity profile, resulting in  $\dot \gamma$ varying from negative to positive with depth, while
  $\partial \dot \gamma /\partial z \leq 0$ with widely varying values. The pressure remains nearly constant at
  $P_0 \approx 0.89\rho \phi g_0 H$, while the solid volume fraction decreases near the walls compared with the centre of the chute, as observed previously (Fan & Hill Reference Fan and Hill2011b). Despite the restoring force to prevent segregation,
  $c_l$ varies somewhat in the region where
  $\dot {\gamma }$ is non-zero. Finally, the curvature of the velocity profile for the inclined chute with
  $\theta =28^{\circ }$ (column (iv)) is opposite that of the wall-driven flow with gravity (column (ii)). Consequently,
  $\dot \gamma$ increases with depth, while
  $\partial \dot \gamma /\partial z$ is negative, except near the bottom wall, and relatively small through most of the depth compared to the other two flows with gravity. Like the wall-driven case with gravity,
  $p$ increases with depth, but is zero at the free surface, and
  $\rho g H \cos {\theta } < \rho g H$ at the base of the flow. The solid volume fraction is independent of depth.
Model predictions of  $\hat {F}_i$ for the four natural shear flows are shown in figure 9. Unlike the flows with controlled velocity profiles, these predictions are based only on flow profiles calculated from the DEM simulations (solid coloured curves), since there is no imposed velocity profile to consider. For the wall-driven shear flow without gravity (column (i)), the DEM measured forces match the nominal value of zero and the model predictions, except near the bottom wall where
  $\hat {F}_l$ is negative and
  $\hat {F}_s$ is positive for the DEM measurements due to wall effects evident in column (i) of figure 8. However, it is notable that the model reflects the measured non-zero forces at the bottom wall reasonably well. For the wall-driven shear flow with gravity (column (ii)), the DEM measured forces and the model prediction show the same trends – increasing with depth in the upper portion of the flow and then decreasing, changing sign, and reaching a relatively larger amplitude near the lower wall. The match is not as good in the lower portion of the flow as in the upper portion.

Figure 9. Segregation force profiles for  $\widehat {F_l}=F_{l}/m_lg_0$ (a) and
  $\widehat {F_s}=F_{l}/m_sg_0$ (b) in natural shear flows for
  $c_l=c_s=0.5$ and
  $R=1.5$ based on model predictions using measured flow fields in figure 8 (solid coloured curves) and DEM measurements (symbols) time averaged over 2 s after the flows reach steady state. Note the different horizontal axes limits in (a,b). Error bars indicate the standard deviation. Shaded bands represent the uncertainty of the segregation force calculated from the measured profiles. (c) Inertial number profiles,
  $I$.
$I$.
For the vertical chute flow (column (iii)), the model-predicted forces match the DEM measurements near the walls (within  $0.2H$), which is where the shear rate is non-zero and the inertial number is not too small (figure 9c(iii)). In the central portion of the chute where the flow is plug-like,
  $\dot \gamma \approx 0$,
  $\partial \dot \gamma /\partial z \approx 0$ and
  $I \approx 0$, the model correctly predicts the change in the direction of the segregation force from
  $z/H \approx 0.3$ to
  $z/H \approx 0.7$, but with extremely large uncertainty between these two heights and with much larger predicted forces than the DEM measurements. This large deviation is likely due to a breakdown of the model validity due to the corresponding very low inertial number (figure 9c(iii)) and the singularity in the kinematics term in (1.2c) associated with
  $\dot \gamma \to 0$. Lastly, the model prediction shows the same trends as the DEM measurements for the inclined chute flow (column (iv)). The model underestimates the measured segregation forces for
  $z/H>0.2$ where the measured segregation forces are small and noisy, but matches the data well near the bottom wall (
 $z/H<0.2$) where
  $\hat {F_l}$ and
  $\hat {F_s}$ are largest. In all cases, the sum of the segregation force across the two species is satisfied per (3.4).
While the correspondence between the model predictions and DEM measurements of the segregation forces in these four natural flows is less satisfying than that for the controlled flows, these results nevertheless demonstrate that the intruder force model of (1.2) can be applied to bidisperse mixtures with reasonable accuracy using (3.1) and (3.3), except in regions where  $\dot \gamma \approx 0$.
5. Conclusions
Predicting the segregation force on single-intruder particles, not to mention the more difficult problem of particles in mixtures, in granular flows confounded researchers for decades until the virtual spring approach pioneered by Guillard et al. (Reference Guillard, Forterre and Pouliquen2016) allowed it to be directly measured. Using that method, we established the dependence of the segregation force on gravity and local kinematics for an intruder particle in three-dimensional granular flow of spherical particles via (1.2) and (3.1) (Jing et al. Reference Jing, Ottino, Lueptow and Umbanhowar2021). We then extended the virtual spring measurement method to allow measurement of segregation forces in finite-concentration size-bidisperse mixtures with pressure gradients via (1.3) (Duan et al. Reference Duan, Jing, Umbanhowar, Ottino and Lueptow2022). Here, we further extend the model for the combined gravity- and kinematics-induced segregation force on an intruder particle (1.2) to arbitrary concentrations of size-bidisperse particle mixtures, (3.3), by applying the concentration dependence described by (1.3) to both gravity- and kinematics-induced components of the segregation force. We use an extensive set of DEM simulations to show that the approach can estimate the segregation force in four idealized flows with an artificially controlled velocity profile as well as four natural shear- and gravity-driven flows (subject to minor deviations near walls for wall-driven flows and for very small inertial numbers).
Considering the dependence of the segregation force on the particle size ratio, the velocity field and its gradients, the pressure field and its gradients and the relative concentrations of the two particle species, the performance of the model, i.e. (1.2), (3.1) and (3.3), is remarkable. In all the situations that we consider, it is possible to estimate the local spatial- and concentration-dependent segregation force on small and large particles starting only with a knowledge of particle size ratio and the flow conditions, of which the latter can be based on theory or measurement.
Given the broad range of conditions considered here, this approach is likely generally applicable to a wide range of size-bidisperse granular flows at inertial numbers typical of dense flows, although kinetic-theory-based approaches for segregation may be appropriate where granular temperature gradients play a significant role (Larcher & Jenkins Reference Larcher and Jenkins2015; Neveu et al. Reference Neveu, Larcher, Delannay, Jenkins and Valance2022). In fact, the success of the combined models of (1.2), (3.1) and (3.3) demonstrated here for size-bidisperse flows suggests that it is possible to extend the approach to polydisperse and density disperse flows, as well as combined size and density segregation, particularly since the effects of both particle size and density are accounted for by the intruder segregation force (Jing et al. Reference Jing, Ottino, Lueptow and Umbanhowar2020, Reference Jing, Ottino, Lueptow and Umbanhowar2021). For example, density differences can be considered in (1.1) through the pressure term, which is an integral over species concentration and density, i.e.  $p=\int _0^z{ {\phi (c_l\rho _l+c_s\rho _s)g(H-z)}}+P_0$. This would allow the prediction of combined size and density segregation, although further validation work is necessary. Furthermore, friction coefficients measured from experiments can be notably low compared with DEM simulations, i.e.
  $\mu \approx 0.1$ for soda-lime glass (Foerster et al. Reference Foerster, Louge, Chang and Allia1994). More research is needed under even more widely varying conditions to refine the segregation force model, particularly with respect to low friction coefficients (
 $\mu <0.2$).
The accurate predictions of the segregation force model detailed in this paper are an important piece in the puzzle of predicting segregation in size-disperse granular flows. Although the overall segregation fluxes under many conditions can be predicted via continuum models (Schlick et al. Reference Schlick, Isner, Freireich, Fan, Umbanhowar, Ottino and Lueptow2016; Xiao et al. Reference Xiao, Umbanhowar, Ottino and Lueptow2016; Duan et al. Reference Duan, Umbanhowar, Ottino and Lueptow2021), accuracy is predicated on knowledge of the dependence of the segregation velocity for each species as a function of relative size or density (Umbanhowar et al. Reference Umbanhowar, Lueptow and Ottino2019). In addition to the segregation force considered here, another important piece needed for predicting the segregation velocity is the drag force on an intruder particle moving through sheared granular beds, which was recently shown to be Stokes-like across a wide range of conditions (Jing et al. Reference Jing, Ottino, Umbanhowar and Lueptow2022). A simple force balance on an intruder particle incorporating both the segregation force and the drag force allows prediction of the segregation velocity, which is a crucial element in continuum models for predicting overall segregation in granular flows (Umbanhowar et al. Reference Umbanhowar, Lueptow and Ottino2019). This is clearly an appropriate direction for further research.
Supplementary material
Supplementary material is available at https://doi.org/10.1017/jfm.2024.483.
Acknowledgements
We are grateful for helpful discussions with Y. Fan and J. Hecht.
Funding
This material is based upon work supported by the National Science Foundation under grant no. CBET-1929265. L.J. gratefully acknowledges financial support provided by the Open Research Fund Program of State Key Laboratory of Hydroscience and Engineering (sklhse-2023-B-07).
Declaration of interests
The authors report no conflict of interest.


