Impaired emotion identification has been repeatedly demonstrated in patients with schizophrenia (Reference Dougherty, Bartlett and IzardDougherty et al, 1974; Reference Kerr and NealeKerr & Neale, 1993; Reference BorodBorod, 2000; Reference Edwards, Pattison and JacksonEdwards et al, 2001; Reference Silver, Shlomo and TurnerSilver et al, 2002) and may contribute to the dysfunction in social communication observed in this population (Reference Hooker and ParkHooker & Park, 2002; Reference Pinkham, Penn and PerkinsPinkham et al, 2003). However, several findings require further clarification. We therefore examined emotion recognition impairments in schizophrenia in order to determine whether: (a) these were independent of any deficits in the identification of non-emotional facial and vocal stimuli; (b) the magnitudes of positive and negative emotion recognition impairments in either modality were comparable; (c) these impairments were stable or progressive; (d) these impairments were significantly correlated with symptom severity, demographic factors or neuroleptic dose.
METHOD
Participants
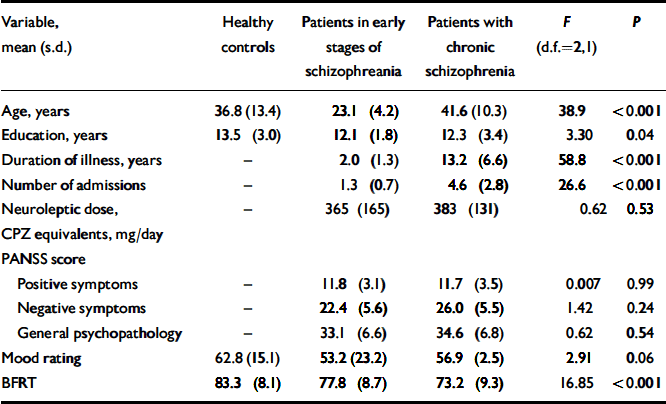
Participants were 100 in-patients from Lublin University Psychiatric Hospital with schizophrenia in remission (diagnosed on the basis of clinical interview according to DSM–IV criteria; American Psychiatric Association, 1994); 50 patients (25 male) were recruited during the first or second episode of illness (≤2 episodes; mean duration of illness=2.0 years (s.d.=1.3)) and 50 (26 male) during later stages of illness (>2 episodes; mean duration of illness=13.2 years (s.d.=6.6)). All patients were clinically stable after 4 weeks of neuroleptic treatment (65% atypical antipsychotics) and were aged between 18 and 60 years. The mean daily dose in chlorpromazine equivalents was 365 mg (s.d.=165).
The 30-item Positive and Negative Syndrome Scale (PANSS; Reference Kay, Opler and FiszbeinKay et al, 1987) was administered to all patients by a trained rater (K. K.-P.) at the time of recruitment (Table 1). Controls were 50 healthy individuals (24 male; mean age=36.8 years (s.d.=13.4)) with no history of psychiatric illness recruited from the non-professional staff at Lublin University Medical School and Lublin Psychiatric Hospital.
Table 1 Demographic and clinical data for the three groups

| Variable, mean (s.d.) | Healthy controls | Patients in early stages of schizophreania | Patients with chronic schizophrenia | F (d.f.=2,1) | P |
|---|---|---|---|---|---|
| Age, years | 36.8 (13.4) | 23.1 (4.2) | 41.6 (10.3) | 38.9 | <0.001 |
| Education, years | 13.5 (3.0) | 12.1 (1.8) | 12.3 (3.4) | 3.30 | 0.04 |
| Duration of illness, years | – | 2.0 (1.3) | 13.2 (6.6) | 58.8 | <0.001 |
| Number of admissions | – | 1.3 (0.7) | 4.6 (2.8) | 26.6 | <0.001 |
| Neuroleptic dose, CPZ equivalents, mg/day | – | 365 (165) | 383 (131) | 0.62 | 0.53 |
| PANSS score | |||||
| Positive symptoms | – | 11.8 (3.1) | 11.7 (3.5) | 0.007 | 0.99 |
| Negative symptoms | – | 22.4 (5.6) | 26.0 (5.5) | 1.42 | 0.24 |
| General psychopathology | – | 33.1 (6.6) | 34.6 (6.8) | 0.62 | 0.54 |
| Mood rating | 62.8 (15.1) | 53.2 (23.2) | 56.9 (2.5) | 2.91 | 0.06 |
| BFRT | 83.3 (8.1) | 77.8 (8.7) | 73.2 (9.3) | 16.85 | <0.001 |
All participants were right-handed (Reference AnnettAnnett, 1970). Exclusion criteria included the presence of a neurological disorder (e.g. epilepsy, dementia), habitual drug or alcohol misuse and cognitive impairment (a minimum score <24 out of 30 on the Mini-Mental State Examination; Reference Folstein, Folstein and McHughFolstein et al, 1975). Those who had difficulties with vision (including poor acuity and lack of correction) or hearing (threshold greater than 35 dB at any frequency using a free-field voice test; Reference BrowningBrowning, 1998) were also excluded. Informed consent was obtained prior to participation in the study. Approval for the study was obtained from the ethics committee of the Psychiatry Department of Lublin University Medical School. Six patients with schizophrenia who volunteered to take part in the study were not included in the final sample because either they were unable to complete the full set of tests owing to akathisia (three) or agitation (one) or they were discharged before completing the three experimental sessions (two).
Procedures
All participants undertook three facial recognition tasks and an emotion prosody task on three separate occasions. Individuals rated their mood at the time of testing on a 10 cm scale ranging from ‘most depressed ever’ on the extreme left (scoring 0) to ‘most happy ever’ on the right (scoring 100). The midpoint was not indicated on the scale (Reference DavidDavid, 1989).
Facial Emotion Recognition Test
The Facial Emotion Recognition Test (FERT) consists of a set of 36 photographs of human ‘emotional’ faces standardised and cross-validated on an independent group of healthy volunteers. These photographs were presented in slide form on the screen for approximately 10 s each, with an interval of 10 s between photographs. The projector was positioned 2 m away from the participant. Before this test, participants were provided with a written list and definitions of nine fundamental emotions: interest/excitement, enjoyment/joy, surprise/startle, distress/anguish, disgust, contempt, anger/rage, shame/humiliation, fear/terror, and were asked to study the names and definitions. After each slide participants selected the one emotion from the list that best described the photograph and wrote the number of this photograph in the appropriate space under the defined emotion category (Reference IzardIzard, 1971). The order of the items in both emotion facial tasks was randomised across participants.
Benton Facial Recognition Test
The Benton Facial Recognition Test (BFRT) is a standardised objective procedure for the assessment of the ability to identify and discriminate photographs of unfamiliar, non-emotional human faces. The long version of the test, comprising 54 response items, was employed in this study (Reference Benton, Sivan and HamsherBenton et al, 1994).
Voice Emotion Recognition Test
In the Voice Emotion Recognition Test (VERT) participants were presented with a series of five semantically neutral sentences (e.g. ‘In winter there are short days and long nights’, ‘They will go first, the others will follow them’).
Each sentence was spoken aloud by a professional male actor in such a manner as to convey one of the six basic emotions: happiness, sadness, fear, anger, surprise and disgust, in addition to a neutral tone of voice. Thirty-five sentences were recorded, digitised and normalised for average amplitude in a recording studio. Each of five sentences was presented in the six emotional and neutral states in a randomised order (interstimulus interval=7 s; total time=20 min). Participants listened to each sentence then circled on an answer sheet which of the six emotions or neutral state best described the speaker's tone of voice. The presentation order of all 35 sentences was randomised across participants. Internal consistency was determined on a sample of 101 students (48 males; mean age=34.2 (s.d.=3.2) years) on which the test was first validated (Cronbach's α=0.614). Retest was performed after 3 days under the same experimental conditions; test–retest reliability was 0.96 (Reference Kucharska-Pietura, Phillips and GernandKucharska-Pietura et al, 2003).
Analyses
The emotion items were grouped into two valence categories. Happiness (enjoyment), interest and surprise were categorised as ‘positive’ and sadness (distress), anger, fear, shame, contempt and disgust as ‘negative’ for both facial and vocal stimuli (Reference IzardIzard, 1971). The mean recognition accuracy (percentage correct) was computed for each valence category for each stimulus type for each group of participants. A repeated-measures analysis of variance (ANOVA) was employed to determine the main effects of group, emotion category and individual emotion, and interactions between these factors, on both facial and vocal tasks. Post hoc Tukey tests were then employed to examine specific differences in performance between groups. The influence of independent variables (e.g. age, education and current mood) on the performance of the perception tasks was controlled via analyses of covariance (ANCOVAs). Finally, Pearson correlations were performed between mean accuracy scores and clinical variables (e.g. PANSS score, neuroleptic dose, number of admissions).
RESULTS
Clinical and demographic data
Patients in the early stages of schizophrenia were significantly younger than healthy controls (P<0.001); there was no significant age difference between patients with chronic schizophrenia and healthy controls (P=0.90). Furthermore, healthy controls had more years of education than patients in the early stages of illness (P<0.05); other group comparisons were not statistically significant (Table 1).
Benton Facial Recognition Test
Analysis of variance revealed a main effect of group on performance on this task (F=16.85; d.f.=2,147; P<0.001). Patients in later stages of schizophrenia were less accurate than those in the early stages of illness (mean difference=4.63; P<0.05) and healthy controls (mean difference=10.18; P<0.001); patients in the early stages of schizophrenia were more impaired than healthy controls (mean difference=5.55; P<0.01; Table 1).
Analysis of covariance (mean score as dependent variable) were carried out with age, education and current mood as covariates. The effect of group upon performance on this test remained highly significant (F=16.17; d.f.=2,15; P<0.001) after controlling for these covariates. Years of education, current mood, severity of illness, neuroleptic dose, duration of illness and number of prior admissions did not correlate significantly with mean BFRT score in patients. Performance of males and females did not differ significantly on this test in any of the groups.
Facial Emotion Recognition Test
The effect of group
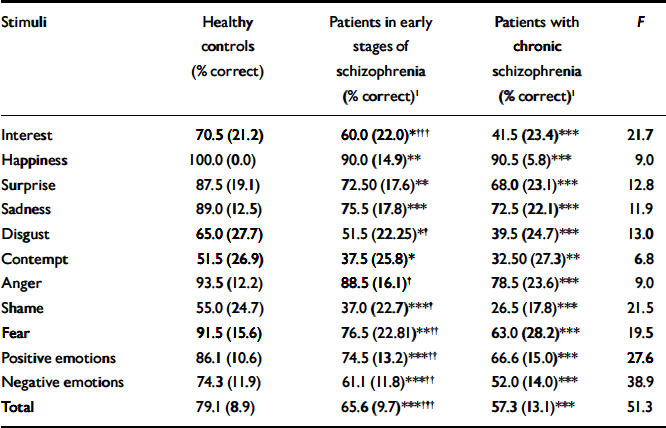
A significant main effect of group was found for performance on the FERT (F=51.34; d.f.=2,147; P<0.001). Patients in later stages of schizophrenia demonstrated a significantly greater impairment in their recognition of facial emotions compared with those in the early stages of illness (mean difference=8.33; P<0.001) and healthy controls (mean difference=21.74; P<0.001). A significantly greater impairment was found in patients in the early stages of schizophrenia compared with healthy controls (mean difference=13.41; P<0.001; Table 2).
Table 2 Facial expression recognition accuracy for the three groups

| Stimuli | Healthy controls (% correct) | Patients in early stages of schizophrenia (% correct)1 | Patients with chronic schizophrenia (% correct)1 | F |
|---|---|---|---|---|
| Interest | 70.5 (21.2) | 60.0 (22.0)*††† | 41.5 (23.4)*** | 21.7 |
| Happiness | 100.0 (0.0) | 90.0 (14.9)** | 90.5 (5.8)*** | 9.0 |
| Surprise | 87.5 (19.1) | 72.50 (17.6)** | 68.0 (23.1)*** | 12.8 |
| Sadness | 89.0 (12.5) | 75.5 (17.8)*** | 72.5 (22.1)*** | 11.9 |
| Disgust | 65.0 (27.7) | 51.5 (22.25)*† | 39.5 (24.7)*** | 13.0 |
| Contempt | 51.5 (26.9) | 37.5 (25.8)* | 32.50 (27.3)** | 6.8 |
| Anger | 93.5 (12.2) | 88.5 (16.1)† | 78.5 (23.6)*** | 9.0 |
| Shame | 55.0 (24.7) | 37.0 (22.7)***† | 26.5 (17.8)*** | 21.5 |
| Fear | 91.5 (15.6) | 76.5 (22.81)**†† | 63.0 (28.2)*** | 19.5 |
| Positive emotions | 86.1 (10.6) | 74.5 (13.2)***†† | 66.6 (15.0)*** | 27.6 |
| Negative emotions | 74.3 (11.9) | 61.1 (11.8)***†† | 52.0 (14.0)*** | 38.9 |
| Total | 79.1 (8.9) | 65.6 (9.7)***††† | 57.3 (13.1)*** | 51.3 |
The effect of valence
Mean recognition accuracy was computed for both valence categories (positive and negative) for the FERT. There was a main effect of valence for recognition (F=144.93; d.f.=1,147; P<0.001), with mean accuracy scores higher for positive emotions (Table 2).
Individual emotions
Over all participants, there was a significant main effect for expression on the recognition task (F=132.37; d.f.=8,140; P<0.001). There was a significant interaction between group and facial expression on the recognition task (F=2.62; d.f.=16,280; P<0.01).
Taken together, these findings indicated that patients in the early and later stages of schizophrenia were more impaired on the FERT for both positive and negative expressions than healthy controls, and that those with chronic schizophrenia were generally more impaired than those in the early stages of illness (Table 2).
BFRT performance, clinical and demographic variables as covariates and gender effect
Analyses of covariance were carried out to determine whether in patients with schizophrenia the impairment on the FERT occurred independently of the impairment on the BFRT, and with clinical and demographic variables (age, current mood and years of education) as covariates. The main effect of group remained highly significant even after controlling for variables (F=32.77; d.f.=2,149; P<0.001), for the recognition of positive (F=21.40; d.f.=2,149; P<0.001) and negative (F=24.72; d.f.=2,149; P<0.001) emotions.
There were no significant correlations between PANSS score, illness course, or neuroleptic dose and performance on the FERT in either patient group.
After covarying for the above factors, univariate analysis of variance was performed to determine the effect of gender upon performance on the FERT. This revealed a main effect of gender on the overall performance on the FERT (F=15.44; d.f.=1,149; P<0.001). Overall, females were more accurate than males on the FERT (t=3.74; d.f.=148; P<0.001). There were also t-test gender differences among patients in the early stages of schizophrenia and healthy volunteers, but not among those with chronic schizophrenia, with females in the early stages of illness and female controls more accurate on the test than the males in each group (t=2.12; d.f.=48; P<0.05 and t=6.49; d.f.=48; P<0.001).
Voice Emotion Recognition Test
Effect of group
One-way ANOVA revealed a main effect of group (F=108.77; d.f.=2,147; P<0.001) on the total performance on the VERT.
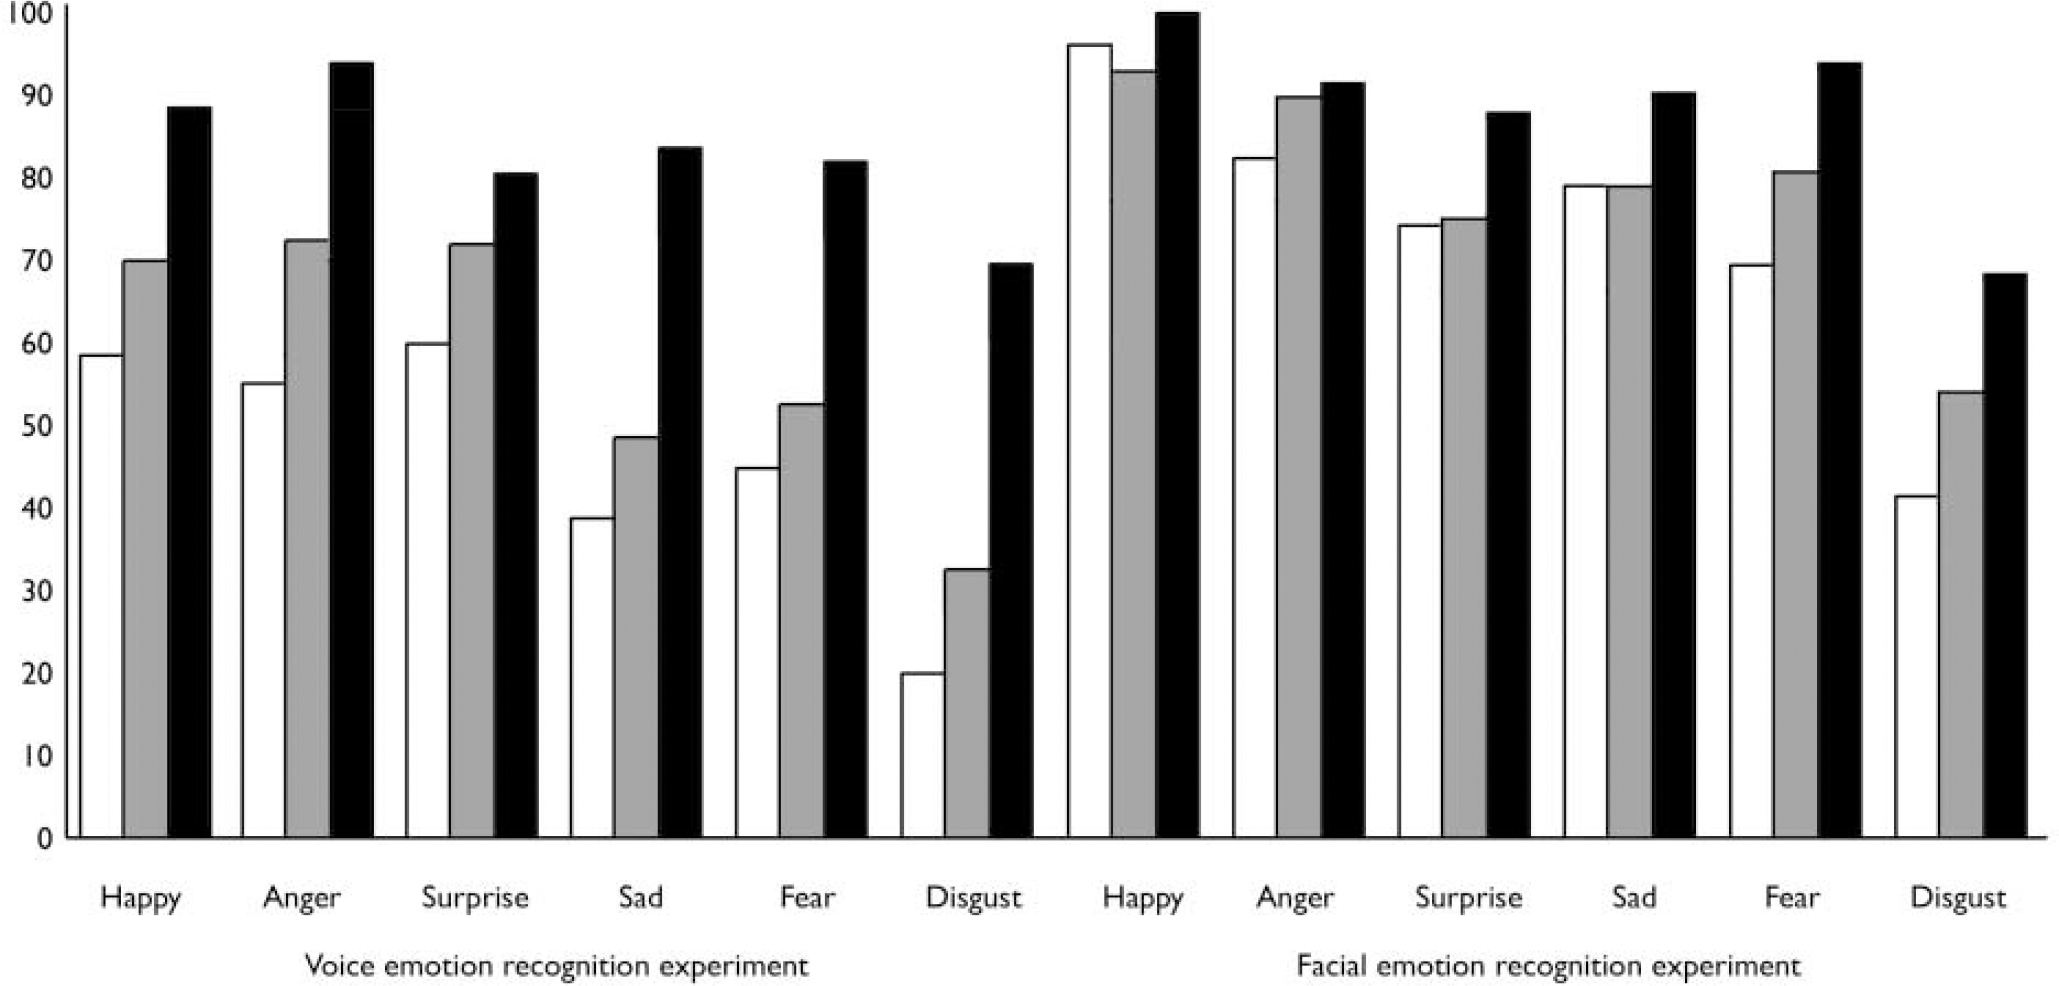
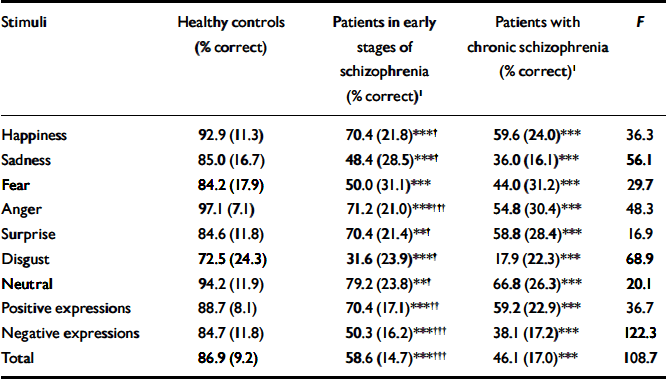
Patients with chronic schizophrenia were significantly more impaired than patients in the early stages of illness (mean difference=12.62; P<0.001), and both patient groups were significantly more impaired than healthy controls (mean difference>27.94; P<0.001 for both comparisons) on this task (Table 3; Fig. 1).

Fig. 1. Facial and vocal emotion recognition (% correct) in healthy controls (▪), patients in early stages of schizophrenia (▒) and patients in late stages of illness (□).
Table 3 Prosody recognition accuracy for the three groups

| Stimuli | Healthy controls (% correct) | Patients in early stages of schizophrenia (% correct)1 | Patients with chronic schizophrenia (% correct)1 | F |
|---|---|---|---|---|
| Happiness | 92.9 (11.3) | 70.4 (21.8)***† | 59.6 (24.0)*** | 36.3 |
| Sadness | 85.0 (16.7) | 48.4 (28.5)***† | 36.0 (16.1)*** | 56.1 |
| Fear | 84.2 (17.9) | 50.0 (31.1)*** | 44.0 (31.2)*** | 29.7 |
| Anger | 97.1 (7.1) | 71.2 (21.0)***††† | 54.8 (30.4)*** | 48.3 |
| Surprise | 84.6 (11.8) | 70.4 (21.4)**† | 58.8 (28.4)*** | 16.9 |
| Disgust | 72.5 (24.3) | 31.6 (23.9)***† | 17.9 (22.3)*** | 68.9 |
| Neutral | 94.2 (11.9) | 79.2 (23.8)**† | 66.8 (26.3)*** | 20.1 |
| Positive expressions | 88.7 (8.1) | 70.4 (17.1)***†† | 59.2 (22.9)*** | 36.7 |
| Negative expressions | 84.7 (11.8) | 50.3 (16.2)***††† | 38.1 (17.2)*** | 122.3 |
| Total | 86.9 (9.2) | 58.6 (14.7)***††† | 46.1 (17.0)*** | 108.7 |
The effect of valence
There was a main effect of valence on the task (F=157.67; d.f.=1,147; P<0.001), with mean accuracy scores ordered as positive and negative vocal expressions (Table 3; Fig. 1). There was a significant group-by-valence interaction (F=21.64; d.f.=2,147; P<0.001; Table 3).
Individual emotions
There was a significant interaction between group and the categories of vocal expression (F=5.25; d.f.=10, 286; P<0.001).
Both groups of patients were significantly impaired compared with healthy controls in the identification of all vocal expressions (P<0.001 for all comparisons between each patient group and healthy controls), but patients in the later stages of schizophrenia were significantly more impaired than those in the early stages in the identification of all vocal expressions except fear (P<0.34; Table 3).
Neutral tone and clinical and demographic variables as covariates
When the neutral tone of voice, age, years of education and current mood were taken into account, the effect of group remained highly significant (F=72.25; d.f.=2,149; P<0.001). The adjusted mean difference between patients with chronic schizophrenia and those in the early stages of illness was -7.12 (95% CI -12.39 to -1.85); the difference between those with chronic schizophrenia and healthy controls was -28.78 (95% CI -33.60 to -23.88) and that between patients in the early stages of schizophrenia and healthy controls was -21.60 (95% CI -26.93 to -16.38).
Furthermore, the main effect of group remained highly significant after controlling for all these variables for recognition of positive (F=14.16; d.f.=2,149; P<0.001) and negative emotions (F=77.13; d.f.=2,149; P<0.001).
Pearson correlations between the mean score on the VERT and neuroleptic dose, PANSS score, duration of illness, and number of prior admissions were not significant in either of the two patient groups.
Finally, there was no significant effect of gender on VERT performance after covarying for the above variables (F=1.76; d.f.=1,149; P=0.18).
Correlation between facial and vocal emotion recognition tasks
After covarying for the above variables, correlational analyses were performed to examine any association between performance on facial and vocal emotion recognition tests. A significant but small positive correlation between performance on the FERT and VERT was found in each group (patients with early schizophrenia: Pearson's r=0.27; P=0.05; patients with chronic schizophrenia: Pearson's r=0.39; P=0.005; healthy controls: Pearson's r=0.46; P=0.001). Further correlation matrices were constructed to examine the strength of association between processing of individual emotion categories in the two modalities (i.e. facial and vocal emotion recognition). In the healthy control group the only significant cross-modal correlation was in the recognition of anger in faces and voices (r=0.49; P<0.01). In both patient groups there were no significant correlations between performance on individual emotion recognition in facial and vocal recognition tests.
DISCUSSION
We aimed to examine the nature of facial and vocal emotion recognition abnormalities in patients with schizophrenia at different stages of illness. Four major findings emerged from the study.
Cross-modal emotion recognition impairment
First, all patients with schizophrenia were impaired in the recognition of emotional and non-emotional facial and vocal stimuli, supporting findings from previous studies demonstrating a generalised perceptual deficit in schizophrenia (Reference Kerr and NealeKerr & Neale, 1993; Reference Mandal, Pandey and PrasadMandal et al, 1998; Reference Hooker and ParkHooker & Park, 2002). The deficit in emotion recognition in all patients with schizophrenia remained significant even after covarying for the impairment in non-emotional face and voice recognition, supporting previous data indicating a specific deficit in emotion identification in schizophrenia (Reference Silver, Shlomo and TurnerSilver et al, 2002). The presence of deficits in more than one sensory modality (Reference Kee, Kern and MarshallKee et al, 1998; Reference Edwards, Pattison and JacksonEdwards et al, 2001; Reference Hooker and ParkHooker & Park, 2002) suggests a cross-modal emotion processing deficit. The right hemisphere has been linked with face and emotion processing (Reference BorodBorod, 2000). Our findings may therefore suggest a role for right hemisphere dysfunction in schizophrenia.
Interestingly, there were only small positive correlations between the magnitude of the overall deficits in emotion recognition for stimuli of each sensory modality in both healthy controls and patients. These were not present for individual emotions in either group, however. It is therefore possible that different emotions are displayed and recognised more easily in different sensory modalities, e.g. happiness may be recognised more easily from a face than a voice.
Impairments in positive and negative emotion recognition
Second, patients with schizophrenia demonstrated marked impairments overall in the recognition of negative and positive emotions, consistent with some (Reference Schneider, Gur and GurSchneider et al, 1995) but not all previous findings (Reference Mandal, Pandey and PrasadMandal et al, 1998; Reference BorodBorod, 2000). We also examined the ability of patients with schizophrenia to identify individual emotions. Overall, all patients were significantly less accurate than healthy volunteers in recognising all emotional stimuli, but were relatively less impaired in the identification of happiness, particularly from faces. Others have also demonstrated greater accuracy in the recognition of happiness than negative emotions by patients with schizophrenia (Reference Dougherty, Bartlett and IzardDougherty et al, 1974), and a relatively greater impairment in the identification of negative compared with positive emotional stimuli in these patients in facial (Reference Mandal, Pandey and PrasadMandal et al, 1998) and non-visual modalities (Reference BorodBorod, 2000; Reference Edwards, Pattison and JacksonEdwards et al, 2001).
Greater impairment in later stages of illness
Third, our findings also demonstrated that patients in later stages of schizophrenia were significantly impaired compared with those in the early stages of illness and healthy controls (Reference Silver, Shlomo and TurnerSilver et al, 2002) in recognising all examined expressions. This suggests a progressive impairment in emotion identification in schizophrenia, which may have resulted from treatment with typical antipsychotics, institutionalisation or the illness itself. We concede, however, that only a prospective design would allow us to determine whether emotion perception deficits were truly progressive in schizophrenia. An alternative explanation is that individuals in later stages of illness represented a distinct subgroup of patients, and would support the presence of heterogeneity within schizophrenia rather than illness progression. These two possibilities are not mutually exclusive, however.
No correlation between symptom severity and emotion recognition deficits
Finally, we did not demonstrate significant correlations between performance on any of the emotion recognition tasks and the examined clinical variables. This might be explained by some recent models that advocate progressive, essentially neurodegenerative processes involving excitotoxicity in addition to neurodevelopmental processes (Reference Garver, Nair and ChristensenGarver et al, 1999). Here, illness duration rather than symptom ratings would then be predicted to be correlated with task performance deficits. We did not, however, demonstrate such a correlation either; rather we merely demonstrated that individuals in the later stages of illness were more impaired than those in earlier stages.
Deficits in emotion recognition and social dysfunction
We have provided evidence for the presence of pervasive deficits in emotion recognition in more than one sensory modality in schizophrenia, which appears to increase with illness chronicity. These deficits are not specifically related to positive or negative symptoms, medication or current mood state. Our results are some of the first to suggest that in schizophrenia there might be progressive emotion processing deficits, which appear to be unrelated to specific symptom profiles but may be responsible for the social dysfunction observed in people with this disorder.
Clinical Implications and Limitations
CLINICAL IMPLICATIONS
-
▪ Assessment of the magnitude of emotion perceptual deficits in facial and vocal modalities in schizophrenia can be employed as a measure of illness progression.
-
▪ These tests can be employed to examine the extent of heterogeneity within schizophrenia.
-
▪ Future study should examine the extent to which training in emotion perceptual tasks improves illness outcome in schizophrenia.
LIMITATIONS
-
▪ We employed static rather than dynamic facial expressions; the latter are more ecologically valid.
-
▪ We employed a cross-sectional comparison rather than a longitudinal, prospective design. The latter would more readily determine the extent to which the emotion processing deficits in schizophrenia were progressive.
-
▪ We were unable to assess in detail the potential effect of the type of antipsychotic treatment (atypical v. typical) on task performance.


eLetters
No eLetters have been published for this article.