


1. Introduction
The study of flow around porous bodies of infinite length has attracted considerable interest due to its significance in both engineering and environmental contexts. From an engineering perspective, the integration of porous structures into two-dimensional (2-D) bluff bodies has emerged as a notable passive flow control technique that promotes drag reduction (Klausmann & Ruck Reference Klausmann and Ruck2017; Geyer Reference Geyer2020), suppresses noise (Sato & Hattori Reference Sato and Hattori2021) and mitigates vortex-induced vibrations (Yuan et al. Reference Yuan, Laima, Gao, Chen and Li2021). Such aerodynamic benefits are crucial in the design of aircraft landing gear (Merino-Martínez, Kennedy & Bennett Reference Merino-Martínez, Kennedy and Bennett2021; Selivanov et al. Reference Selivanov, Silnikov, Markov, Popov and Pusev2021), high-speed train pantographs (Sueki, Ikeda & Takaishi Reference Sueki, Ikeda and Takaishi2009), offshore pipeline systems (Wen et al. Reference Wen, Jeng, Wang and Zhou2012) and the structural frameworks of unmanned aerial vehicles (Klippstein et al. Reference Klippstein, Hassanin, Diaz De Cerio Sanchez, Zweiri and Seneviratne2018). In these applications, porous materials are used either to coat the bodies or to construct them entirely from patterned obstructions, significantly altering the downstream wake dynamics. In environmental contexts, the flow around porous bodies is exemplified by emergent aquatic vegetation, often modelled as arrays of 2-D circular cylinders. These vegetative formations play a vital role in river ecosystems, providing habitats for wildlife, enhancing in water purification and influencing morphodynamic processes such as sediment deposition and erosion (Gacia & Duarte Reference Gacia and Duarte2001; Moore Reference Moore2004; Bouma et al. Reference Bouma, Van Duren, Temmerman, Claverie, Blanco-Garcia, Ysebaert and Herman2007).
As fluid flows past a 2-D porous cylinder, the wake structure is primarily governed by two parameters – porosity and permeability – which are intrinsically linked, reflecting the geometric features of the internal porous structure. Despite their interdependent nature, porosity often becomes the focal point in experimental studies as the primary control parameter for altering the aerodynamic or hydrodynamic characteristics of the cylinder, owing to its ease of manipulation. Open-cell foam is commonly selected as a porous material due to its advantageous high porosity and permeability levels (Inayat et al. Reference Inayat, Schwerdtfeger, Freund, Körner, Singer and Schwieger2011). Even with its complex and spatially non-uniform internal structure of open-cell foam, it offers uniform global porosity, quantified by the number of pores per inch. Previous experimental studies have utilized open-cell foam coatings on cylinders, successfully demonstrating significant drag, noise and vortex-induced vibration reductions correlating with increased porosity (Klausmann & Ruck Reference Klausmann and Ruck2017; Geyer Reference Geyer2020).
To broaden our understanding of wake manipulation by porosity, 2-D porous bodies with uniform and organized internal structures have been also investigated (Bathla & Kennedy Reference Bathla and Kennedy2020; Steiros, Bempedelis & Ding Reference Steiros, Bempedelis and Ding2021; Sun et al. Reference Sun, Azmi, Zhu, Zhou and Cheng2021; Xu et al. Reference Xu, Chang, Yu, Chen and Gao2022; Arcondoulis et al. Reference Arcondoulis, Liu, Ragni, Avallone, Rubio-Carpio, Sedaghatizadeh, Yang and Li2023). For example, Sun et al. (Reference Sun, Azmi, Zhu, Zhou and Cheng2021) experimentally explored wake characteristics behind a perforated metal cylinder varying with the porosity and reported a mutual interaction between the separated shear layers and the bleeding flow that alters the downstream wake. Steiros et al. (Reference Steiros, Bempedelis and Ding2021) performed particle image velocimetry (PIV) measurements for the flow past a perforated plate with different porosity. Based on the experimental results, they proposed a theoretical model that explains the emergence, migration and disappearance of downstream recirculation bubbles both in laminar and turbulence regimes. Furthermore, rapid advancements in additive manufacturing techniques have facilitated the fabrication of complex models with high-quality surface finishes. This progress allows for the design and fabrication of uniform and periodic porous structures with great flexibility in varying design parameters. Xu et al. (Reference Xu, Chang, Yu, Chen and Gao2022) leveraged these techniques to introduce structured porous surfaces to 2-D circular cylinders, examining the dynamic evolution of the wake in relation to porosity. Their observations revealed that the porous nature of the cylinder suppresses vortex shedding, as confirmed through proper orthogonal decomposition and power spectrum analysis, especially with increased porosity. Arcondoulis et al. (Reference Arcondoulis, Liu, Ragni, Avallone, Rubio-Carpio, Sedaghatizadeh, Yang and Li2023) used a 2-D circular cylinder with a structured porous coating, printed from a transparent material, to conduct tomographic PIV measurements in a water tunnel. This study aimed to explore the impact of internal flow within the porous medium on wake development. With improved optical accessibility, they visualized the flow around and within the porous medium, proposing a mechanism for vortex shedding suppression. This mechanism involves stagnation of the internal flow on the internal boundary layer, which in turn affects the shear layer both within and outside the porous medium.
In the field of environmental flow, regular arrays of 2-D circular cylinders are another structured porous body widely used in past studies representing rigid emergent vegetation (Nicolle & Eames Reference Nicolle and Eames2011; Rominger & Nepf Reference Rominger and Nepf2011; Chen et al. Reference Chen, Ortiz, Zong and Nepf2012; Zong & Nepf Reference Zong and Nepf2012). One of the primarily topics for these studies is understanding the flow adjustment and its corresponding length scale, which are pivotal in shaping the downstream wake patterns of porous cylinders. The influence of porous media on flow adjustment was initially investigated in scenarios involving flow through and around finite rectangular porous obstructions (Belcher, Jerram & Hunt Reference Belcher, Jerram and Hunt2003; Coceal & Belcher Reference Coceal and Belcher2004; Rominger & Nepf Reference Rominger and Nepf2011). In this context, the flow adjustment length is defined as the distance from the leading edge of the obstruction to where the flow within the porous medium is fully developed. This distance, often termed the interior flow adjustment length, is dictated by the balance between fluid inertia and the drag force exerted in the streamwise direction by the canopy (Belcher et al. Reference Belcher, Jerram and Hunt2003; Ghisalberti & Nepf Reference Ghisalberti and Nepf2009). Rominger & Nepf (Reference Rominger and Nepf2011) conducted an in-depth examination of finite rectangular patches through extensive experimental measurements utilizing an acoustic Doppler velocimeter. Their work, both experimental and theoretical, explored the interior flow adjustments within the 2-D porous medium. By properly scaling the momentum equations, they formulated a new parameter, the canopy drag length scale, defined as the inverse of the product of the cylinder drag and the frontal area density,  $(C_Da)^{-1}$, where
  $C_D=2F_D/(\rho u^2 D)$ (
 $F_D$ and
  $u$ being the average drag force and fluid velocity in the direction of the flow;
  $\rho$ and
  $D$ the fluid density and cylinder diameter, respectively). They revealed that this parameter is closely linked to the flow deceleration and proposed an analytical model describing the interior flow adjustment length with respect to
  $(C_Da)^{-1}$.
Furthermore, Chen et al. (Reference Chen, Ortiz, Zong and Nepf2012) developed this idea for finite circular porous obstructions, assuming that a similar momentum balance could be applied. In their analytical framework, the flow adjustment scale was presumed to be the maximum of either the drag length scale or the cylinder diameter ( $D$). They described the flow adjustment length as the distance from the trailing edge to the point where the flow reattaches or stagnates. At this point, the flow is no longer directly influenced by the drag from the porous structure and has adjusted to the altered pressure gradients and flow conditions in the wake of the circular porous patch. For clarity, we term this length the downstream flow adjustment length, distinguishing it from the interior flow adjustment occurring within the rectangular porous patch. Subsequent research has corroborated the relationship between downstream flow adjustment and the canopy drag length scale
  $(C_Da)^{-1}$ (Chen, Jiang & Nepf Reference Chen, Jiang and Nepf2013; Liu & Shan Reference Liu and Shan2019).
Despite numerous experimental efforts aimed at understanding the wake dynamics influenced by cylinder porosity, the fundamental physics underlying structural modification behind a 2-D porous body is not yet fully understood. This is primarily attributed to the inherent coupling between porosity and permeability in porous media, making it practically challenging to fabricate complex porous models with independent manipulation of permeability. To address this challenge, numerical investigations have attempted to isolate the effects of permeability from those of porosity, thereby enabling a focused examination of their individual impacts on the wake behaviour and aerodynamic/hydrodynamic characteristics of the porous cylinder (Jue Reference Jue2004; Yu et al. Reference Yu, Zeng, Lee, Bai and Low2010; Cummins et al. Reference Cummins, Viola, Mastropaolo and Nakayama2017; Ledda et al. Reference Ledda, Siconolfi, Viola, Gallaire and Camarri2018). Specifically, the governing equations in the numerical studies often incorporated the Darcy–Brinkiman–Forchheimer model, which effectively describes flow within and around porous media across various Reynolds numbers and flow scenarios, from bluff body flows to turbulent boundary layers (Chang & Constantinescu Reference Chang and Constantinescu2015; Kuwata & Suga Reference Kuwata and Suga2017; Rosti, Brandt & Pinelli Reference Rosti, Brandt and Pinelli2018; Chavarin et al. Reference Chavarin, Efstathiou, Vijay and Luhar2020). Yu et al. (Reference Yu, Zeng, Lee, Bai and Low2010) carried out numerical simulations based on the finite volume method to analyse the flow around a porous square cylinder over a wide range of Darcy numbers ( $10^{-6}< Da<10^{-1}$), where
  $Da=K/D^2$ (
 $K$ being the permeability and
  $D$ the cylinder width), in a laminar flow regime. Their findings established a correlation between
  $Da$, as a measure of flow-blockage, and the bleeding flow rate, revealing that the recirculating wake behind the cylinder is governed by the interplay of these factors.
Further investigation into the influence of  $Da$ was made through direct numerical simulations (Cummins et al. Reference Cummins, Viola, Mastropaolo and Nakayama2017), with a focus on the recirculating wake characteristics behind a porous disk at low Reynolds numbers (
 $Re=U_eD/\nu$, where
  $U_e$ is the upstream velocity and
  $\nu$ is the kinematic viscosity). This study identified three distinct flow regimes: an effectively impervious body for
  $Da<10^{-6}$, reflecting the length scale of the wake is similar to the solid body; an intermediate porous body for
  $10^{-6}< Da<10^{-3}$, characterized by a progressively shortening and downstream migration of the recirculating bubble, which eventually disappears at a critical Darcy number
  $Da_c$; and a highly porous body for
  $Da>10^{-3}$, distinguished by the absence of recirculation. Moreover, previous numerical studies (Jue Reference Jue2004; Ledda et al. Reference Ledda, Siconolfi, Viola, Gallaire and Camarri2018) concluded that, particularly at low
  $Re$, permeability plays a more dominant role than porosity in influencing the flow pattern around both square and rectangular porous cylinders. This conclusion was supported by the observation that the force coefficients and wake oscillation frequencies are predominantly dependent on the permeability of the porous body.
In cases involving higher Reynolds numbers, Nicolle & Eames (Reference Nicolle and Eames2011) conducted direct numerical simulations to study the flow around regular arrays of 2-D circular cylinders at  $Re=2100$. Their work specifically addressed the impact of porosity on the downstream wake patterns, identifying three distinct flow regimes determined by the porosity of the medium. At high porosity (
 $\varPhi < 0.05$), cylinders are spaced widely, leading to minimal interaction and isolated vortices without a cylinder-scale vortex street. For intermediate porosity (
 $0.05 < \varPhi < 0.15$), a steady wake region forms behind the cylinder array, with a vortex street developing farther downstream. For low porosity (
 $\varPhi > 0.15$), a cylinder wake is similar to a solid body of the same scale. Chang & Constantinescu (Reference Chang and Constantinescu2015) later expanded upon this work, applying fully three-dimensional (3-D) large-eddy simulations to similar configurations of circular cylinders at
  $Re=10\,000$, examining the effects of porosity on the wake. Their work highlighted a significance of gap spacing between individual cylinders on the force statistics and the downstream flow structure. More recently, Fang et al. (Reference Fang, Yang, Ma and Li2020) carried out large-eddy simulations to explore wake characteristics behind porous square cylinders even at
  $Re=63\,832$, examining the shedding frequency of the wake against the cylinder porosity. These studies, set within turbulent flow regimes, contrast with the aforementioned computational works centred on lower Reynolds numbers, highlighting the role of porosity in driving structural modifications in the wake, rather than focusing on the effect of permeability.
While significant advances have been made in understanding the wake dynamics of 2-D porous cylinders, a notable knowledge gap persists. Previous computational studies, addressing both low and high Reynolds numbers, have consistently highlighted the importance of two key parameters of porous media – permeability and porosity – and their impact on the wake and aerodynamic/hydrodynamic characteristics of porous cylinders. Most experimental studies, however, have favoured porosity as the primary control parameter, largely due to the ease of fabricating porous models with finely tunable porosity. Some studies, such as those by Rominger & Nepf (Reference Rominger and Nepf2011) and Chen et al. (Reference Chen, Ortiz, Zong and Nepf2012), employed a non-dimensional flow-blockage parameter ( $C_DaD$) resulting from the drag length scale as a representation of permeability. Nonetheless, this approach serves as an indirect measure. Consequently, the individual role of porosity and permeability in wake dynamics behind porous cylinders at high
  $Re$ have not been thoroughly explored experimentally.
In this study, we make the first experimental attempt to investigate the influence of permeability on the flow structure and the associated downstream flow adjustment of porous cylinders at high Reynolds numbers ( $Re \sim O(10^4)$). We have fabricated various porous square cylinders whose base structure consists of a periodic and scalable lattice. Utilizing a high-resolution 3-D printing technique, we successfully isolated the permeability from porosity, allowing a systematic study of the wake structure behind the porous cylinders in relation to permeability. Detailed permeability, drag and PIV measurements were conducted for the porous cylinders over a wide range of
  $Da$. Based on the experimental data, we first examine the evolution of wake structure as it relates to
  $Da$. Subsequently, we propose a new analytical model to estimate the downstream flow adjustment length with respect to the cylinder permeability and validate it using experimental data. The paper is organized as follows: § 2 outlines the experimental methodology, including a unique modelling method for porous structures that decouples permeability and porosity; § 3 presents an analysis of the main experimental results, along with empirical and analytical approaches to assess downstream flow behaviour; § 4 is devoted to the conclusion.
2. Experiments
2.1. Cylinder models
In the present study, the porous cylinders are designed with a simple cubic lattice structure as proposed in our previous work (Seol, Hong & Kim Reference Seol, Hong and Kim2023). This design particularly enables isotropic permeability within the porous medium. The geometry of the simple cubic lattice is defined by two key parameters: the length of the unit cell ( $d_1$) and the width of the struts (
 $d_2$), which are illustrated in figures 1(a) and 1(e). The void fraction, also known as porosity (
 $\varPhi$), of a structure based on this configuration is determined by the ratio between
  $d_2$ and
  $d_1$ within each unit cell as
 \begin{equation} \varPhi=\left(1-\frac{2d_2}{d_1}\right)^2\left(1+\frac{4d_2}{d_1}\right). \end{equation}
Figure 1. (a) A simple cubic lattice structure forming the base of the porous structure. (b) Schematic representation of the decoupling process, separating permeability from porosity. (c) Dimensions of the porous square cylinder used in the experiments. (d) Sample images of the porous square cylinders with varying designs. (e) Detailed design parameters outlined in the schematic cross-section for model A5 (see table 1).
Table 1. Parameters for the structured porous square cylinders:  $\phi$, porosity;
  $d_1$, length of the unit cell;
  $d_2$, strut width;
  $D$, cylinder width;
  $C_D$, drag coefficient;
  $L_{i,exp}$, downstream adjustment length from the measurements;
  $L_{o,exp}$, upstream adjustment length from the measurements;
  $K$, permeability;
  $Da$, Darcy number;
  $1/2\sqrt {Da}$, flow-blockage; RE, the presence of a recirculation bubble behind the cylinder.

When the length of the unit cell ( $d_1$) is decreased while maintaining a constant ratio of
  $d_2/d_1$, a process indicative of unit cell scaling, the permeability (
 $K$) decreases, whereas the porosity (
 $\varPhi$) remains constant. This constancy arises because porosity is solely determined by the ratio
  $d_2/d_1$, as illustrated in figure 1(b) and (2.1). On the other hand, an increase in
  $d_1$ results in larger pore sizes, which consequently increases the specific surface area per unit volume, and thus increases the permeability. By employing this scalable design approach, it becomes possible to isolate permeability from porosity. This method of modelling porous structures facilitates the investigation of the impact of permeability on the aerodynamic properties and wake formation of the porous cylinder, independently from porosity effects. Additionally, the advent of rapid advancements in additive manufacturing technologies enables the fabrication of these porous models with high-resolution stereolithography 3-D printing, ensuring excellent surface finish and complex pattern accuracy.
For this study, we employed 2-D square cylinders due to their compatibility with the Cartesian coordinate system. Specifically, 2-D cylinders with rectangular cross-sections, in contrast to those with circular ones, are better suited to manipulate the permeability, given the tensor nature. For simplicity, we set the aspect ratio of the rectangular cross-section to unity, yielding a square shape. All the cylinders, whether porous or solid, were fabricated using the stereolithography 3-D printer (Anycubic Photon Mono X), using a width  $D$ of 24–42 mm and a length of 320 mm, as represented in figure 1(c). Detailed design specifications and attributes of each cylinder can be found in table 1 and in our previous work (Seol et al. Reference Seol, Hong and Kim2023).
2.2. Permeability measurements
Permeability measurements were conducted in an open-loop acrylic pipe with a length of 3.5 m and an inner diameter of 65 mm (see figure 2a). Porous disks with the identical lattice structure considered in this study were produced by the 3-D printer. The thickness of these disks varies from 20 to 60 mm to maintain a maximum pressure drop below 2000 Pa at a superficial velocity ( $U_s$) of 15 m s
 $^{-1}$ within the pipe flow. The disks were securely positioned at 1.2 m from the inlet, ensuring a fully developed incoming flow. The pressure drop (
 ${\rm \Delta} P$) was measured using a high-resolution differential pressure transmitter (FCO560, Furness Control) at an acquisition rate of 1 kHz for 2 min from two pressure taps located before and after the disks. At a distance of 0.4 m from the outlet,
  $U_s$ was recorded ranging from 0.15 to 15 m s
 $^{-1}$ by a thermal mass flow meter for 2 min (KSMG-8000, pressure and temperature compensated). From the plot for
  ${\rm \Delta} P$ against
  $U_s$ for all porous cases, the permeability (
 $K$) can be assessed by applying fitting lines to the Forchheimer equation (Dukhan & Minjeur Reference Dukhan and Minjeur2011). The permeability (
 $K$) and its corresponding non-dimensional parameter, Darcy number (
 $Da$), are reported in table 1.

Figure 2. (a) Experimental set-up for permeability measurement featuring sample porous disks. (b) Three-component balance unit used for drag measurement. Schematic illustration of the field-of-view (FoV) for (c) downstream and (d) upstream PIV measurements. The darker shading in the middle of (c) represents an overlapped area between two FoVs.
2.3. Drag and PIV measurements
Drag and PIV measurements were taken in an open-loop wind tunnel at Seoul National University of Science and Technology, with a test section measuring  $0.35\ {\rm m}\times 0.35\ {\rm m}\times 2\ {\rm m}$. Cylinders, positioned 1 m from the inlet, were mounted to a balance unit (AFA3, TecQuipment) for drag measurements (see figure 2b). The drag force was recorded at velocities of 11.5 m s
 $^{-1}$ since the drag coefficient (
 $C_D$) remains relatively consistent over the measured Reynolds number (
 $Re \sim O(10^4)$) (Seol et al. Reference Seol, Hong and Kim2023). The cylinder's blockage ratio is approximately 11 %, but its aerodynamic influence is negligible (Möller et al. Reference Möller, Silveira, De Paula, Indrusiak and Olinto2015; Seol et al. Reference Seol, Hong and Kim2023).
The PIV measurements were performed for all cylinder cases, with an upstream speed of 11.5 m s $^{-1}$ (or
  $Re \sim 3.1 \times 10^4$). Measurements were taken at two streamwise locations in the
  $x$–
$x$– $y$ plane to capture long wake structures from the cylinders using two 12 MP TSI Powerview cameras (
 $4{\rm k}\times 3{\rm k}$, 8-bit) equipped with 105 mm Nikkor lenses, providing a
  $6D\times 3D$ FoV (see figure 2c). Additionally, upstream measurements were conducted using a single PIV camera, offering a
  $4.5D\times 3D$ FoV (see figure 2d), to capture flow deceleration at the leading edge of the cylinder. A 1 mm-thick laser sheet was created by a Quantel Evergreen Nd:YAG double-pulsed laser (200 mJ pulse
 $^{-1}$), capturing data at a rate of 5 Hz for all cases. For each cylinder configuration, 2000 statistically independent image pairs were captured. The final interrogation window size was
  $32 \times 32$ with 50 % overlap, resulting in a grid resolution of
  $890\,\mathrm {\mu }$m.
Given the random nature of turbulent flow, the uncertainty in PIV measurements predominantly stems from random error. This type of error arises from two main sources: the inherent random fluctuations in turbulent flows and errors within the digital PIV measurement system itself. Consequently, the total random error in velocities is a result of the sampling error in the turbulent velocity signal combined with the subpixel accuracy of the PIV system. Sampling error indicates the convergence of statistics in turbulent fluctuations relative to sample size, calculated as the ratio of the standard deviation of the fluctuating velocity to the square root of the sample size. Another notable contributor to the measurement error is the subpixel accuracy, which is approximately 5 % of the particle image diameter (here considered to be 3 pixels) and is inversely proportional to the sample size (Prasad et al. Reference Prasad, Adrian, Landreth and Offutt1992). Given this consideration, the total random error for the mean velocity in the current PIV measurements is estimated to be  ${\pm }0.05$ m s
 $^{-1}$. which corresponds to a 0.1 % uncertainty when normalized with the upstream velocity (
 $U_e$). Further details regarding permeability, drag and PIV measurements can be found in our previous work (Seol et al. Reference Seol, Hong and Kim2023).
3. Results and discussion
3.1. Flow and aerodynamic characteristics
Figure 3 displays selected contour maps of the mean longitudinal velocity,  $\langle u \rangle$, superimposed with streamlines that represent a characteristic downstream flow pattern with respect to permeability. The coordinate system is normalized by the cylinder width,
  $D$, and a schematic representation of the porous cylinders is included at the origin to facilitate a better understanding of the cylinder cross-section and the flow patterns depending on the pore size. For comparative purposes, the solid case is depicted in figure 3(a) to emphasize the impact of permeability.

Figure 3. Selected contour maps of mean longitudinal velocity superimposed with streamlines for each case. Panels (a–g) are represented as follows: (a) case S; (b) case A1; (c) case B2; (d) case A4; (e) case B6; ( f) case B5; (g) case C5. Schematic representation of the porous cylinders was included at the origin to give a better understanding of cylinder cross-section and flow patterns depending on the pore size. In (a), the white solid circles indicate the upstream and downstream stagnation points, where  $\langle u \rangle /U_e=0$, located on the symmetric plane.
In figure 3, the presence of the longitudinal bleeding flow can be observed, which resides along the symmetric plane for all porous cases due to the nature of the permeable cylinder. However, the momentum and the corresponding longitudinal extent of the bleeding are significantly influenced by the permeability, leading to modification in the downstream wake. For instance, the bleeding flow elongates as  $Da$ increases, pushing the main recirculation bubble farther downstream and reducing its size (Cummins et al. Reference Cummins, Viola, Mastropaolo and Nakayama2017; Ledda et al. Reference Ledda, Siconolfi, Viola, Gallaire and Camarri2018). When
  $Da$ increases to its critical value (
 $Da_{c1}=2.0\times 10^{-4}$, see figure 3c), the downstream reverse flow vanishes. Instead, a region characterized by a positive and constant velocity appears, forming a steady wake behind the porous cylinder (Zong & Nepf Reference Zong and Nepf2012). As
  $Da$ becomes sufficiently high (see figure 3f), a second pair of recirculation bubbles attached to the trailing edge of the porous cylinder completely disappears. As reported in previous numerical and experimental works (Fang et al. Reference Fang, Yang, Ma and Li2020; Seol et al. Reference Seol, Hong and Kim2023), this second pair arises due to the mutual interaction between longitudinal and lateral bleedings at High
  $Re$ and the sharp edge of the present square cylinder, which effectively generates cylinder-scale wake. The absence of the second recirculation pair, observed in figures 3(e) and 3( f), denotes the predominance of small-scale vortices shed from the individual lattice of the current structured porous cylinders over a certain downstream region (Nicolle & Eames Reference Nicolle and Eames2011). Consequently, another critical Darcy number can be identified,
  $Da_{c2}=1.0\times 10^{-3}$, which marks the onset of a small-scale wake induced by the individual lattice in this study.
Based on the downstream flow patterns that vary with permeability across two decades of  $Da$ (see figure 3), four distinct flow regimes can be identified: Regime I, II, III and IV. Regime I is characterized as an effectively impervious regime (
 $Da < 1.0\times 10^{-6}$), as described by Cummins et al. (Reference Cummins, Viola, Mastropaolo and Nakayama2017). In this regime, the downstream wake displays a clear, alternating pattern of large-scale vorticity from the porous cylinder. Furthermore, in the mean sense, the main recirculation bubble lying in the near wake is attached immediately behind the porous cylinder. Regime II (
 $1.0\times 10^{-6} < 2.0\times 10^{-4}$) is identified as a transitional regime, where the recirculation bubble starts to detach from the cylinder, reducing in size as
  $Da$ increases, and eventually vanishes at the critical value (
 $Da_{c1}$). Regime III (
 $2.0\times 10^{-4} < 1.0\times 10^{-3}$) is considered an effectively permeable regime. Here, downstream reverse flow is absent, leading to a uniform velocity region behind the porous cylinder. Lastly, Regime IV (
 $Da > 1.0\times 10^{-3}$) is recognized as a highly permeable regime. In this state, the porous cylinder no longer generates a cylinder-scale vortex street. Instead, small-scale vortices are formed from the individual lattice struts of the porous cylinder (Nicolle & Eames Reference Nicolle and Eames2011).
The modification of the downstream flow pattern can be further examined by quantifying both the number and the position of the stagnation points in the near-wake region as demonstrated by Cummins et al. (Reference Cummins, Viola, Mastropaolo and Nakayama2017). For instance, in the case where  $Da > Da_{c1}$, no stagnation point is observed owing to the absence of reverse flow. At
  $Da = Da_{c1}$, a single stagnation point appears, indicating the emergence of the recirculation bubble. When
  $Da< Da_{c1}$, two stagnation points coexist, as indicated by the white solid circles in figure 3(b). In this case, the wake length (
 $W_r$) is defined as the longitudinal distance between the upstream and downstream stagnation points.
Figure 4(a) presents the variation of wake length ( $W_r$) as a function of
  $Da$ for porous cases exhibiting a recirculation bubble in the near-wake region. In this plot, red vertical solid lines demarcate the boundaries of each flow regime, labelled with Roman numerals. Particularly, the grey shaded area emphasizes the flow regime where
  $Da< Da_{c1}$. Figure 4(a) demonstrates a rapid decrease in wake length within Regime II as
  $Da$ increases, eventually leading to
  $W_r=0$ at
  $Da_{c1}$. Such structural behaviour aligns with the observation made by Cummins et al. (Reference Cummins, Viola, Mastropaolo and Nakayama2017). In particular, the structural alterations in the recirculation bubble within the transitional regime are mainly attributed to the rapid movement of the upstream stagnation point towards the downstream with increasing
  $Da$. In contrast, the downstream stagnation point maintains a relatively steady position, showing a minimal shift compared with the upstream one as observed in figure 3.

Figure 4. (a) Variation of wake length,  $W_r$, as a function of Darcy number (
 $Da$) for cases within Regime II. (b) Drag coefficient,
  $C_D$, plotted against
  $Da$ for all porous cases. Detailed values for
  $Da$,
$Da$,  $W_r$ and
  $C_D$ can be found in table 1.
Additionally, figure 4(b) displays the drag coefficient ( $C_D$) as a function of
  $Da$ for all porous cases. This figure displays the drag coefficient (
 $C_D$) trending downward as
  $Da$ increases for all porous cases, maintaining a log–linear relationship across Regimes II to IV. It is worth mentioning that as
  $Da$ approaches unity in Regime IV, the
  $C_D$ trend may adopt a curvilinear nature, eventually diminishing to zero. As illustrated by Cummins et al. (Reference Cummins, Viola, Mastropaolo and Nakayama2017),
  $C_D$ becomes inversely proportional to
  $Da$ as the latter approaches a value of 1. However, figure 4(b) does not exhibit this curvilinear behaviour within Regime IV, due to the fact that the
  $Da$ for the current porous cylinders do not approach, sufficiently enough, close to 1, an issue arising from the practical challenges encountered during the fabrication of the porous cylinders. Consequently, a log–linear relationship between
  $C_D$ and
  $Da$ is only observable within the given range of
  $Da$ considered in this study. To further assess the role of permeability as an isolated parameter, we explore the boundary layer characteristics on the upper side of the present porous cylinders. This investigation is driven by the hypothesis that the local near-wall flow around the porous cylinder is influenced by the internal porous structures and the interfacial porosity of the porous media (Kang et al. Reference Kang, Lee, Lee and Kim2017). Should this hypothesis hold true in this study, it would imply that porosity, alongside permeability, plays a crucial role in determining the near-wall flow dynamics and the associated drag on the porous cylinders. Such an interplay between permeability and porosity could challenge the fundamental assumption of this study, which considers permeability as an independent factor. To address this, we examine the development of the boundary layer as it traverses the fluid–porous interface (
 $y/D=0.5$) of the cylinder and its corresponding vorticity thickness in relation to
  $Da$.
$Da$.
Figure 5(a) displays mean longitudinal velocity profiles on the upper surface of the porous cylinder at multiple streamwise locations, namely  $x/D=0$, 0.25, 0.5, 0.75 and 1. Four cylinder cases, including the solid case for baseline comparison, were selected. These velocity profiles illustrate the structural alteration of the boundary layer due to vertical bleeding flow through pores with varying lattice geometries as the fluid moves along the fluid–porous interface (
 $y/D=0.5$). Both
  $x$- and
  $y$-coordinates are normalized by the cylinder width,
  $D$. The mean longitudinal velocity
  $\langle u \rangle$ is normalized by the upstream velocity,
  $U_e$, and its scale is depicted on the plot with a black horizontal line. Vertical dashed lines indicate locations of undelayed zero velocity, denoted as
  $\langle u \rangle /U_e=0$, and grey shading represents the upper side of the porous cylinder.

Figure 5. (a) Boundary layer mean-velocity profiles on the upper surface of the cylinders for representative porous cases at longitudinal locations (i.e.  $x/D=$0, 0.25, 0.5, 0.75 and 1); The variation of (b) boundary layer thickness,
  $\langle \delta \rangle$, and (c) vorticity thickness,
  $\langle \delta _w\rangle$, over the measured Darcy number.
Figure 5(a) clearly demonstrates that a boundary layer begins to develop slightly downstream from the leading edge for all cases. Specifically, for the solid case, the boundary layer separates at the sharp edge, forming a distinct shear layer that grows in thickness as it continues along the cylinder side. As figure 5(a) illustrates, the velocity profile for case S features a high velocity gradient across the cylinder surface, indicating a region of high vorticity.
For the porous cases, the velocity profiles from the leading-edge display unique behaviours due to the nature of the porous cylinder, as observed in figure 5(a). The velocity profiles for cases B4 and C5 at the leading edge ( $x/D=0$) do not decrease to zero near the fluid–porous interface (
 $y/D=0$); instead, their magnitude is similar to the upstream velocity,
  $U_e$. In contrast, the velocity profile for case A1, with the lowest permeability in this study, resembles the behaviour of the solid case at
  $x/D=0$, showing clear flow separation close to the leading edge. This suggests that the permeability of the porous cylinder, which governs fluid penetration into the porous medium, affects the separation point initially at the leading edge for the solid square cylinder (Bhattacharyya, Dhinakaran & Khalili Reference Bhattacharyya, Dhinakaran and Khalili2006; Yu et al. Reference Yu, Zeng, Lee, Bai and Low2010). Furthermore, figure 5(a) shows that the boundary layers for the porous cases also evolve as the flow moves along the cylinder interface. However, this development is remarkably influenced by the presence of bleed flow, as permeability allows fluid to penetrate through the cylinder. Thus, observations from figure 5(a) indicate that the permeability of the porous cylinder significantly impacts the boundary layer thickness and the corresponding velocity gradient, leading to variations in the local vorticity field.
To quantitatively assess the relationship between permeability and boundary layer characteristics on the porous cylinders, we computed the boundary layer thickness  $\delta$ for all porous cases. In this analysis,
  $\delta$ is defined as the vertical distance from the upper surface of the cylinder to where the velocity reaches 99 % of the reference velocity. We chose the local maximum velocity as the reference velocity instead of the uniform upstream velocity (
 $U_e$), as the local maximum better reflects the local flow phenomena on the porous cylinder disturbed from the leading edge. Additionally, vorticity thickness
  $\delta _w$ was calculated to evaluate the role of permeability in the distribution of locally induced vorticity within the shear layer on the side of the porous cylinders. Vorticity thickness is traditionally defined as
  $\delta _w={\rm \Delta} \langle u \rangle / (\partial \langle u \rangle / \partial y \vert _{max})$, where
  ${\rm \Delta} \langle u \rangle$ represents the maximum velocity difference, defined as
  $\langle u \rangle _{max} - \langle u \rangle _{min}$, with
  $\langle u \rangle _{max}$ and
  $\langle u \rangle _{min}$ being the local maximum and minimum mean longitudinal velocities, respectively (Lyn & Rodi Reference Lyn and Rodi1994). The local values of
  $\delta$ and
  $\delta _w$ were then averaged along the streamwise direction from the separation point to the trailing edge (
 $x/D=1$), namely
  $\langle \delta \rangle$ and
  $\langle \delta _w\rangle$, respectively. The separation point considered in this study was estimated by setting a threshold for the vertical velocity gradient. However, it is important to note that these estimated values are approximate due to relatively coarse PIV grid resolution and light reflection from the upper side of the cylinder, which results in limited optical access very close to the fluid–porous interface. Nonetheless, these roughly estimated points can still serve as a good starting point for the streamwise-averaging in
  $\delta$ and
  $\delta _w$ to characterize the developing boundary layer over the side of the present porous cylinders in an averaging sense.
Figures 5(b) and 5(c) display the variation of  $\langle \delta \rangle$ and
  $\langle \delta _w\rangle$ over
  $Da$ across Regimes II to IV in the same manner to figure 4(b). As illustrated in figure 5(b), the boundary layer thickness
  $\langle \delta \rangle$ exhibits a log–linear decrease with increasing cylinder permeability, despite minor fluctuation in
  $\langle \delta \rangle$ across
  $Da$. This trend is attributed to higher permeability allowing for the influx of higher momentum fluid into the boundary layer. This results in a fuller velocity profile near the fluid–porous interface, effectively thinning the boundary layer (Kim et al. Reference Kim, Blois, Best and Christensen2018; Chen et al. Reference Chen, Li, Chang, Yang and Gao2023). Conversely, figure 5(c) reveals that the vorticity thickness
  $\langle \delta _w\rangle$ increases with
  $Da$. This increase stems from enhanced bleeding flow through more permeable cylinders, improving mixing with external flow, redistributing vorticity farther from the surface, and consequently raising
  $\langle \delta _w\rangle$ (Finnigan, Shaw & Patton Reference Finnigan, Shaw and Patton2009; Chen et al. Reference Chen, Li, Chang, Yang and Gao2023).
From the perspective of  $\langle \delta _w\rangle$, figure 5(a) distinctly demonstrates how permeability affects both the maximum velocity difference
  ${\rm \Delta} \langle u \rangle$ and the maximum velocity gradient
  $\partial \langle u \rangle / \partial y \vert _{max}$ within developing boundary layers across different porous cases. Notably, the bleeding effect due to the nature of the porous cylinder facilitates mixing within the shear layer, leading to a more uniform velocity distribution. This effect reduces the maximum velocity difference
  ${\rm \Delta} \langle u \rangle$, as shown in figure 5(a). Simultaneously, the altered boundary layer dynamics due to increased permeability also modify the velocity gradient
  $\partial \langle u \rangle / \partial y$, diminishing its maximum value. Despite the reduction in both
  ${\rm \Delta} \langle u \rangle$ and
  $\partial \langle u \rangle / \partial y \vert _{max}$ with greater permeability, figure 5(c) clearly indicates that the vorticity thickness – calculated as the ratio of
  ${\rm \Delta} \langle u \rangle$ to
  $\partial \langle u \rangle / \partial y \vert _{max}$ – increases with higher permeability. Moreover, the trend of
  $\delta _w$ across
  $Da$ exhibits a consistent log–linear relationship, which is the same tendency to the boundary layer thickness (
 $\langle \delta \rangle$) and the drag coefficient (
 $C_D$) with
  $Da$, as seen in figures 5(b) and 4(b), respectively. These findings highlight the critical role of permeability, as an independent parameter, in characterizing the boundary layer development along the sides of porous cylinders. Furthermore, the results from figure 5 corroborate the log–linear relationship between
  $C_D$ and
  $Da$ in figure 4(b) due to the fact that the boundary layer characteristics are closely linked to the pressure distribution around the porous cylinder and its corresponding drag force.
Based on the observations in figures 3–5, several noteworthy points emerge. First, permeability exerts a more significant influence on the structural and aerodynamic features of porous cylinders compared with porosity. This is evidenced by the clear correlation between downstream wake patterns, their aerodynamic features and boundary layer properties with  $Da$. Specifically,
  $C_D$ in figure 4(b) demonstrates a log–linear relationship over the measured
  $Da$ range, implying that the pressure drop across the porous cylinder can be modelled as a function of
  $Da$. This notion is confirmed by the analysis of boundary layer characteristics on the side of the porous cylinders in figure 5, which shows a consistent log–linear trend in
  $\langle \delta \rangle$ and
  $\langle \delta _w\rangle$ with
  $Da$. This substantial role of permeability in modifying the wake characteristics and their corresponding aerodynamics was highlighted in previous studies (Cummins et al. Reference Cummins, Viola, Mastropaolo and Nakayama2017; Ledda et al. Reference Ledda, Siconolfi, Viola, Gallaire and Camarri2018; Chen et al. Reference Chen, Li, Chang, Yang and Gao2023). Beyond these numerical works, which primarily focus on low
  $Re$ (i.e.
  $Re \sim O(10^1\unicode{x2013}10^2)$), the current experimental study reaffirms the consistent evolution of downstream wake and aerodynamic properties with increasing
  $Da$, even at higher
  $Re$ (i.e.
  $Re \sim O(10^4)$).
Another important observation is that the present design of the porous cylinders successfully decouples permeability from porosity. As shown in figures 4 and 5, variations in the downstream flow structure, boundary layer characteristics and drag coefficient with  $Da$ occur despite constant porosity, maintaining distinctive patterns in relation to
  $Da$. These results confirm the suitability of the current porous structure design for a parametric study focused on permeability within this complex flow field. To be more specific, the periodic and scalable lattice structure, fabricated using a high-resolution 3-D printing technique, facilitates finely and systemically tuned permeability, which is the first attempt in the experimental study for the flow past/around porous media.
Lastly, the data illustrated in figure 4 clearly point to the potential for refining the governing equation for flow within or around porous media by introducing an additional source term based on permeability. This additional source term, identified as the Darcy–Brinkman–Forchheimer model (Yu et al. Reference Yu, Zeng, Lee, Bai and Low2010; Anirudh & Dhinakaran Reference Anirudh and Dhinakaran2018), encapsulates the resistance induced by porous media alongside the viscous and inertial effects of fluid at high  $Re$. This model is directly related to permeability, making it better suited for evaluating flow adjustment lengths as a characteristic length scale in relation to permeability. In contrast, previous experiments in similar flow configurations (Chen et al. Reference Chen, Ortiz, Zong and Nepf2012; Zong & Nepf Reference Zong and Nepf2012) utilized a source term defined by the drag coefficient exerted on porous cylinders.
3.2. Downstream flow structure
In this section, we examine how the flow structure adjusts and evolves in the wake region as it moves away from the porous square cylinder. For clarity and simplicity, two representative porous cases are selected based on their Darcy numbers ( $Da$). The first, case B7 (
 $D=24\ {\rm mm}$,
  $\varPhi =0.8$,
  $Da=6.65\times 10^{-4}$), falls under
  $Da>Da_{c1}$ and exhibits a steady wake. The second, case B1 (
 $D=40\ {\rm mm}$,
  $\varPhi =0.8$,
  $Da=5.80\times 10^{-5}$), belongs to the regime where
  $Da< Da_{c1}$ and is characterized by the presence of a recirculation bubble behind the cylinder. Figure 6 illustrates the fundamental evolution of the longitudinal velocity (
 $\langle u \rangle$) and its r.m.s. velocity (
 $u_{rms}$) along the centreline of the cylinder for these two porous cases. The
  $x$- and
  $y$-coordinates are normalized by the cylinder width,
  $D$, and the upstream velocity,
  $U_e$, respectively. The shaded block in these figures indicates the physical space occupied by the porous cylinder along the
  $x$-axis (
 $0< x/D<1$). Specifically, figures 6(b) and 6(d) include the case of a solid cylinder (case S) for comparison, to highlight the impact of the bleeding flow on the downstream reverse flow characteristics.

Figure 6. Longitudinal profiles of mean velocity ( $\langle u \rangle / U_e$) along the centreline of the cylinder (
 $y/D=0$) for (a) case B7 (
 $D=24$ mm,
  $\varPhi =0.8$,
  $Da=6.65 \times 10^{-4}$) and (b) case B1 (
 $D=40$ mm,
  $\varPhi =0.8$,
  $Da=5.80 \times 10^{-5}$). Longitudinal profiles of root-mean-square (r.m.s.) velocity (
 $u_{rms}/U_e$) along the centreline for (c) case B7 and (d) case B1. For comparison, the solid cylinder case (case S) is included in (b,d). The shaded block represents the location of the cylinder.
  $L_i$ and
  $L_o$ indicate the downstream and upstream adjustment lengths, respectively, and
  $U_{sw}$ represents the steady wake velocity.
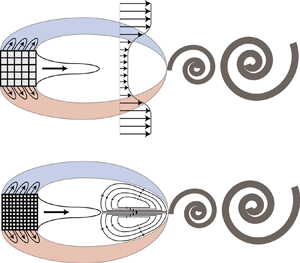
Figure 6(a) illustrates that for  $Da > Da_{c1}$, the flow starts to decelerate at a distance
  $L_o$ upstream from the leading edge of the porous cylinder, exhibiting a similar behaviour to the solid case. As the flow passes through the porous cylinder, it continues to decelerate due to the drag exerted by the porous medium. After exiting the cylinder, the centreline velocity continues to decrease, as shown in figure 6(a), due to altered pressure gradients and flow conditions in the near-wake region. This decreasing trend persists over a certain distance (
 $L_i$) until a direct influence of the porous medium's drag vanishes. Beyond this point, there is a region where the velocity remains uniform, termed the steady wake velocity
  $U_{sw}$ (Zong & Nepf Reference Zong and Nepf2012). Subsequently, the velocity begins to increase, indicating the onset of the von Kármán vortex street, which injects lateral momentum into the wake.
In contrast to B7, the velocity profile for B1 ( $Da < Da_{c1}$, see figure 6b) lacks a steady wake region. Instead, the presence of a negative velocity denotes the recirculation bubble. This reverse flow, elongated and positioned farther downstream than in the solid body case, is a result of the longitudinal bleeding flow through the porous structure (Yu et al. Reference Yu, Zeng, Lee, Bai and Low2010; Fang et al. Reference Fang, Yang, Ma and Li2020). Here, the upstream stagnation point, where the velocity profile shifts from positive to negative, is considered as the endpoint of the flow adjustment (
 $L_i$). At this point, the bleeding flow, impacted by the drag of the porous medium, has completely lost longitudinal momentum. Consequently, the reverse flow beyond the first stagnation point is no longer influenced by this drag effect.
In addition to longitudinal velocity, figures 6(c) and 6(d) exhibit the r.m.s. velocity ( $u_{rms}$) profiles for the same porous cases along the cylinder centreline. For case B7 (
 $Da > Da_{c1}$), as depicted in figure 6(c), there is a pronounced peak in
  $u_{rms}$ immediately downstream of the cylinder. This peak results from the small-scale turbulence generated by the individual struts within the porous medium (Chen et al. Reference Chen, Ortiz, Zong and Nepf2012). Following this, the
  $u_{rms}$ decreases, maintaining a low and uniform state over a certain distance before gradually rising towards a second peak in the far-wake region (Zong & Nepf Reference Zong and Nepf2012). As discussed by Chen et al. (Reference Chen, Ortiz, Zong and Nepf2012), this second peak corresponds to cylinder-scale turbulence (i.e. the von Kármán vortex street), and the increasing trend in
  $u_{rms}$ reflects the velocity recovery observed in figure 6(a). In contrast, for case B1 (
 $Da < Da_{c1}$), as shown in figure 6(d), the
  $u_{rms}$ peak occurs farther downstream with reduced intensity compared with the solid case. This observation suggests that the peak position and its intensity are closely associated with the downstream recirculation bubble, which in turn reflects the wake length and the aerodynamic performance of the porous cylinder as observed in figure 4.
Observations from figure 6 have led us to construct a schematic representation of the flow structure behind the porous square cylinder, distinguishing three distinct flow regimes based on  $Da$, as shown in figure 7. In both cases presented in figure 7, there exists a flow adjustment region where the fluid decelerates, adjusting its pressure to match that of the surrounding flow upon exiting the porous cylinder. For a porous cylinder with
  $Da > Da_{c1}$, a steady wake region is present, characterized by a uniform velocity (see figure 7a). Conversely, the cylinder with
  $Da < Da_{c1}$ exhibits a reverse flow region, featured by the presence of a recirculation bubble (see figure 7b). Beyond these areas, both porous cases exhibit a flow recovery region, where there is an increase in velocity due to the emergence of the von Kármán vortex street.

Figure 7. Schematic representation of the downstream wake structure for (a) porous cases with  $Da > Da_{c1}$, illustrating a flow adjustment followed by a steady wake and subsequent flow recovery, and (b) cases with
  $Da < Da_{c1}$, showing the flow adjustment leading to reverse flow before recovering.
3.3. Downstream flow adjustment length
This section focuses on the flow adjustment region and its governing length scale, which significantly influence the downstream wake patterns of porous cylinders. The downstream flow adjustment length  $L_i$ represents the distance from the trailing edge of the porous cylinder to the location where the flow reattaches or stagnates (Chen et al. Reference Chen, Ortiz, Zong and Nepf2012; Liu & Shan Reference Liu and Shan2019). Here, we revisit the momentum balance equation and the associated analytical model for assessing
  $L_i$ proposed by Rominger & Nepf (Reference Rominger and Nepf2011) and Chen et al. (Reference Chen, Ortiz, Zong and Nepf2012) and reconstruct it with the Darcy–Brinkman–Forchheimer model to incorporate permeability (Yu et al. Reference Yu, Zeng, Lee, Bai and Low2010; Anirudh & Dhinakaran Reference Anirudh and Dhinakaran2018). The experimental data obtained from the current PIV measurements will be compared with the analytical model to assess its suitability in describing variations in permeability. Finally, the acquired
  $L_i$, serving as a characteristic length scale, will be utilized to normalize the longitudinal distance in analysing the mean velocity profile, facilitating further validation of the model.
The analytical model proposed in this study is unique due to its reliance on permeability, which directly quantifies the drag effect imposed by porous media. This method contrasts with previous studies that have utilized a non-dimensional flow-blockage parameter ( $C_DaD$) as an indirect measure of permeability. As a result, this approach results in a distinct and robust model that can be well-suited for future computational works.
Based on the Darcy–Brinkman–Forchheimer extended model, the governing equations for longitudinal momentum and lateral momentum equations to describe the flow within porous region can be expressed as (Chen et al. Reference Chen, Yu, Winoto and Low2008; Yu et al. Reference Yu, Zeng, Lee, Bai and Low2010)
 $$\begin{gather} \frac{\partial u}{\partial x} + \frac{\partial v}{\partial y}= 0, \end{gather}$$
 $$\begin{gather}
\frac{1}{\varPhi^2} \left(u\frac{\partial u}{\partial x} + v\frac{\partial
u}{\partial y} \right) ={-}\frac{1}{\rho} \frac{\partial
p}{\partial x} + \underbrace{\frac{\mu}{\rho \varPhi}
\left(\frac{\partial^2 u}{\partial x^2} + \frac{\partial^2
u}{\partial y^2} \right)}_{Brinkman\, term} -
\underbrace{\frac{\mu}{\rho K}u}_{Darcy\, term} -
\underbrace{\frac{F}{\sqrt{K}} u
(u^2+v^2)^{1/2}}_{Forchheimer\, term},
\end{gather}$$
$$\begin{gather}
\frac{1}{\varPhi^2} \left(u\frac{\partial u}{\partial x} + v\frac{\partial
u}{\partial y} \right) ={-}\frac{1}{\rho} \frac{\partial
p}{\partial x} + \underbrace{\frac{\mu}{\rho \varPhi}
\left(\frac{\partial^2 u}{\partial x^2} + \frac{\partial^2
u}{\partial y^2} \right)}_{Brinkman\, term} -
\underbrace{\frac{\mu}{\rho K}u}_{Darcy\, term} -
\underbrace{\frac{F}{\sqrt{K}} u
(u^2+v^2)^{1/2}}_{Forchheimer\, term},
\end{gather}$$ $$\begin{gather}\frac{1}{\varPhi^2} \left(u\frac{\partial v}{\partial x} + v\frac{\partial v}{\partial y} \right) ={-}\frac{1}{\rho} \frac{\partial p}{\partial y} + \frac{\mu}{\rho \varPhi} \left(\frac{\partial^2 v}{\partial x^2} + \frac{\partial^2 v}{\partial y^2} \right) - \frac{\mu}{\rho K}v - \frac{F}{\sqrt{K}} v (u^2+v^2)^{1/2}, \end{gather}$$
where  $p$ is the intrinsic average pressure,
  $\mu$ is the fluid dynamic viscosity,
  $\varPhi$ is the porosity,
  $F$(
$F$( $=1.75/\sqrt {150 \varPhi ^3}$) is the inertial factor (Vafai Reference Vafai1984) and
  $(u^2+v^2)^{1/2}$ is the resultant velocity. In the momentum equations, the Brinkman term (also known as the Reynolds stress term) is considered negligible compared with the remaining terms within the flow adjustment region (Rominger & Nepf Reference Rominger and Nepf2011). Therefore, it is omitted from the governing equation.
To determine the downstream adjustment length,  $L_i$, the governing equations (3.1)–(3.3), are scaled using the following characteristic values:
  $x=L_i$,
  $y=D/2$,
  $u=U_e$,
  $\nu =DU_e/2L_i$ and
  $\partial p/\partial x \sim {\rm \Delta} p/L_i$. The scaled governing equations are then
 $$\begin{gather} \frac{1}{\varPhi^2} \frac{U_e^2}{L_i} \sim{-}\frac{1}{\rho} \frac{{\rm \Delta} p}{L_i} - \frac{\mu}{\rho K}U_e - \frac{F}{\sqrt{K}}U_e^2 \left[1+ \left( \frac{D}{2L_i} \right)^2 \right]^{1/2}, \end{gather}$$
 $$\begin{gather}\frac{1}{\varPhi^2} \frac{DU_e^2}{2L_i^2} \sim{-}\frac{1}{\rho} \frac{2{\rm \Delta} p}{D} - \frac{\mu D}{2\rho K L_i}U_e - \frac{F}{\sqrt{K}}U_e^2 \frac{D}{2L_i} \left[1+ \left( \frac{D}{2L_i} \right)^2 \right]^{1/2}. \end{gather}$$
Then scaled equations are further simplified by dividing each by the inertial term as
 $$\begin{gather} 1 \sim{-}\frac{\varPhi^2 {\rm \Delta} p}{\rho U_e^2} - \frac{\varPhi^2 \mu L_i}{\rho K Ue} - \frac{\varPhi^2 L_i F}{\sqrt{K}}\left[1+ \left( \frac{D}{2L_i} \right)^2 \right]^{1/2}, \end{gather}$$
 $$\begin{gather}1 \sim{-}\frac{4 \varPhi^2 L_i^2 {\rm \Delta} p}{\rho D^2 U_e^2} - \frac{\varPhi^2 \mu L_i}{\rho K Ue} - \frac{\varPhi^2 L_i F}{\sqrt{K}}\left[1+ \left( \frac{D}{2L_i} \right)^2 \right]^{1/2}. \end{gather}$$
In general, the Darcy term compared with the Forchheimer term is small under the flow at high Reynolds number. Therefore, the Darcy term can be treated as negligible in this analysis and omitted from the equations. Then the equations can be rewritten as
 $$\begin{gather} 1 \sim{-}\frac{\varPhi^2 {\rm \Delta} p}{\rho U_e^2} - \varPhi^2 F\left[\left( \frac{L_i}{\sqrt{K}} \right)^2+ \left( \frac{D}{2\sqrt{K}} \right)^2 \right]^{1/2}, \end{gather}$$
 $$\begin{gather}1 \sim{-}\frac{4 \varPhi^2 L_i^2 {\rm \Delta} p}{\rho D^2 U_e^2} - \varPhi^2 F\left[\left(\frac{L_i}{\sqrt{K}} \right)^2+ \left( \frac{D}{2\sqrt{K}} \right)^2 \right]^{1/2}. \end{gather}$$
 This form of the scaled equations introduces a significant non-dimensional parameter,  $D/(2\sqrt {K})$, representing the non-dimensional flow-blockage of the porous cylinder. The term
  $\sqrt {K}$, known as the cylinder drag length scale, defines the length over which flow deceleration occurs due to drag on the cylinder. This drag length scale,
  $\sqrt {K}$, has been consistently noted in prior studies examining turbulent flows over porous substrates (Manes, Poggi & Ridolfi Reference Manes, Poggi and Ridolfi2011; Kim et al. Reference Kim, Blois, Best and Christensen2020; Suga, Okazaki & Kuwata Reference Suga, Okazaki and Kuwata2020), which corroborates the validity of our analytical approach employing the Darcy–Brinkman–Forchheimer extended model. The non-dimensional cylinder flow-blockage factor is essentially the ratio of two length scales: the cylinder half-width,
  $D/2$, and the cylinder drag length scale,
  $\sqrt {K}$. Consequently, this flow-blockage factor can be expressible as
  $1/(2\sqrt {Da})$, which is a function of
  $Da$. In this context, the porous cylinder is characterized as having high flow-blockage when
  $1/(2\sqrt {Da}) \gg 1/(2\sqrt {Da_{c1}})$, leading to a downstream reverse flow along the symmetric plane. Contrarily, cylinders with
  $1/(2\sqrt {Da}) \ll 1/(2\sqrt {Da_{c1}})$ are described as having low flow-blockage (see table 1). The transition between these two regimes can be expected to occur when
  $1/(2\sqrt {Da}) \sim 1/(2\sqrt {Da_{c1}})$.
To evaluate the unknown streamwise length scale ( $L_i$) behind the porous cylinder, it is first necessary to ascertain the pressure change at the leading edge of the porous cylinder. Generally, the pressure at the stagnation point of the 2-D bluff body is positively correlated with the kinetic energy of the upstream flow, denoted as
  $1/(2\rho U_e^2)$. In this context, the scale of the pressure change can be defined using the change in kinetic energy between a position far upstream and at the leading edge as
 \begin{equation} \frac{{\rm \Delta} p}{\rho U_e^2}= \frac{\rho U_e^2 -\rho \langle u \rangle^2_{x=0}}{\rho U_e^2}. \end{equation}
 Concurrently, previous studies (Belcher et al. Reference Belcher, Jerram and Hunt2003; Rominger & Nepf Reference Rominger and Nepf2011) have consistently reported that this pressure change at the leading edge can be characterized by the non-dimensional flow-blockage, which operates within two boundaries:  ${\rm \Delta} p=0$ for a cylinder with sufficiently low flow-blockage and
  ${\rm \Delta} p=\rho U_e^2$ for one with sufficiently high flow-blockage. Figure 8(a) demonstrates that the kinetic energy change representing the pressure change at the leading edge is logarithmically proportional to
  $1/(2\sqrt {Da})$ within the aforementioned boundaries. Consequently, it is reasonable to define the scale of the pressure change at the leading edge as
  ${\rm \Delta} p/\rho U_e^2$ increasing with
  $\log (1/(2\sqrt {Da}))$ for most cases in this study. However, it should be noted that when the change in kinetic energy approaches unity,
  ${\rm \Delta} p$ can be equated to
  $\rho U_e^2$, which serves as the upper boundary. According to Rominger & Nepf (Reference Rominger and Nepf2011), this scaling for
  ${\rm \Delta} p$ is valid when the kinetic energy change exceeds 0.7. Adopting the same threshold here, the scaling
  ${\rm \Delta} p/\rho U_e^2 \sim 1$ is applied to the porous cylinder cases where the kinetic energy change is greater than the threshold as in the high flow-blockage case, while the result in figure 8(a) suggests
  ${\rm \Delta} p/\rho U_e^2 \sim \log (1/(2\sqrt {Da}))$ as in the low flow-blockage cases. These approaches as a dual scaling for pressure will be individually employed in the scaled equations to appropriately determine the downstream flow adjustment length depending on the flow-blockage of the porous cylinder.

Figure 8. (a) Variation of the measured kinetic energy change at the cylinder leading edge with respect to  $1/(2\sqrt {Da})$. (b) Downstream flow adjustment length as a function of the modified non-dimensional parameter
  $\gamma$. Here
  $L_{i1}$ and
  $L_{i2}$ are obtained from the analytical models (3.11)–(3.12) for the low and high flow-blockage cases, respectively. Here
  $L_{i,exp}$ is measured data. The blue and red shaded areas represent the 95
  $\%$ of interval for each (3.11) and (3.12).
An additional step must be considered before determining the flow adjustment length. Here, we consider a modified version of the non-dimensional parameter,  $\gamma = {1/(2\sqrt {Da})}/{1/(2\sqrt {Da_{c1}})}$, to properly separate low and high flow-blockage cases with respect to unity in the scaled equations. Utilizing this parameter, the low flow-blockage case can be characterized by
  $\gamma \ll 1$, while the high flow-blockage case is defined as
  $\gamma \gg 1$.
Building upon the aforementioned dual scaling for the pressure term and the modified parameter  $\gamma$, the length scale of the downstream adjustment region can now be assessed. For low flow-blockage cylinders, we presume
  $\gamma \ll 1$, which yields
  $\varPhi \sim 1$ and
  ${\rm \Delta} p/\rho U_e^2 \sim \log (1/(2\sqrt {Da}))$, as defined earlier. Consequently, (3.8) and (3.9) can be further simplified as
 \begin{equation} L_{i1} \sim 7\sqrt{K} \left[1+\log\left(\frac{1}{2\sqrt{Da}} \right) \right]. \end{equation}
 In the case of high flow-blockage cylinders, it is presumed that  $\gamma \gg 1$ and
  ${\rm \Delta} p \sim \rho U_e^2$. Therefore, after rearranging (3.8) and (3.9), the downstream adjustment length can be expressed as
 \begin{equation} L_{i2} \sim 7\sqrt{K} \left[\frac{1}{\varPhi}+\left(\frac{1}{14\sqrt{Da}} \right)^2 \right]^{1/2}. \end{equation}
 Figure 8(b) presents the downstream flow adjustment length over  $\gamma$ from the analytical models (3.11) and (3.12). In this figure, dashed and dashed–dot lines denote data computed from the analytical model for the low and high flow-blockage cases, respectively. The blue and red shaded regions indicate the 95 % of the interval for each (3.11) and (3.12). For comparison, the flow adjustment length measured from the current experimental data (i.e.
  $L_{i,exp}$) is included in figure 8(b). To be more specific,
  $L_{i, exp}$ is determined as the distance from the cylinder trailing edge to the first stagnation point behind the porous cylinders in case of high flow-blockage. Conversely, for the low flow-blockage cylinders,
  $L_{i, exp}$ is considered as the distance from the cylinder trailing edge to the point where the centreline velocity decrease diminishes to
  $\partial (\langle u \rangle /U_e) / \partial (x/D) < -0.1$. A detailed discussion for defining
  $L_{i, exp}$ based on the PIV measurements can be found in our previous work (Seol et al. Reference Seol, Hong and Kim2023).
As illustrated in figure 8(b), the results from both the experimental data and the analytical model align excellently across the measured range of  $\gamma$. Notably,
  $L_{i1}$ from (3.11) for the low flow-blockage cylinders exhibits a local maximum observed in Regime IV, which is followed by a gradual decrease as
  $\gamma$ increases. This trend well represents our experimental results as observed in figure 8(b). In contrast, for the high flow-blockage cylinders,
  $L_{i2}$ diminishes rapidly as
  $\gamma$ increases, maintaining a close agreement with the experimental data. It is worth noting that the lower boundary of this decrease in
  $L_{i2}$ is analytically defined as
  $D/2$ (Rominger & Nepf Reference Rominger and Nepf2011), and the
  $L_{i1}$ value for the porous cylinder with the highest flow-blockage in this study (i.e. A1) is
  $0.68D$, which is close to the lower limit. However, the current study lacks sufficient cases representing the one with a
  $\gamma$ higher than that of A1 across the Regime II to I as seen in figure 8(b). Despite this, both (3.11) and (3.12) correspond well with the experimental results through Regime II, III and IV, indicating the validity of the analytical models based on the permeability characteristics of the porous cylinders.
To explore the role of the downstream flow adjustment length as a characteristic length scale in the flow past porous cylinders, we plotted the mean longitudinal velocity profiles along the centreline, normalized by the upstream velocity  $U_e$ and the downstream adjustment length
  $L_{i,exp}$ as determined from current measurements, as shown in figure 9. This plot considers three representative porous cases (B1, B7 and C5) to emphasize the decelerating behaviour of the flow around the porous square cylinder relative to
  $Da$. Case B1 (
 $Da=5.8\times 10^{-5}$) exemplifies a high flow-blockage case within Regime II, whereas cases B7 (
 $Da=6.7\times 10^{-4}$) and C5 (
 $Da=2.9\times 10^{-3}$) represent low flow-blockage conditions in Regimes III and IV, respectively. It is worth noting that the velocity profiles upstream of the cylinders are also included in figure 9 to show the flow deceleration due to the presence of the cylinder. For normalization, their adjustment lengths, denoted as
  $L_{o,exp}$, were obtained from the PIV data, in the same manner as those of low flow-blockage cylinders, although the upstream adjustment length was not analytically evaluated in this study.

Figure 9. Longitudinal profiles of mean velocity ( $\langle u \rangle / U_e$) along the centreline of the cylinder (
 $y/D=0$) for selected porous cases. The
  $x$-axis is normalized by the measured
  $L_{i,exp}$ for
  $x>0$ and
  $L_{o,exp}$ for
  $x<0$. Vertical dashed line denotes the longitudinal position where
  $x/L_{i,exp}=1$.
Figure 9 captures the flow deceleration occurring both upstream and downstream of the porous cylinders, revealing a consistent decreasing trend across a certain span. However, the structural behaviour of the mean velocity behind the cylinder varies depending on  $Da$ when scaled with the downstream adjustment length
  $L_{i,exp}$. For example, the velocity profile of B1 in figure 9 shows a continuous decline in the near wake and becomes negative at the first stagnation point (
 $x/L_{i,exp}=1$), thereby forming a recirculation bubble
  $-$ a distinguishing feature of high flow-blockage case. In contrast, the velocity profile of B7 decreases at a similar rate to B1, progressing to a steady wake region around
  $x/L_{i,exp} \sim 1$ as illustrated in figure 9. This region is marked by a positive and constant velocity, which indicates a low flow-blockage case. It is noteworthy that the velocity profile for B7 diverges from that of B1 near
  $x/L_{i,exp} \sim 1$, which marks the end of the downstream flow adjustment following the porous cylinder. In the case of C5, there is a noticeably shorter range of flow deceleration under the same rate to B1 and B7 behind the cylinder, and the profile starts to deviate from B1 and B7 much sooner. This distinct behaviour in C5, as shown in figure 9, is likely due to its significantly higher
  $Da$ within Regime IV, which generates essentially different downstream flow characteristics with a dominance of small-scale vortices (Nicolle & Eames Reference Nicolle and Eames2011; Chang & Constantinescu Reference Chang and Constantinescu2015).
To further explore the scaling effect on the mean longitudinal velocity profile based on the downstream flow adjustment length, figure 10 exhibits the velocity profiles for all porous cases considered in this study, using different normalization methods. Figure 10(a) illustrates the mean longitudinal velocity profiles with the  $x$-axis normalized by
  $D$. In contrast, figure 10(b) displays the same profiles with the
  $x$-axis normalized by both upstream and downstream adjustment length (i.e.
  $L_{o,exp}$ and
  $L_{i,exp}$) in the same manner to figure 9. Additionally, grey open and solid symbols are included for comparison in figures 10(b) and 10(c), and these extensive datasets are from Chen et al. (Reference Chen, Ortiz, Zong and Nepf2012), studying the flow past 2-D porous circular cylinders. Despite the different cross-sectional shapes of the cylinder between the current study and those in Chen et al. (Reference Chen, Ortiz, Zong and Nepf2012), the data remain comparable since the flow adjustment observed in circular and square porous cylinders does not significantly differ, as noted by Vandenbruwaene et al. (Reference Vandenbruwaene2011).

Figure 10. Longitudinal profiles of mean velocity ( $\langle u \rangle / U_e$) along the centreline, (a) normalized by the cylinder width
  $D$, (b) normalized by the measured
  $L_{i,exp}$ for
  $x>0$ and
  $L_{o,exp}$ for
  $x<0$ and (c) normalized in the same manner as (b) but highlighting the collapsing trend near the porous cylinders. Symbols for the current study are summarized in table 1. Grey open and solid symbols are from figure 4 in Chen et al. (Reference Chen, Ortiz, Zong and Nepf2012).
Figure 10(a) reveals that the velocity profiles, when normalized by the cylinder diameter  $D$, display significant dispersion rather than alignment. This suggests that
  $D$ may not be an appropriate scale for characterizing the centreline longitudinal velocity directly behind the porous cylinder, supporting conclusions from earlier studies (Chen et al. Reference Chen, Ortiz, Zong and Nepf2012; Zong & Nepf Reference Zong and Nepf2012). In contrast, figures 10(b) and 10(c) demonstrate that when the profiles are normalized by
  $L_{i,exp}$, they converge, reflecting a rapid and uniform flow adjustment in the near wake. These profiles begin to diverge at around
  $x/L_{i,exp} \sim 1$ across different
  $Da$ values, except for cases C4 and C5 within Regime IV. For high flow-blockage cases (
 $Da< Da_{c1}$), the initial part of the recirculation bubbles – from the upstream stagnation point to the local minimum of
  $\langle u \rangle / U_e$ – are closely aligned, as shown in figure 10(b). The length of these bubbles, identified by the points where
  $\langle u \rangle / U_e = 0$, is in order and varies with
  $Da$, as evidenced in figure 4(a). For cases within Regime III (
 $Da_{c1}< Da< Da_{c2}$), figures 10(b) and 10(c) indicate that the steady wake velocity
  $U_{sw}$ is
  $Da$-dependent for each case (Chen et al. Reference Chen, Ortiz, Zong and Nepf2012). Nonetheless, all cases exhibit a consistent transition to a steady wake region near
  $x/L_{i,exp} \sim 1$, aligning with the behaviour of high flow-blockage cases in this study and with the dataset reported by Chen et al. (Reference Chen, Ortiz, Zong and Nepf2012) for porous cylinders of circular cross-section. It is also noteworthy that the cases with significantly higher
  $Da$ in Regime IV show an early departure from the decelerating trend of the mean velocity before reaching
  $x/L_{i,exp} = 1$, as illustrated in figure 9.
Observations from figures 9 and 10 highlight several notable points. Firstly, the downstream adjustment length  $L_i$ is confirmed as the appropriate scaling parameter for the near-wake flow adjustment, corroborating findings from previous experimental studies (Chen et al. Reference Chen, Ortiz, Zong and Nepf2012; Zong & Nepf Reference Zong and Nepf2012). Additionally, our results affirm that the current analytical model, which evaluates
  $L_i$ in relation to permeability, accurately captures the flow adjustment characteristics behind the porous cylinder. The longitudinal velocity profiles illustrated in figure 10(b) also display a pattern that aligns with those documented in Chen et al. (Reference Chen, Ortiz, Zong and Nepf2012), lending further support to the conclusion that the flow adjustments for porous circular and square cylinders exhibit no substantial differences (Vandenbruwaene et al. Reference Vandenbruwaene2011).
Another point of interest arises from figure 10(b), suggesting that wake length – defined as the distance between two stagnation points for the mean longitudinal velocity  $\langle u \rangle / U_e$ along the centreline (
 $W_r$, see figure 4a) – may be influenced by the interplay between two flow characteristics: the downstream adjustment length
  $L_i$ and the growth of the shear layer emanating from the porous cylinder. As reported by Zong & Nepf (Reference Zong and Nepf2012) and Nicolai et al. (Reference Nicolai, Taddei, Manes and Ganapathisubramani2020), the downstream wake structure is significantly influenced by two distinct bleeding flows through the porous cylinder, one in the longitudinal direction and the other laterally. Although their full impact requires further investigation, it was established that the overall wake length correlates with the longitudinal bleeding in relation to the dimensionless parameter
  $C_DaD$ (Zong & Nepf Reference Zong and Nepf2012), while lateral bleeding plays a pivotal role in mitigating wake entrainment and thus affects wake recovery (Nicolai et al. Reference Nicolai, Taddei, Manes and Ganapathisubramani2020). With this understanding, there is potential to advance the analysis of wake length
  $W_r$ by exploring how the downstream adjustment length
  $L_i$, which determines the location of the upstream stagnation point, interacts with the shear layer growth as a result of the wake entrainment that dictates the position of the downstream stagnation point, especially considering the effects of lateral bleeding. Such an analytical approach for future work would provide a more detailed and quantitative framework to support our qualitative observations in figure 3, illustrating the rapid downstream migration of the upstream stagnation point of the recirculation bubble with increasing
  $Da$, while the downstream stagnation point appears to remain relatively stationary.
Lastly, figures 10(b) and 10(c) reveal that the upstream flow adjustment length seems to be correlated to the distance from the cylinder leading edge to the point where the centreline velocity decrease diminishes to  $\partial (\langle u \rangle /U_e) /\partial (x/D) < -0.1$, and they are dependent on cylinder permeability (see table 1). The observation suggests that the upstream flow adjustment length can also be modelled based on permeability, aligning with the previous study that proposed an analytical model for
  $L_o$ with respect to the cylinder drag length scale (Chen et al. Reference Chen, Ortiz, Zong and Nepf2012, Reference Chen, Jiang and Nepf2013).
4. Summary
In this paper, we conducted an experimental investigation into the influence of permeability on the wake characteristics of porous square cylinders at high Reynolds numbers ( $Re \sim O(10^4)$). Utilizing a periodic and scalable lattice structure, we fabricated structured porous square cylinders with high-resolution 3-D printing, enabling us to isolate permeability from porosity. This novel design marks a first in experimental studies of flow past or around porous media, with permeability acting as an independent control parameter across a broad range of Darcy numbers (
 $2.4 \times 10^{-5} < Da < 2.9 \times 10^{-3}$).
High-resolution PIV measurements, coupled with the present structured porous square cylinders, revealed a detailed wake structure influenced by  $Da$. This methodology facilitates the classification of four distinct flow regimes based on
  $Da$: Regime I, effectively impervious regime (
 $Da < 1.0 \times 10^{-6}$), exhibits a main recirculation bubble immediately behind the porous cylinder; Regime II, transitional (
 $1.0 \times 10^{-6} < Da < 2.0 \times 10^{-4}$), displays a shrinking and detaching recirculation bubble that vanishes at
  $Da_{c1}$; Regime III, effectively permeable (
 $2.0 \times 10^{-4} < Da < 1.0 \times 10^{-3}$), has no downstream reverse flow, replaced by a uniform velocity region; and Regime IV, highly permeable (
 $Da > 1.0 \times 10^{-3}$), lacks a cylinder-scale vortex street but features small-scale vortices from the lattice struts.
Moreover, our results establish a solid correlation between the aerodynamic drag of the porous cylinder and its permeability, suggesting the log–linear relationship is valid for both low and high  $Re$ flows. Additionally, we refined the methodology for determining the downstream flow adjustment length (
 $L_i$), which was previously defined by the drag coefficient and frontal area density (
 $C_Da$) (Rominger & Nepf Reference Rominger and Nepf2011; Chen et al. Reference Chen, Ortiz, Zong and Nepf2012). Our approach integrates the Darcy–Brinkman–Forchheimer model directly into the momentum equation, utilizing permeability (
 $K$) rather than
  $C_Da$. This integration introduces two important parameters: the cylinder drag length (
 $\sqrt {K}$) and the non-dimensional flow-blockage (
 $1/(2\sqrt {Da})$). The drag length scale has been consistently documented in past studies on turbulent flow overlying porous media (Manes et al. Reference Manes, Poggi and Ridolfi2011; Kim et al. Reference Kim, Blois, Best and Christensen2020; Suga et al. Reference Suga, Okazaki and Kuwata2020), thus confirming the robustness of our analytical framework. The flow-blockage parameter enables a dual scaling technique for pressure, differentiating between high (
 $1/(2\sqrt {Da}) \gg 1/(2\sqrt {Da_{c1}})$) and low flow-blockage cases (
 $1/(2\sqrt {Da}) \ll 1/(2\sqrt {Da_{c1}})$).
Leveraging this dual scaling in the momentum equations, we proposed a new analytical model to assess  $L_i$ in terms of permeability, which has been substantiated by our experimental data. Additionally,
  $L_i$ proved to be an effective scaling factor for the mean longitudinal velocity profiles along the cylinder centre across all porous cases, revealing a rapid and consistent flow adjustment in the near wake. This observation confirms that
  $L_i$ plays a crucial role as a characteristic length scale for the flow past the porous cylinder and further validated our analytical model for
  $L_i$. Thus, the present analytical model, which relies directly on permeability, would offer a new perspective for computational works addressing fluid flow past porous cylinders in high
  $Re$ regimes with enhanced robustness and suitability.
Funding
This work was supported by the National Research Foundation of Korea (NRF) grant funded by the Korea government (MSIT) (RS-2023-00246037). Also, this work was supported by the Korea Institute for Advancement of Technology (KIAT) grant funded by the Korea Government (Ministry of Trade, Industry and Energy) (P0012744, The Competency Development Program for Industry Specialist).
Declaration of interests
The authors report no conflict of interest.


