There has been a recent resurgence of interest in nutritional assessment of children, driven mainly by the advent of the obesity epidemic(Reference Reilly1) but there is also an increasing awareness of its importance in the assessment of underweight, with recognition that a low BMI can reflect a low lean mass rather than low fat stores, which has important implications for nutritional management(Reference Burnham, Shults and Semeao2, Reference Sullivan, Alder and Bachlet3). Assessing body composition robustly is labour intensive and expensive, and is particularly difficult in a field or clinical setting. There is thus a need for a relatively simple but reliable measure of body composition. Bioelectrical impedance analysis (BIA) offers a potential solution to this practical problem, but its use in childhood has been limited by a lack of child norms and doubts about its validity. BIA is actually a measure of lean mass, but as both lean and fat mass vary with height, estimates derived from BIA are usually presented as percentage fat ((total mass − lean mass)/total mass) as a simple means of adjusting fat mass for size. As a measure of adiposity in adults this has merit, but it has the effect of rendering lean mass invisible. In children, lean mass constitutes around 85 % of body weight, and varies considerably with age and sex(Reference Fomon, Haschke and Ziegler4, Reference Maynard, Wisemandle and Roche5) and in some disease states(Reference Sullivan, Alder and Bachlet3, Reference Wright, Sherriff and Ward6). A child with a low lean mass could thus have a high percentage fat, despite a normal or even low fat mass(Reference Armstrong and Welsman7). We therefore recognised the importance of developing a method of manipulating BIA to produce indices of lean and fat mass which were independent of each other, and adjusted for size, sex and age, and we have recently described our method for calculating these new indices expressed relative to a representative cohort of UK children at a single age (7 years)(Reference Wright, Sherriff and Ward6).
The essential validity of BIA as a measure has not yet been fully established so we consider in more depth here whether these indices measure something useful and meaningful. In our first paper we were able to show that lean and fat indices varied in the expected manner between children with different body types and across the BMI range(Reference Wright, Sherriff and Ward6). In the present paper we will explore whether variations in lean index correlate with functional measures that can be expected to relate to lean mass. We hypothesise that measures of aerobic fitness and strength (available for the Avon Longitudinal Study of Parents and Children (ALSPAC) cohort) should be positively associated with the lean index(Reference Armstrong and Welsman7, Reference Malina and Bouchard8), but either unrelated to, or inversely associated with, fat index.
The aims of the present study therefore were: (1) to extend our methodology using data from the same cohort to derive lean indices and fat indices for children between 7 and 11 years; and (2) to further explore the biological and functional significance of this measure of lean mass, using data on muscle function and fitness.
Materials and methods
Subjects
The ALSPAC(Reference Golding, Pembrey and Jones9) is a prospective study of 14 541 pregnancies (14 062 live births) to women resident within the former county of Avon, UK with expected dates of delivery from 1 April 1991 to 31 December 1992. Data for the present study were gathered from the children attending the 7, 9, 10 and 11 years research clinics where the entire cohort was invited for detailed physical examinations. Ethical approval was obtained from the ALSPAC Law and Ethics Committee and Local Research Ethics Committees.
Anthropometric data
Height was measured to the last completed millimetre using a Harpenden stadiometer. Weight was measured to the nearest 50 g using the Tanita body fat analyser and weighing scale. Standard deviation scores for BMI (weight, kg/height, m2) were calculated relative to 1990 UK reference data(Reference Cole, Freeman and Preece10).
Impedance data
Foot-to-foot BIA (Tanita body fat analyser TBF 305) was measured at 7, 9, 10 and 11 years whilst standing erect with bare feet on the analyser's footpads. Measurements were taken only on medically well children, after being asked to empty their bladder and undress to underclothes. Arm-to-leg BIA (Bodystat 1500 Body Composition Unit) was also measured at 7 years which allowed assessment of the correspondence between the two measures.
Cardio-respiratory fitness data at 9 years
The measure used for cardio-respiratory fitness (CRF) was physical work capacity (measured in W) at a heart rate of 170 beats per min (bpm). This was measured using an electronically braked cycle ergometer (Lode Rechor P) with the saddle and handle bar height adjusted for each child. After a 1 min warm up children pedalled at 55–65 rpm for 3 min at each workload (20, 40 and 60 W), followed by a 2 min cool down. Heart rate was recorded every 5 s using a heart rate monitor with chest strap (Polar S180). The mean heart rate during the last minute of each stage was used in linear regression models to predict the workload required to elicit a heart rate of 170 bpm. For successful completion children were required to achieve a heart rate of 80 bpm in the first stage, indicating a response to the workload, and 150 bpm in the third stage of the test, approximately equivalent to a workload >70 % of maximum heart rate. This also meant that all children exercised at a capacity close to the predicted value of 170 bpm.
Grip strength at 11 years
Grip strength was measured using the Jamar Hand Dynamometer (isometric strength in kg). Grip strength was measured twice in each hand and the mean grip strength for both hands was used ((left+right)/2).
Statistical methods
All analyses were done using Stata Statistical Software version 9.0 (StataCorp, College Station, TX, USA).
Lean and fat indices 7–11 years
The present study, built on our previously published method, developed in this sample at age 7 years(Reference Wright, Sherriff and Ward6). For this analysis a more recent regression equation(Reference Abbott, Edmiston and Grayson11) allowed us to predict total body water (TBW) directly from Tanita foot-to-foot BIA:
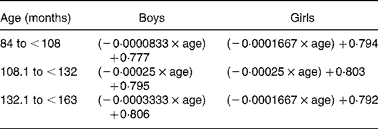
An estimate for lean mass was produced by adjusting this quantity for age- and sex-specific hydration constants(Reference Lohman12) using linear interpolation between two points. Fat mass was obtained by subtracting lean mass from total weight. Lean mass was loge transformed and fat mass was transformed using a Box-Cox transformation, λ = 0·14 for boys and λ = 0·03 for girls. These transformations successfully normalised the respective distributions and generally stabilised the variances within height and age groups so that basic assumptions of homoskedasticity (equality of variances) were satisfied. Boys and girls were modelled separately at all stages of analysis.
Linear regression models (regress) were produced for lean and fat mass as functions of height and age (centred) using the cluster command with robust standard errors in Stata. This accounts for within-person variation, since most children had measurements taken on more than one occasion. These were done separately for boys and girls. Quadratic terms for these explanatory variables (height and age) were considered, but as none explained more than 1 % of the total variation, more parsimonious models were chosen. The standardised residuals obtained from the models estimated the vertical distance each child measured from the regression line and constituted the fat index and lean index, respectively. These indices represented a ranking of individuals for fat and lean mass within the cohort, after adjustment for height and age and were calculated thus:
Residual diagnostic plots were examined to ensure the chosen models satisfied the distributional assumptions. These included viewing the histograms and Q–Q plots of the fat and lean indices (standardised residuals from model). We were generally satisfied that there was no systematic misspecification of the models and that the residuals were approximately normally distributed with constant variance, although at age 7 the variance of the fat index was 20 % lower for girls and 10 % lower for boys than at later ages.
Functional associations with lean and fat indices
Scatter plots of lean index and fat index at 9 and 11 years against CRF at 9 years and grip strength at 11 years were used to assess whether the observed associations were likely to be linear (not shown). Associations between lean index and CRF at 9 years and grip strength at 11 years, adjusted for height, were analysed using Pearson's partial correlation coefficients. The 95 % CI were calculated using Fisher's z transformation. Mean values and 95 % CI were calculated for fitness measures at 9 years and grip strength at 11 years according to contemporaneous lean and fat index quartile.
Relationship between foot-to-foot and arm-to-leg impedance
Foot-to-foot and arm-to-leg data both collected at age 7 were compared using linear regression to generate a correction factor to allow the formulae given earlier(for foot-to-foot data) to be used on arm-to-leg data.
Results
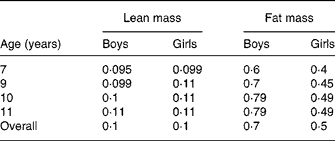
Table 1 provides details of the characteristics of the children participating in the study and their lean and fat indices stratified by age. Table 2 shows a comparison of the key variables (lean index, fat index and BMI z score) between those with functional measures (CRF, grip strength) and those without. Differences between children with and without functional measures were quite small. BMI z scores appeared to be higher in those children who did not have measures of grip strength by approximately one-tenth standard deviation.
Table 1 Characteristics of children taking part in the study, stratified by age
(Mean or median values and standard deviations)

* Expressed relative to UK 1990 reference data(Reference Cole, Freeman and Preece10).
Table 2 Comparing values of key variables with and without cardio-respiratory fitness (CRF) or grip strength measures*
(Mean values and standard deviations)
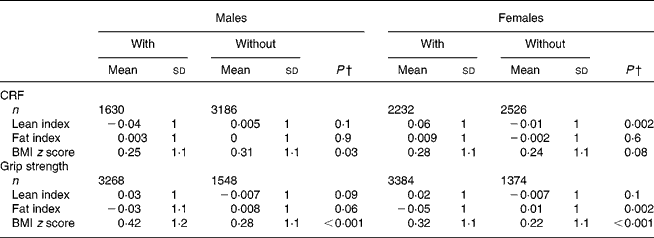
* For details of subjects and procedures, see Materials and methods.
† P values based on Student's t test.
Lean and fat indices
BIA, height and weight data collected at the 7, 9, 10 and 11 years clinics were combined (after cleaning) into a single dataset yielding 30 238 measures on 9574 (4816 boys) children; 5454 children had all four measures, 1682 had three measures, 938 had two measures and 1500 had only a single measure.
Table 3 shows the parameter estimates from the clustered regression analyses of fat and lean mass adjusted for height and age and separately for boys and girls. We used these models to calculate fat and lean indices for individual children (aged between 7 and 11 years) as shown in Appendix 1.
Table 3 Parameter estimates for clustered linear regression models of fat and lean mass in boys and girls*
(Estimates and standard errors)
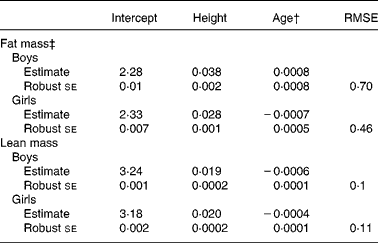
RMSE, root mean square error ( = standard deviation of residual).
* For details of subjects and procedures, see Materials and methods.
† Age coefficients not significant for fat mass, but retained in model for comparison with coefficients for lean mass.
‡ Fat mass transformed using Box-Cox transformation where λ = 0·14 for boys and λ = 0·03 for girls.
The lean index for both sexes is reasonably normally distributed, although the fat index for each sex is slightly skewed (Fig. 1). In order to calculate lean and fat indices for arm-to-leg (Bodystat) machines, the following conversion equation (derived at the 7 years clinic where both arm-to-leg and foot-to-foot impedance machines were used) can be used:
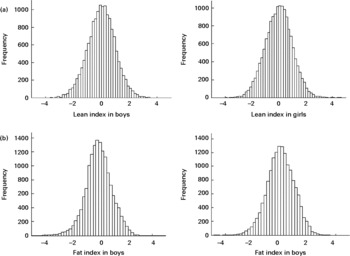
Fig. 1 Histograms of lean index (a) and fat index (b) in boys and girls.
Cardio-respiratory fitness at 9 years
The 9 years clinic was attended by 7779 children at median age 9·8 years (range 9·2–11·7); of these, 6869 participated in the fitness test, but only 3906 (1644 boys) successfully completed it. The 20 min time slot allotted for the sub-maximal test meant that some children failed to complete the test due to the settings being too high, and others failed to achieve substantial differences in heart rate due to the settings being too low. However, those who completed the CRF task were not appreciably different to those who failed to complete in terms of key socio-demographic indicators (maternal education, ownership of home); 66 % of girls completed the test compared with 48 % of boys.
Mean value for CRF was higher in boys than girls (see Table 1). Fig. 2 shows the distribution for CRF in ALSPAC. There was a moderate positive association between CRF and lean index measured at the same age, slightly stronger for girls than boys (Table 3; Fig. 3): correlation coefficient r boys 0·20 (95 % CI 0·15, 0·25), r girls 0·26 (95 % CI 0·22, 0·30). There was no clear association with fat index: r boys − 0·02 (95 % CI − 0·07, 0·03), r girls 0·03 (95 % CI − 0·01, 0·07). CRF was also positively associated with BMI z score, but less strongly: r boys 0·11 (95 % CI 0·06, 0·16), r girls 0·17 (95 % CI 0·13, 0·21).
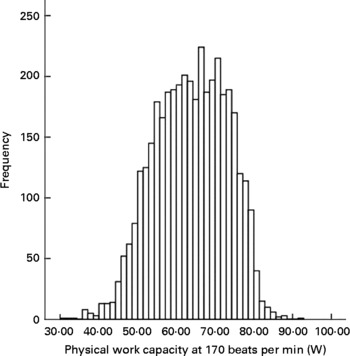
Fig. 2 Histogram of cardio-respiratory fitness in the Avon Longitudinal Study of Parents and Children at 9 years.

Fig. 3 Cardio-respiratory function (peak working capacity (pwc170)) at 9 years according to lean index quartile (a) and fat index quartile (b) in boys (●) and girls (○). HR, heart rate.
Grip strength at 11 years
The 11 years research clinic was attended by 7159 children of whom 6685 (3281 boys) performed the grip strength task (median age 11·8; range 10·4–13·6). On average, boys had higher grip strength than girls (Table 1). Fig. 4 shows the distribution of grip strength in ALSPAC. There was a moderate positive correlation of grip strength with lean index measured at the same age, with the relationship slightly stronger in boys (Table 4; Fig. 5): r boys 0·29 (95 % CI 0·26, 0·32), r girls 0·26 (95 % CI 0·23, 0·29). There was no apparent association between fat index and grip strength: r boys 0·04 (95 % CI 0·006, 0·07), r girls 0·09 (95 % CI 0·06, 0·12). BMI z score was also positively correlated with grip strength: r boys 0·20 (95 % CI 0·17, 0·23), r girls 0·21 (95 % CI 0·18, 0·24).
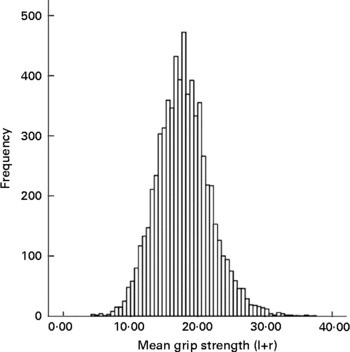
Fig. 4 Histogram of grip strength in Avon Longitudinal Study of Parents and Children at 11 years. l+r, left+right hand.
Table 4 Partial correlation coefficients (r) for lean index, fat index and BMI z score and cardio-respiratory fitness (CRF; peak working capacity) at 9 years and grip strength at 11 years (adjusted for height)*
(Correlation coefficients and 95 % confidence intervals)

* For details of subjects and procedures, see Materials and methods.
† Expressed relative to UK 1990 reference data(Reference Cole, Freeman and Preece10).
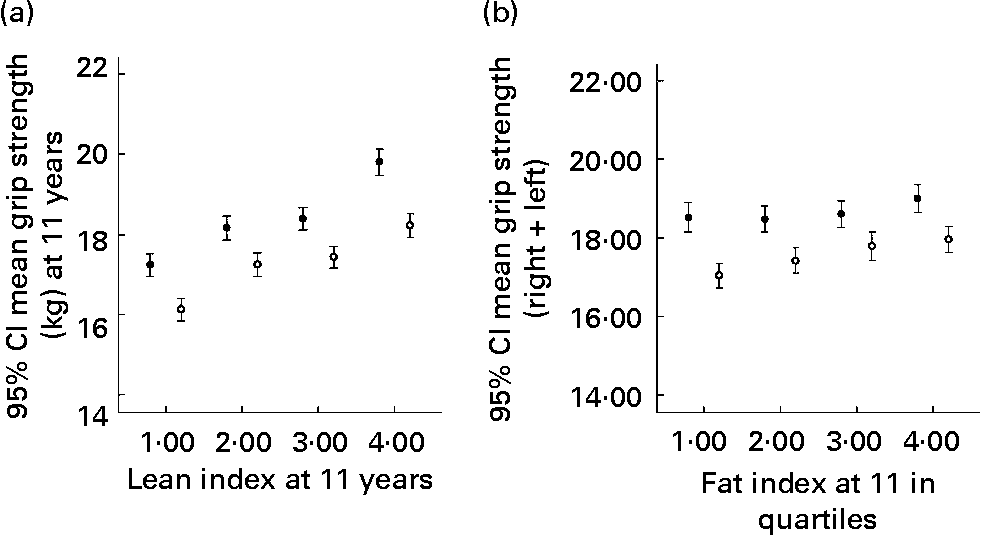
Fig. 5 Grip strength at 11 years according to lean index quartile (a) and fat index quartile (b) in boys (●) and girls (○).
Discussion
The present paper has presented a method of computing BIA data, standardised for ages 7–11 years against a large contemporary cohort of children, using either Tanita (foot-to-foot) or Bodystat (arm-to-leg) machines to produce independent indices of fat and lean adjusted for height, age and sex. We have explored their association with two functional measures of lean mass and found a positive linear relationship of both grip strength and CRF with lean index and to a lesser extent with BMI, but no clear association with fat index.
The great strengths of the present study are the availability in a large contemporary cohort of children of a set of demanding measurements collected to research quality. The prospective nature of the study also means that the functional measures can be tested against simultaneously collected body composition data, as well as supplying norms for lean and fat indices across the period of mid-childhood. There was participant dropout over time, as is inevitable in such studies, but even so this still represents an exceptionally large dataset which remains broadly representative of the UK.
For the CRF task there was substantial missing data due to failure to complete the test successfully, but the sample obtained was still large enough to show meaningful internal associations.
The associations observed between lean index and the two functional measures in the present study were only moderate; there are several possible reasons for this. Firstly, CRF and grip strength are determined by many more factors than simply muscle mass. Secondly, although we used the best available measures of fitness for use in childhood which were feasible within such a large-scale study, these are still relatively imprecise, as the measurement and interpretation of CRF, particularly in children, is challenging(Reference Fernhall and Unnithan13, Reference Gibson14). Finally, while muscularity is likely to correlate with fitness and grip strength, lean mass is a heterogeneous construct which includes components such as the major organs, bone and muscle, thus inevitably weakening the observed association(Reference Armstrong and Welsman7, Reference Malina and Bouchard8).
It is of interest that the fat index was essentially unrelated to both functional measures, when one considers that overfat children also tend to have high lean indices(Reference Wright, Sherriff and Ward6). This would suggest that the increase in lean in obese children is a reflection of the greater mass of fat to be carried by the frame, as opposed to generally greater muscularity or fitness. It is also of note though that raised fat was not associated in this cohort with decreased fitness, suggesting that some of the physical complications of obesity do not become manifest until adulthood.
A major barrier to nutritional assessment in children is the widespread perception that the assessment methods and definitions of under- and over-nutrition which are currently available lack functional significance and are just ‘arbitrary’(Reference Reilly1). We have previously described the development of the lean index and shown that it can discriminate between groups of children with chronic conditions expected to cause differing body compositions(Reference Wright, Sherriff and Ward6). The associations between lean index and muscle strength and fitness now provide further support for the view that the lean index is biologically meaningful, rather than simply being a statistical construct.
The present results add further weight to the principle that measures of body composition, particularly when used to assess underweight or small children, should present indices of fat and lean separately, rather than as percentage fat, which in effect conceals all potential variance in lean. Other authors have suggested that a lean and fat index should be generated by simply dividing fat and lean mass respectively by height squared(Reference Wells15). While this is preferable to using percentage fat alone, this still leaves substantial confounding by height(Reference Maynard, Wisemandle and Roche5, Reference Wright, Sherriff and Ward6). While our approach may appear complex, in practice all BIA data need to be transformed using formulae, so it makes more sense to apply a method that completely adjusts for height. To use this method one needs normative data, but if this methodology were to be applied to other large representative impedance datasets at earlier or later ages, it should be feasible to construct norms to span most of childhood and adolescence. In this analysis children age 7 showed the least variation in fat mass which might suggest that in adolescence differences in age at onset of puberty produce greater variation. Full measures of pubertal progression are not yet available for this cohort but, in principle, future analyses might allow age of puberty to be added to the model. A practical implication is that using the overall standardised scores produces an impression of underdispersion at younger ages, particularly for girls, and it thus may be necessary when used at the lower extreme of age to use the age-stratified standard deviation to produce the standardised scores (provided in Appendix 1).
BIA, like all other field measures of body composition, is far from perfect. BIA is unsuitable for use in children with any derangement of fluid balance or unusual limb:body proportions, but it does provide a whole-body estimate, unlike skinfolds or waist circumference, and is much more portable than dual-energy X-ray absorptiometry. Both BIA and dual-energy X-ray absorptiometry rely on transformation formulae of some kind, which will only be as good as the norms on which they are based and a previous study found that both BIA and dual-energy X-ray absorptiometry showed similar levels of (in)accuracy(Reference Parker, Reilly and Slater16). Our re-manipulation of BIA, while it relies perforce on the limited available data on validation against gold standard methods, has now been standardised against a huge normative dataset. Nonetheless, for clinical purposes when these methods are applied to individuals, a combination of measures is still probably the safest way to arrive at a robust assessment.
In conclusion, we have produced norms for BIA-derived lean and fat indices by age and sex for children aged 7–11 years. The present data suggest that the lean index has functional significance while the absence of associations between the fat index and the two functional measures provide support for the fat index as a measure of nutritional status.
Acknowledgements
We are extremely grateful to all the families who took part in this study, the midwives for their help in recruiting them, and the whole ALSPAC team, which includes interviewers, computer and laboratory technicians, clerical workers, research scientists, volunteers, managers, receptionists and nurses. Also we are grateful to Dr Ashley Cooper and Professors Chris Riddoch and Debbie Lawlor for their contribution to the collection and management of the cardio-respiratory data. The UK Medical Research Council, the Wellcome Trust and the University of Bristol provide core support for ALSPAC. This publication is the work of the authors and A. S. and C. W. will serve as guarantors for the contents of this paper. This analysis was specifically funded by the British Heart Foundation. There are no conflicts of interest. C. W., J. J. R. and J. M. designed the study and contributed to the interpretation of results and writing the manuscript. A. S. performed statistical analyses, and contributed to the interpretation of results and writing the manuscript. P. E. and A. N. were involved in the data collection and interpretation of results.
Appendix
Method of calculation of Tanita (leg-to-leg) bioelectrical impedance analysis-derived fat and lean indices
Inputs
BIA in ohms from Tanita machine, height (ht, cm), weight (wt, kg), age (months). Mean heights for centring: boys, 139·4 cm; girls, 139·7 cm. Mean ages for centring: boys, 118·2 months; girls, 118·7 months. λ (Box-Cox transformation): boys, 0·14; girls, 0·03.
Table A1. Hydration constant
Formulae


Table A2. Standard deviation of fat and lean mass stratified by age and sex
