Good dietary habits increase the likelihood of living a long and healthy life by preventing diet-related diseases( Reference Guilbert 1 ). Studies of the relationship between previous dietary intake and future disease at an older age are therefore of value. During ageing, physiological changes and diseases increase the risk of a reduced appetite. As a consequence, protein–energy malnutrition (malnutrition) increases with ageing( Reference Vanderwee, Clays and Bocquaert 2 ) and it affects a significant proportion of older adults( Reference Kaiser, Bauer and Ramsch 3 , Reference Soderstrom, Thors Adolfsson and Rosenblad 4 ). This condition is associated with greater health-care costs( Reference Guest, Panca and Baeyens 5 ), worse quality of life( Reference Rasheed and Woods 6 ) and preterm death( Reference Soderstrom, Rosenblad and Adolfsson 7 ). The identification of modifiable risk factors in the diet is thus desirable for taking preventive action before malnutrition develops.
A higher percentage of fat in the diet (energy percentage (E%)) is associated with a higher energy intake (kJ (kcal)) and a higher body weight( Reference Prentice and Poppitt 9 ). The biological reason to this is that energy-dense foods are often palatable and associated with a decreased satiation, which leads to passive over-consumption( Reference Drewnowski 8 , Reference Prentice and Poppitt 9 ). Dietary fat is the most energy-dense nutrient (37·1 kJ/g (9 kcal/g)), as opposed to carbohydrates (16·7 kJ/g (4 kcal/g)) and proteins (16·7 kJ/g (4 kcal/g)). Consequently, most foods that have a high fat content also have a high energy density. Therefore, a meal can have the same weight or volume, but at the same time the fat content and thereby the energy content can vary considerably( Reference Prentice and Poppitt 9 ). This could be an advantage for older adults with a decreased appetite, who prefer smaller portions but require a higher energy intake because of the risk of malnutrition.
According to nutritional guidelines for adults, the dietary intake of total fat should be in the range of 20–35 E% of the total energy intake. Food containing SFA, such as full-fat dairy foods, solid fats and red and processed meat, should be limited to <10 E%, and food with trans fats, such as biscuits/cookies and crisps/potato chips, should be avoided (<1 E%). Instead, the diet should contain more food containing MUFA and PUFA, such as vegetable oils (olive or rapeseed oils), soft margarines, nuts and oily fish( 10 ). The aim of these recommendations is to decrease the risk of diet-related conditions such as CVD and overweight/obesity( 11 ). However, frail and sick older adults seldom have problems with overweight and obesity, but instead have a higher risk and prevalence of malnutrition( 12 ).
There is limited scientific evidence about the optimal fat intake among older adults in general and among older adults with malnutrition problems in particular( 12 ). General recommendations for specific groups such as older adults have not yet been established( 10 ). Thus, the question remains whether previous fat intake among middle-aged and older adults affects nutritional status in later life. This knowledge might facilitate the taking of preventive action before malnutrition occurs.
The aim of the present study was to examine whether a high dietary intake of fat among middle-aged and older adults is associated with the risk of malnutrition 10 years later. The hypothesis was that a previous higher energy intake from total fat would be associated with a decreased risk of malnutrition 10 years later, irrespective of the composition of fat.
Methods
Study design and setting
The data originated from three different cohorts in central Sweden: the Swedish Mammography Cohort (SMC), the Cohort of Swedish Men (COSM) and the Västerås Nutritional Assessment Study (VNAS). The SMC and COSM are two large population-based prospective cohort studies conducted in 1987–1990 (SMC) and in 1997 (SMC and COSM), which were designed to collect data on dietary intake and lifestyle factors as risk factors for chronic diseases among middle-aged and older adults( Reference Larsson, Akesson and Bergkvist 13 , Reference Lindblad, Hakansson and Svensson 14 ). The VNAS was conducted from March 2008 to May 2009 with the aim of assessing the nutritional status of people aged ≥65 years admitted to hospital( Reference Soderstrom, Thors Adolfsson and Rosenblad 4 ). The study population in the present prospective cohort study comprised participants who were included in the SMC or COSM cohorts at the baseline (1997) and in the VNAS cohort at the follow-up (2008–2009).
Study population
Swedish Mammography Cohort/Cohort of Swedish Men
The SMC included all women born in the period 1914–1949 and residing in central Sweden (Västmanland or Uppsala counties). These women received a mailed self-administrated questionnaire about diet, together with an invitation to participate in a free-of-charge mammography screening programme( Reference Lindblad, Hakansson and Svensson 14 ). In 1997, an updated and extended questionnaire was sent to participants who were still alive and who lived in the study area. This questionnaire contained 350 items about dietary intake and lifestyle factors (e.g. alcohol consumption, cigarette smoking, sleeping habits, education and employment), as well as self-reported medical history( Reference Lindblad, Hakansson and Svensson 14 ).
The COSM included all men born in the period 1918–1952 and residing in central Sweden (Västmanland or Örebro counties). Except for a few sex-specific questions, these men received the same mailed questionnaire as the participants in the SMC( Reference Larsson, Akesson and Bergkvist 13 ). The study populations have been described in detail previously( Reference Larsson, Akesson and Bergkvist 13 , Reference Lindblad, Hakansson and Svensson 14 ). The analyses in the present study are based only on questions from the 1997 questionnaire in which the same wording was used for both the SMC and the COSM. In this article, the SMC and COSM cohorts are treated as a single cohort and are referred to as the SMC/COSM cohort.
Västerås Nutritional Assessment Study
The VNAS included patients aged ≥65 years admitted to the medical, surgical or orthopaedic wards at a medium-sized county hospital in central Sweden (Västmanland county). During the hospital stay, the nutritional status of the participants was assessed by the Mini Nutritional Assessment (MNA) screening instrument. The study population has been described in detail previously( Reference Soderstrom, Thors Adolfsson and Rosenblad 4 ).
Study population of the present study
To examine the association between previous dietary fat intake and current nutritional status, the personal identification numbers for the participants in the SMC/COSM were linked with the personal identification numbers from the VNAS to identify those who were included in both studies. In total, 732 participants (n 378 women, n 354 men) were identified. After excluding individuals with values outside ±3 sd from the mean of the logarithmised intakes of total energy, total fat, carbohydrates, proteins or alcohol, 725 participants were included in the present study. A flowchart describing the recruitment of participants is presented in Fig. 1.
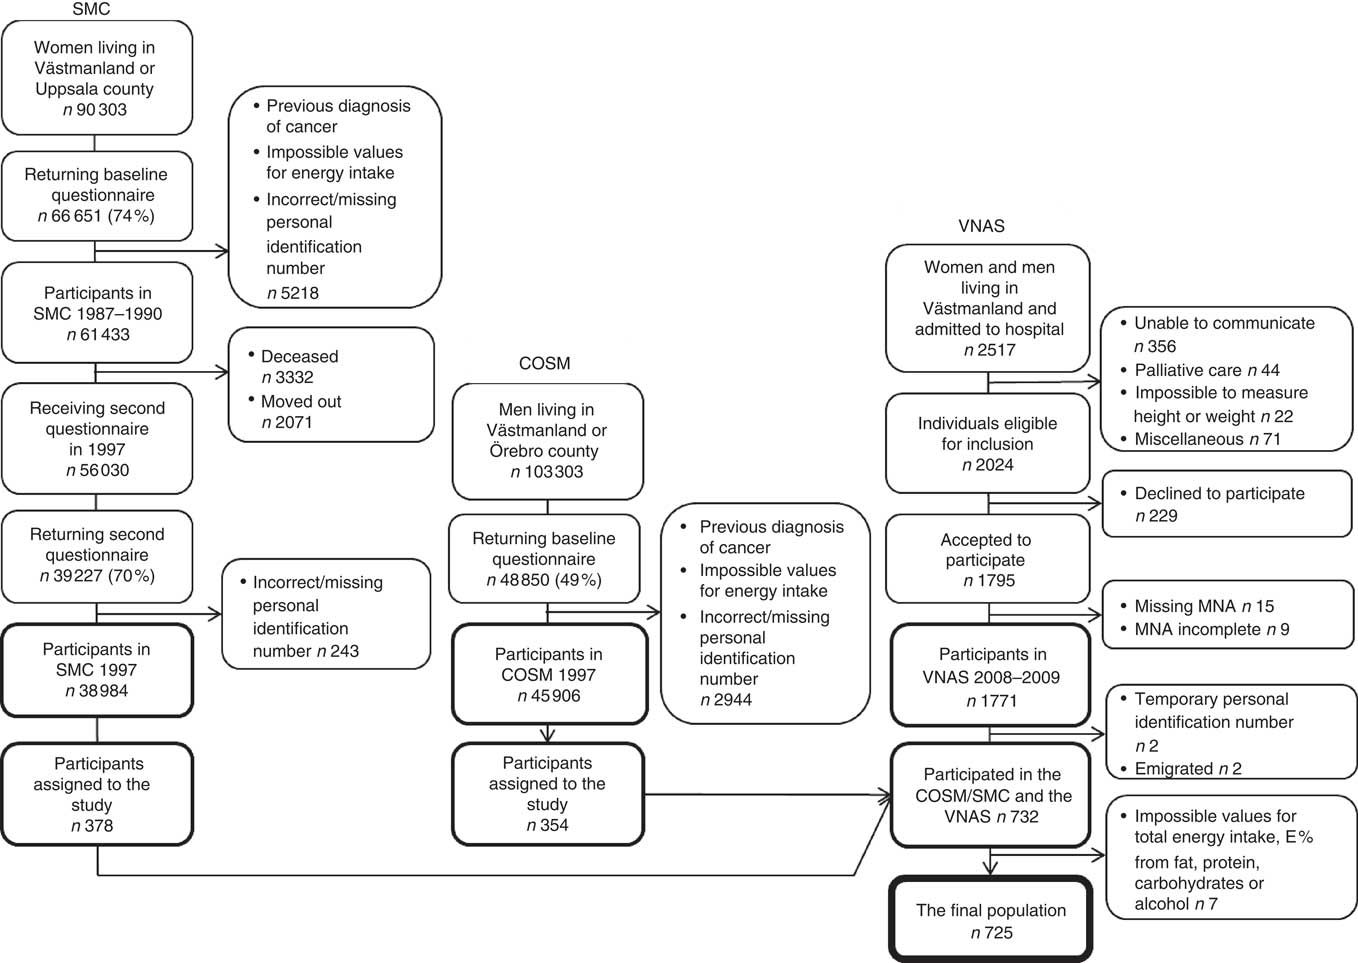
Fig. 1. Flowchart describing the participant recruitment from baseline in the Cohort of Swedish Men (COSM) and the Swedish Mammography Cohort (SMC) in central Sweden in 1997 to the 10-year follow-up in the Västerås Nutritional Assessment Study (VNAS) in 2008–2009. MNA, Mini Nutritional Assessment; E %, percentage energy.
The SMC, COSM and VNAS were approved by the regional ethical review board in Stockholm, Sweden, the ethics committee at the Karolinska Institutet (Stockholm, Sweden) and the Regional Uppsala Ethical Review Board, respectively. In the SMC/COSM cohort, it was regarded as consent when the participants returned the questionnaire. All participants in the VNAS provided their written informed consent before entering the study or, for participants unable to communicate, a relative was asked whether he/she objected to the patient’s participation in the study.
Data collection
Dietary assessment in the Swedish Mammography Cohort/Cohort of Swedish Men
A ninety-six-item FFQ was used to assess the diet at the baseline. Participants were asked to report how often, on average, they had consumed various foods and beverages during the past year, with eight predefined frequency categories ranging from never to ≥3 times a day. The nutrient intake was calculated by multiplying the frequency of intake from every food item with its nutrient content per portion, based on the normal-size portions defined by the database of the Swedish National Food Administration( Reference Bergstrom, Kylberg and Hagman 15 ). The FFQ showed moderately strong correlations among men (Spearman’s r=0·7, 0·8, 0·7 and 0·5 for total fat, SFA, MUFA and PUFA, respectively)( Reference Messerer, Johansson and Wolk 16 ), when comparing the nutrient estimates based on the FFQ with the total intake of nutrients from fourteen 24-h recall interviews.
Nutritional assessment in the Västerås Nutritional Assessment Study cohort
The validated MNA screening instrument( Reference Guigoz 17 , Reference Vellas, Guigoz and Garry 18 ) was used to evaluate the nutritional status at the follow-up. This instrument is designed to assess the nutritional status in people aged ≥65 years and comprises eighteen questions with multiple answers. The questions are based on known risk factors for malnutrition such as dietary intake, weight change, BMI, dementia, physical stress, immobility, living situation, and calf and mid-arm circumferences. Each answer is given a score of 0–3, and the patient is classified according to the total score (0–30) as well nourished (MNA score 24–30), at risk of malnutrition (MNA score 17–23·5) or malnourished (MNA score<17)( Reference Guigoz 17 ).
Statistical analyses
The outcome of interest in the present study was the nutritional status at follow-up (≥65 years of age), as assessed by the MNA. The risk factors of main interest were the E% from total fat at the baseline and its four components SFA, MUFA, PUFA and other fats. The sum of the E% for individual fatty acids (SFA, MUFA and PUFA) normally comprises 90–95 % of the total fat content. The remaining 5–10 % comprises mainly glycerol, phospholipids and sterols, and is classified as ‘other fats’ in the present study.
As potential confounding factors, the following variables measured at the baseline were included in the study: total energy intake per day (kJ/d (kcal/d)); E% from carbohydrates, protein and alcohol; sex (men/women); age( Reference Vanderwee, Clays and Bocquaert 2 , Reference Soderstrom, Thors Adolfsson and Rosenblad 4 , Reference Amaral, Matos and Teixeira 19 , Reference Pirlich, Schutz and Kemps 20 ), BMI (<25 or ≥25 kg/m2)( Reference Torma, Winblad and Cederholm 21 ) and sleeping habits (number of hours per day); cigarette smoking (yes/no)( Reference Soderstrom, Thors Adolfsson and Rosenblad 4 , Reference Amaral, Matos and Teixeira 19 , Reference Pirlich, Schutz and Kemps 20 ), alcohol consumer (never, ex- or current)( Reference Pirlich, Schutz and Kemps 20 ), educational level (high school or more/less than high school)( Reference Pirlich, Schutz and Kemps 20 ) and employment (full- or part-time employment or housewife/retired, disability pension or unemployed); and history of high blood pressure, high cholesterol concentration, vascular spasm, renal calculus or gallstone.
Categorical variables are reported as frequencies and percentages (n (%)), and continuous data are described by mean values and standard deviations. Differences between the three nutritional status groups were tested by univariate analysis using Pearson’s χ 2 test for categorical data, the Kruskal–Wallis test for discrete data and ANOVA for continuous data. Univariate differences between two nutritional status groups were tested post hoc using Fisher’s least significant difference test for continuous data.
Multinomial logistic regression analysis was used to examine the magnitude of the influence of the risk factors measured at baseline on the nutritional status at follow-up. Of the main risk factors (total fat (E%), SFA (E%), MUFA (E%), PUFA (E%) and other fats (E%)), only those with univariate P values<0·20 were included in the regression analyses. Because of a strong correlation between SFA (E%) and MUFA (E%) (Pearson’s r=0·770), total fat and SFA (Pearson’s r=0·926), total fat and MUFA (Pearson’s r=0·936), as well as between total fat and PUFA (Pearson’s r=0·437), separate regression models were constructed for total fat (E%), SFA (E%) and MUFA (E%). Both univariate and multivariate regression analyses were performed. The multivariate regression analyses were conducted in three steps, with nutritional status (reference group: well nourished) used as the response variable. First, all baseline variables with P values<0·20 in the univariate analyses were included as explanatory variables and entered simultaneously into the base model. Second, statistically non-significant variables (P>0·05) were removed from the base model through a manual backward selection procedure, in which the variables with the highest P values were removed one at a time and the model was re-estimated until the model included only statistically significant variables (reduced model). Third, all confounding variables included in the reduced model were tested for interaction effects with total fat (E%), SFA (E%) and MUFA (E%) by separately adding each interaction effect to the reduced model. Finally, all interaction effects with P values<0·05 were added simultaneously to the reduced model. All significant interaction effects were retained in the models and formed the final models. In all steps, if a variable or an interaction between two variables was significant in any of the three models it was retained in the other models. In the final model, the total effects given by adding the main and interaction effects are presented. IBM SPSS Statistics 20 (IBM Corporation) was used for all statistical analyses. For all statistical tests, a two-sided P value<0·05 was considered significant.
Results
Participant characteristics
Of the 725 participants, 51·6 % (n 374) were women. At baseline, the mean age was 66·7 (SD 7·3) years (range 53–80 years) for women and 66·7 (SD 6·9) years (range 53–79 years) for men. The mean energy intake was 7020·7 (SD 2393·2) kJ/d (1678 (SD 572) kcal/d) for women and 10 560·4 (SD 3213·3) kJ/d (2524 (SD 768) kcal/d) for men. The mean BMI was 25·5 (SD 3·8) kg/m2 for women and 26·0 (SD 3·3) kg/m2 for men.
The mean follow-up period was 10·87 (SD 0·5) years (range 10–12 years). At follow-up, 290 (40·0 %) participants were well nourished, 383 (52·8 %) were at risk of malnutrition and fifty-two (7·2 %) were malnourished according to the MNA. The mean age at follow-up was 77·5 (SD 7·2) years (range 65–92 years) for women and 77·5 (SD 6·9) years (range 65–90 years) for men.
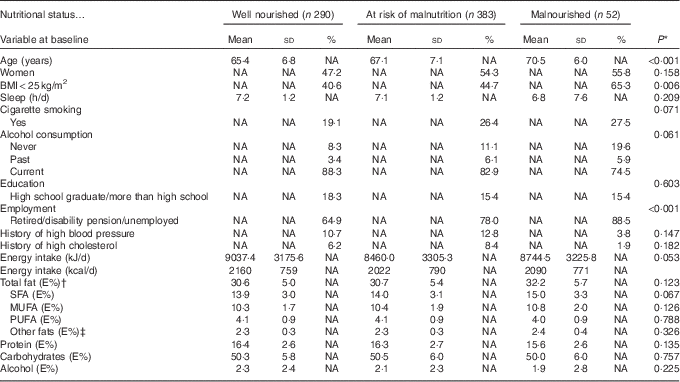
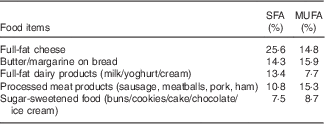
Table 1 presents the baseline characteristics of the participants for anthropometric measurements, lifestyle factors, total energy intake and the energy-yielding nutrients grouped according to the nutritional status at the follow-up. The malnourished participants had a previously higher intake of total fat (E%), SFA (E%) and MUFA (E%) compared with well-nourished participants, although these differences were NS (Table 1). In all participants, those who had a higher energy intake from total fat also had a higher proportion of SFA (P<0·001) and a lower proportion of PUFA (P<0·001) (data not shown). The main dietary sources of SFA (%) and MUFA (%) consumed by the 725 participants are displayed in Table 2.
Table 1 Baseline characteristics for anthropometric measurements, lifestyle factors, total energy intake and the energy-yielding nutrients in relation to nutritional status at follow-up (Mean values, standard deviations and percentages)
NA, not applicable; E%, energy percentage.
* ANOVA for continuous variables, Kruskal–Wallis test for discrete variables and χ 2 test for categorical variables.
† Total fat content normally comprises 90–95 % of the sum of the individual fatty acids. The remaining 5–10 % comprises essentially glycerol, but also phospholipids and sterols, and is classified as ‘other fats’ in the table.
‡ Glycerol, phospholipids and sterols.
Table 2 The main food items containing SFA (%) and MUFA (%) consumed by the 725 participants at the baseline according to FFQ
BMI at the baseline differed significantly between the three nutritional status groups: 23·7 kg/m2 in malnourished participants, 25·6 kg/m2 in participants at risk of malnutrition and 26·2 kg/m2 in well-nourished participants (P<0·001). The intake of E% fat differed between participants with a BMI<25 and BMI≥25 kg/m2 (data not shown). In participants with a BMI<25 kg/m2, mean energy intake (E%) of total fat was higher in malnourished participants (32·6 (SD 6·4) (P=0·044)) and in those at risk of malnutrition (32·0 (SD 5·2) (P=0·018)) compared with well-nourished participants (30·6 (SD 4·7)). In participants with a BMI<25 kg/m2, mean energy intake (E%) of SFA was higher in malnourished participants (15·4 (SD 3·8) (P<0·012)) and in those at risk of malnutrition (14·8 (SD 3·1) (P<0·009)) compared with well-nourished participants (13·8 (SD 3·0) (P<0·009)). In participants with a BMI≥25 kg/m2, E% from total fat or SFA did not differ significantly between nutritional status groups (data not shown).
Association between dietary fat intake and nutritional status
The results from the univariate and three separate multivariate multinomial logistic regression models are presented in Table 3. The results show the magnitude of the association between E% from total fat, SFA and MUFA at the baseline and nutritional status at follow-up.
Table 3 Risk of malnutrition or being malnourished compared with being well nourished from the multinomial logistic regression models analysed separately for total fat intake, SFA and MUFA (Odds ratios and 95 % confidence intervals)
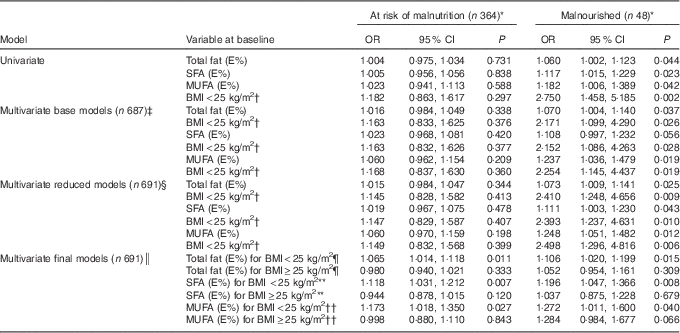
The table displays the confounder BMI<25 kg/m2 (reference BMI≥25 kg/m2) in all of the models (univariate, base, reduced and final), as it was used as an interaction term with total fat, SFA and MUFA in the final model. Energy percentage (E%) was used as a continuous variable; that is, the OR shows an increased or decreased risk of being at risk of malnutrition or being malnourished for each additional percentage point of energy from fat.
* The reference category is the well-nourished group (n 279).
† Reference category: BMI≥25 kg/m2.
‡ Controlled for total energy intake (kcal), protein (E%), sex, age, BMI, cigarette smoking, alcohol consumption, employment, high blood pressure and high cholesterol concentration.
§ Controlled for age, BMI, cigarette smoking and employment.
║ Controlled for age, BMI, cigarette smoking, employment and the interaction term between total fat, SFA, MUFA and BMI. The total effects given by adding the main and interaction effects are presented.
¶ P=0·010 for interaction between total fat and BMI<25 kg/m2 in individuals at risk of malnutrition, P=0·444 for interaction between total fat and BMI<25 kg/m2 in malnourished individuals.
** P=0·002 for interaction between SFA and BMI<25 kg/m2 in individuals at risk of malnutrition, P=0·192 for interaction between SFA and BMI<25 kg/m2 in malnourished individuals.
†† P=0·066 for interaction between MUFA and BMI<25 kg/m2 in individuals at risk of malnutrition, P=0·958 for interaction between MUFA and BMI<25 kg/m2 in malnourished individuals.
In the univariate logistic regression model, the risk of being malnourished increased significantly for each additional percentage point of energy intake from total fat (P=0·044), SFA (P=0·023) and MUFA (P=0·042) compared with the well-nourished participants, but there was no significant association for those at risk of malnutrition (P=0·588–0·838). After adjusting for confounding variables in the multivariate logistic regression analyses, the OR for being in the malnourished group increased from the base model to the reduced models for total fat and MUFA, but not for SFA.
In the final models, there were significant interaction effects between total fat, SFA and BMI. For participants with a BMI<25 kg/m2, the OR of being at risk of malnutrition or being malnourished increased for each additional percentage point of energy intake of the following types of fats: by 6·5 and 10·6 %, respectively, for total fat; by 11·8 and 19·6 %, respectively, for SFA; and by 17·3 and 27·2 %, respectively, for MUFA (Table 3). However, for participants with a BMI≥25 kg/m2, there were no significant associations between risk of malnutrition and the intakes of total fat, SFA or MUFA. These results are illustrated in Fig. 2, which gives the estimated probability (%) of being malnourished or at risk of malnutrition compared with being well nourished according to (a) E% total fat, (b) E% SFA and (c) E% MUFA separately for individuals with BMI<25 and ≥25 kg/m2. The results are given for a typical participant in the study – that is, an individual of the median age of 67 years who is a non-smoker (77 % of participants) and retired, on a disability pension or unemployed (73 % of participants).
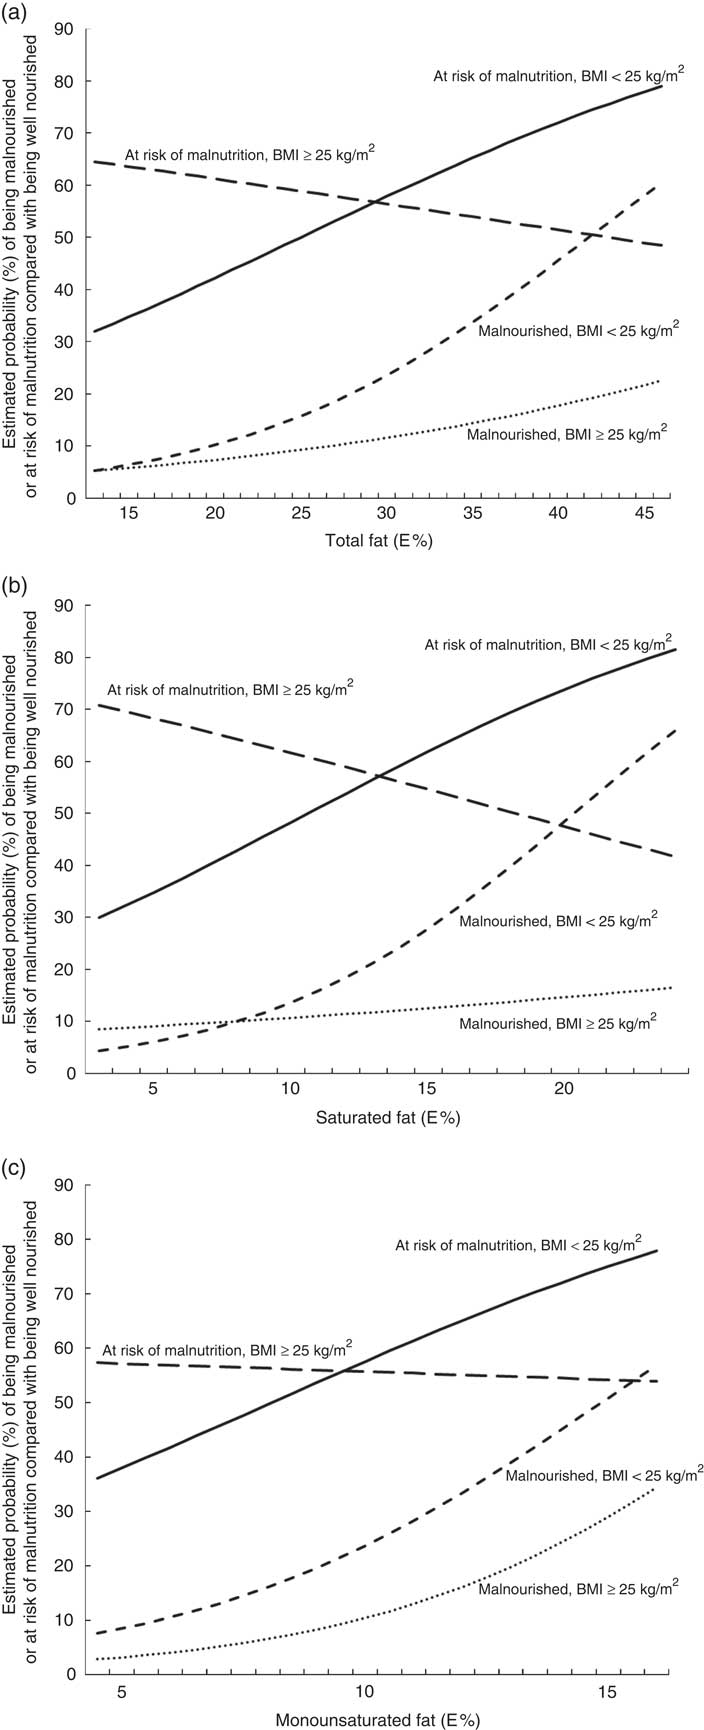
Fig. 2. Estimated probability (%) of being malnourished or at risk of malnutrition compared with being well nourished according to (a) energy percentage (E%) total fat, (b) E% saturated fat and (c) E% monounsaturated fat. The estimated probabilities were calculated from the final multivariate multinomial logistic regression models for individuals who in 1997 were 67 years old, non-smokers, retired, on a disability pension or unemployed, analysed separately for individuals with a BMI<25 kg/m2 and a BMI≥25 kg/m2.
Discussion
Contrary to what was expected, a high energy intake from dietary fat among middle-aged and older adults was associated with an increased risk of exhibiting malnutrition 10 years later. However, this applied only to individuals with a BMI<25 kg/m2 at the baseline. The OR for being at risk of malnutrition or being malnourished increased for each additional percentage point of energy intake from total fat (by 6·5 and 10·6 %, respectively), saturated fat (by 11·8 and 19·6 %, respectively) and monounsaturated fat (by 17·3 and 27·2 %, respectively).
Strengths and limitations
This is the first study to examine the association between previous dietary fat intake during middle and old age and nutritional status in later life. The prospective study design allowed us to control for important participant characteristics recorded at the baseline.
One limitation is that diet was self-reported and was measured only at the baseline, which will inevitably lead to some error in the measurement of dietary fat intake and attenuated risk estimates, as well as making it impossible to monitor whether there is a change in dietary fat intake in the years before the nutritional screening of the participants.
In the validation studies of the FFQ, the correlation coefficients for fat intake were moderately strong in men( Reference Messerer, Johansson and Wolk 16 ). Another limitation is that only follow-up data regarding nutritional status were available. However, participants who were malnourished at the follow-up had a lower mean BMI at the baseline (23·7 kg/m2) compared with those at risk of malnutrition (25·6 kg/m2) and well-nourished participants (26·2 kg/m2), suggesting that the nutritional status may have been similar 10 years earlier. Another limitation was that nutritional status was assessed only for individuals admitted to hospital, which limits the generalisability of the results to other middle-aged and older adults. However, most of the participants were living at home (95·9 %) before their admission to hospital, as only 4·1 % were living in a nursing home. This indicates that the study population might be healthier than the average population of older adults admitted to hospital, and have more similarities with the general public.
In addition, the study population in the present study included a selection of survivors because, obviously, only those who had survived until the start of the VNAS could participate. Individuals with a high intake of dietary fat might have had a higher risk of dying( Reference Jakobsen, O’Reilly and Heitmann 22 ), meaning that only survivors were selected in the study cohort. Consequently, there is a risk that a high energy intake from fat as a risk factor for future malnutrition might be underestimated in the present study. Finally, because of the observational study design, there is a possibility of residual confounding because other unmeasured or imprecisely measured risk factors for malnutrition, such as the presence of other diseases, may have affected the results. However, the present study population comprised healthy adults at the baseline, and for that reason the prevalence of self-reported diseases was low. Physical activity might be an important confounder related to both malnutrition and fat intake. Level of physical activity was analysed in relation to nutritional status (data not shown). However, there were no statistically significant differences in physical activity among the nutritional status groups, and the variables were therefore not included in further analysis.
Meaning of the study: possible explanations of the results
Interpreting the association between a high fat content in the diet and malnutrition is complex because similar studies have not been reported. One likely explanation to the association is that malnourished individuals might have had a lower total energy intake (kJ (kcal)) at baseline. Total energy was, however, adjusted for in the regression analyses, but it was found to be non-significant and thus excluded from the reduced model. This indicates that total energy intake had no significant impact on the outcome, suggesting that the E% of dietary fat may be the most important factor for predicting malnutrition.
A high energy intake from total fat could be a marker of poor nutrition, as energy density, nutrient composition and palatability of food are rarely separated in real life( Reference Drewnowski 8 ). High energy diets usually contain foodstuffs with a high level of fat and sugar, such as snacks, fast food and dessert( Reference Drewnowski and Specter 23 , Reference Marti-Henneberg, Capdevila and Arija 24 ). Therefore, individuals who consume more energy-dense food might lack other essential nutrients in the diet, which may lead to future malnutrition. The results from the present study partly support this theory because participants with a higher energy intake from total fat also had a higher proportion of SFA and a lower proportion of PUFA.
According to the dietary recommendations for adults( 10 ), the diet should include a high intake of food containing unsaturated fats such as vegetable oils (olive or rapeseed oils), soft margarines made from olive or rapeseed oils, nuts, chicken and avocados. However, in the present study, the main sources of MUFA originated from food items that also contained a high level of SFA (e.g. full-fat cheese, butter/margarine on bread) (Table 2). Because the main sources of SFA and MUFA originated from the same food items (Table 2), we cannot exclude the possibility that these dietary components acted as confounding factors. Another explanation for why individuals with a high intake of MUFA were at an increased risk of malnutrition might involve trans fatty acids included in the MUFA( Reference Jakobsen, O’Reilly and Heitmann 22 ) because trans fatty acids exhibit the same properties as SFA.
The effect of a high energy intake from fat as a risk factor for malnutrition was no longer significant for participants with a BMI≥25 kg/m2 – that is, when the interaction term of BMI was added to the final regression models. One possible explanation is that participants with a BMI<25 kg/m2 had a higher E% of total fat and SFA compared with those with a BMI≥25 kg/m2. Alternatively, a high BMI might have such a strong protective effect against malnutrition that a high E% intake from fat is not a risk factor for malnutrition in people with a BMI≥25 kg/m2.
Clinical implications
To establish specific recommendations about energy intake from fat, both for older adults in general and for adults either at risk of or already experiencing malnutrition, the hypothesis that a previous high energy intake from dietary fat can prevent malnutrition in later life should be tested in an experimental study. The results of the present study suggest that a high energy intake from fat might have the opposite effect. These findings suggest that dietary recommendations for middle-aged and older adults should focus on reducing the intake of total fat in the diet by limiting food items containing SFA and MUFA.
Conclusion
Contrary to our expectations, a high energy intake from total fat, SFA and MUFA among middle-aged and older adults increased the risk of developing malnutrition 10 years later. However, this only applied to individuals with a BMI<25 kg/m2 at the baseline. These findings suggest that preventive actions to counteract malnutrition in older adults should focus on limiting the intake of total fat in the diet by reducing consumption of food with a high content of saturated and monounsaturated fat, such as full-fat dairy foods, solid fats, processed meat and sugar-sweetened foods.
Acknowledgements
The SMC/COSM was financed by research grants from the Swedish Research Council/Longitudinal Studies (grant number E0639401). The VNAS was financed with grants from the Swedish National Board of Health and Welfare (grant number 11132/2011) and the County Council of Västmanland (grant number LTV-379571). The sponsors had no involvement in the study design, the collection, analysis or interpretation of data, the writing of the manuscript or the decision to submit the manuscript for publication.
The authors’ contributions are as follows: L. S., A. R., E. T. A. and L. B. conceived and designed the present study. A. W. and N. H. were involved in the data collection of the SMC and COSM. L. S. was involved in the data collection of the VNAS. L. S., A. R. and N. H. performed the statistical analyses. L. S., A. R., E. T. A., A. W., N. H. and L. B. interpreted the data. L. S., A. R., E. T. A., A. W., N. H. and L. B. drafted the manuscript. All authors approved the final manuscript and the decision to submit it for publication.
None of the authors has any conflicts of interest to declare.


