Interest in social phobia has grown substantially over the past few years, in parallel with growing awareness of its high prevalence and ability to respond to treatment (Reference Kessler, McConagle and ZhaoKessler et al, 1994; Reference Stein, Chartier and HazenStein et al, 1996). Sub-sequently, several self-rated and interview-based scales have been developed to assess the symptoms and severity of social anxiety (Reference Watson and FriendWatson & Friend, 1969; Reference Marks and MathewsMarks & Mathews, 1979; Reference Liebowitz and KleinLiebowitz, 1987; Reference Turner, Beidel and DancuTurner et al, 1989; Reference Mattick and ClarkeMattick & Clarke, 1992; Reference Davidson, Miner and DeVeaugh-GeissDavidson et al, 1997). These instruments have been reviewed in a recent report by Clark et al (Reference Clark, Feske and Masia1997).
In contrast to several interview-based scales, none of the self-rating scales reports on the full spectrum of fear, avoidance, and physiological components of social phobia, all of which are clinically important. Recognising these limitations, we sought to develop an abbreviated rating scale which assessed the full spectrum of symptoms which characterise social phobia.
Development of the SPIN
A number of rating scales have been developed to evaluate aspects of social phobia, but their utility has been limited by several factors. For example, most of these instruments focus on one or other selected aspects of the picture, such as phobic avoidance (Reference Marks and MathewsMarks & Mathews, 1979), or fearful cognitions (Reference Watson and FriendWatson & Friend, 1969). Although not as frequently evaluated by these measures, physiological symptoms were cited by Van Vliet et al (Reference Van Vliet, den Boer and Westenberg1994) as being the most distressing aspects of social phobia in their series. Other instruments are somewhat lengthy, albeit wide-ranging in scope (Reference Turner, Beidel and DancuTurner et al, 1989).
Recognising these limitations, we undertook the development of a self-rated scale, based on the interviewer-administered Brief Social Phobia Scale (BSPS; Reference Davidson, Miner and DeVeaugh-GeissDavidson et al, 1997), with the following goals in mind: (a) to distinguish between subjects with a diagnosis of social phobia and those without; (b) to serve as a valid measure of the severity of social phobia symptoms; (c) to be sensitive to reduction in symptoms over time; (d) to identify threshold scores which might best distinguish between those with, and those without, the diagnosis, such that the scale could thereby serve as a useful screening instrument; and (e) to be able to distinguish between the effects of different treatments, where other measures were able to establish that such differences did, indeed, exist.
Modelled on the BSPS, the Social Phobia Inventory (SPIN) consists of questions which evaluate fear (of people in authority, of parties and social events, of being criticised, of talking to strangers, of doing things when people are watching, and of being embarrassed), avoidance (of talking to strangers, of speaking to people for fear of embarrassment, of going to parties, of being the centre of attention, of making speeches, of being criticised, of speaking to authority), and physiological discomfort (blushing, sweating, palpitations, or shaking and trembling in front of other people). Each of the 17 items is rated on a scale from 0 to 4: not at all, a little bit, somewhat, very much, and extremely; with higher scores corresponding to greater distress. The full-scale score thus ranges from 0 to 68. This report describes the psychometric properties of the SPIN, including test-retest reliability, internal consistency, convergent validity, divergent validity, construct validity, predictive validity, distribution of scale scores, and factorial composition.
METHOD
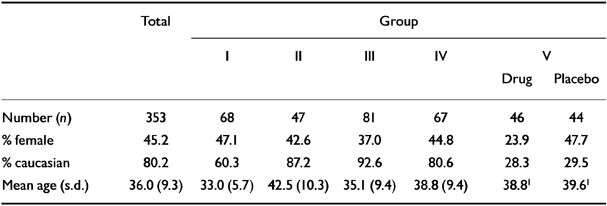
A sample of 353 subjects was obtained from five groups, two of which were controls (healthy volunteers and psychiatric patients without social phobia (groups I and II)) and three of which comprised social phobia clinical trial subjects (groups III, IV, and V). Characteristics of the full sample are shown in Table 1. Group 1 comprised 68 healthy volunteers in a study of blood pressure (Reference Watkins, Grossman, Krishnan and SherwoodWatkins et al, 1998; Reference Carles, Blumentahl and SherwoodCarles et al, 1998); group II comprised 47 psychiatric out-patients in clinical practice with diagnoses other than social phobia (details available from the second author upon request); group III comprised 81 subjects in a completed double-blind, placebo-controlled trial of gabapentin in social phobia (Reference Pande, Davidson and JeffersonPande et al, 1999); group IV comprised 67 subjects in an ongoing placebo-controlled treatment study of fluoxetine v. behavioural therapy (for which efficacy comparisons are not available); and group V comprised 90 outpatients in a double-blind, placebo-controlled study of fluvoxamine in social phobia (Reference Stein, Fyer and DavidsonStein et al, 1999). In the social phobia clinical trial samples, the SPIN was used as a measure of the effect of treatment, while the scale was also undergoing further validation. Note that in group V, only summary data by treatment were available for this study, and therefore it was not possible to integrate information from this group into this report as fully as we were able to do with the other samples, and these data are used primarily for predictive validity.
Table 1 Characteristics of the sample
| Total | Group | ||||||
|---|---|---|---|---|---|---|---|
| I | II | III | IV | V | |||
| Drug | Placebo | ||||||
| Number (n) | 353 | 68 | 47 | 81 | 67 | 46 | 44 |
| % female | 45.2 | 47.1 | 42.6 | 37.0 | 44.8 | 23.9 | 47.7 |
| % caucasian | 80.2 | 60.3 | 87.2 | 92.6 | 80.6 | 28.3 | 29.5 |
| Mean age (s.d.) | 36.0 (9.3) | 33.0 (5.7) | 42.5 (10.3) | 35.1 (9.4) | 38.8 (9.4) | 38.81 | 39.61 |
The protocols used to define the groups were not identical. As a result, different subsamples were examined, as described later, to evaluate the psychometric properties of the SPIN, as appropriate.
Validation of the SPIN was determined relative to a number of standard instruments, including the Liebowitz Social Anxiety Scale (LSAS) (Reference Liebowitz and KleinLiebowitz, 1987), the Brief Social Phobia Scale (BSPS) (Reference Davidson, Miner and DeVeaugh-GeissDavidson et al, 1997), the Marks Fear Questionnaire (FQ) (Reference Marks and MathewsMarks & Mathews, 1979), the Sheehan Disability Scale (SDS) (Reference SheehanSheehan, 1983), the Medical Outcomes Study Short Form-36 (SF-36) (Reference Ware and SherbourneWare & Sherbourne, 1992) and the Clinical Global Impressions of Severity (CGI-S) and Improvement (CGI-I) Scales (Reference GuyGuy, 1976).
Reliability and validity procedures
The reliability and internal consistency of the SPIN were evaluated as follows. We identified subjects in the three clinical trial samples whose CGI rating scores showed no change between two consecutive visits (e.g. over two weeks). Test—retest reliability was evaluated in these subgroups using Spearman correlations, as well as the procedures of Bland & Altman (Reference Bland and Altman1986). Internal consistency was assessed using Cronbach's α for the total score and the three sub-scales in groups I-IV, with an additional calculation being performed on the end-point scores in group IV to take advantage of the broader spread of scores.
Convergent validity was assessed by a comparison of the total and subscale SPIN scores with the corresponding scores on the LSAS, the FQ social phobia sub-scale, and the BSPS, using Pearson correlations. Divergent validity was evaluated relative to: (a) health status outcome using the SF-36; (b) blood-injury phobia on the FQ; and (c) disability on the SDS.
Construct validity for the SPIN was evaluated as follows. Total SPIN scores were compared in those with and without a diagnosis of social phobia by means of the Mann—Whitney t-test. Spearman correlations were used to compare the total SPIN score for subjects with different levels of severity of social phobia, as judged by the CGI severity at the last study visit, which would allow for the greatest spread of severity. The percentage reduction in SPIN score was compared with a clinician's assessment of overall improvement, using a Spearman correlation coefficient. A threshold analysis was conducted, using test threshold values (sensitivity, specificity, positive predictive value, negative predictive value, and efficiency (i.e. (sensitivity+specificity)/sample size), which is considered a measure of diagnostic accuracy) and receiver operating characteristics (ROC), thereby allowing us to develop the best threshold for patients with and without social phobia and to compare psychiatric social phobia patients with non-social phobia controls.
Sensitivity to the effects of treatment was evaluated in two groups (III and IV) using general linear models (GLM) analysis of variance (ANOVA) with treatment (drug v. placebo) as a grouping variable and time (baseline and end-point) as a repeated measure. In group III, it was possible for us to conduct an analysis of covariance (ANCOVA) also. Effect sizes of the SPIN and other scales relative to the active treatment v. placebo difference were evaluated according to the method of Cohen (Reference CohenCohen, 1988). Frequencies of the individual scale items and the distribution of scale scores were evaluated in terms of the extent to which the full range of the scale was actually made use of in the study population. An exploratory factor analysis was used to evaluate factorial validity.
All analyses were performed by the study biostatistician (L.E.C.) using SAS computer software.
RESULTS
Test—retest reliability
Test—retest reliability was assessed in groups III and IV. In group III, 64 subjects were available who exhibited no change, or minimal change, on the CGI-I at two consecutive visits. The Spearman correlation coefficient in this group was 0.89 (P<0.0001). In group IV, 54 subjects were found to show minimal change on the BSPS between screen and baseline. Using this population, the correlation coefficient was 0.78 (P≤0.0001).
We plotted the two reliability time points using the method of Altman and Bland (Reference Bland and AltmanBland & Altman, 1986). All but two points fell within two standard deviations in one series, and in the other series all but three points fell within two standard deviations. These results indicate adequate test—retest reliability.
Internal consistency
Evaluation of internal consistency according to Cronbach's α was performed for groups I-IV. For the total baseline SPIN score, the coefficient for social phobia subjects (groups III and IV) ranged from 0.87 to 0.94 compared with 0.82-0.90 for controls (groups I and II). Coefficients for baseline subscale scores for social phobia subjects v. controls were as follows: fear, 0.68-0.76 v. 0.76-0.79; avoidance, 0.71 v. 0.70-0.81; and physiological, 0.70-0.73 v. 0.57-0.68. In group II at end-point, Cronbach's α coefficients were 0.94 for the full scale, and 0.89, 0.91, and 0.8 for the fear, avoidance, and physiological subscales, respectively.
Convergent validity
The SPIN total and sub-scale scores were compared with the BSPS ratings in group IV. In comparing the full-scale scores, a highly significant correlation coefficient was obtained (r=0.57, P<0.0001) (n=67 at baseline). Correlation coefficients for the sub-scale items of the SPIN relative to the BSPS were also highly significant, as follows: fear subscale, r=0.61 (P<0.0001); avoidance subscale, r=0.47 (P<0.001); and physiological subscale, r=0.66 (P<0.0001). Correlation against the LSAS was 0.55 (P<0.0001).
In group III, correlation coefficients were obtained for the SPIN total at baseline relative to the BSPS baseline total (r=0.80, P<0.0001). The fear, avoidance, and physiological sub-scale correlations were significant (r=0.82, P<0.0001; r=0.62, P<0.0001; r=0.62, P<0.001), relative to the corresponding BSPS sub-scales. At end-point, correlation coefficients between SPIN and BSPS totals and between SPIN and LSAS totals were r=0.92 (P<0.0001) and r=0.87 (P<0.0001), respectively.
Relative to the social phobia sub-scale of the FQ at baseline in group III, significant correlations were found for the SPIN total, as well as for the fear, avoidance, and physiological subscale scores (r=0.77, P<0.0001; r=0.76, P<0.0001; r=0.78, P<0.0001; r=0.42, P<0.0001).
Divergent validity
No significant correlation with the general health score of the SF-36 was found in group III (r=0.01). Relative to blood-injury phobia assessed on the FQ, the correlation was r=0.34 (P<0.002) which, although significant, was lower than the correlations noted with other social phobia measures. Relative to disability as measured by the SDS, the correlation was r=0.33 (P<0.03).
Construct validity
Total SPIN scores for subjects with social phobia (groups III, IV; n=148) were compared with scores for non-psychiatric controls (group I; n=68). At baseline, subjects with social phobia had mean (s.d.) total SPIN scores of 41.1 (10.2) compared with 12.1 (9.3) in controls (t=3.22; P<0.001).
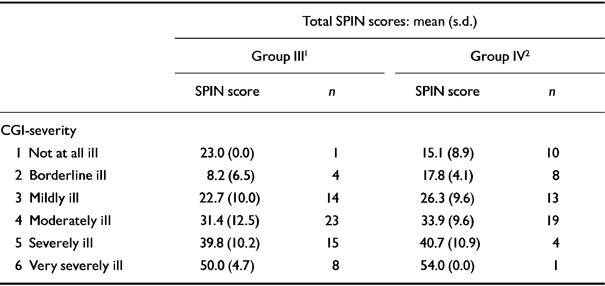
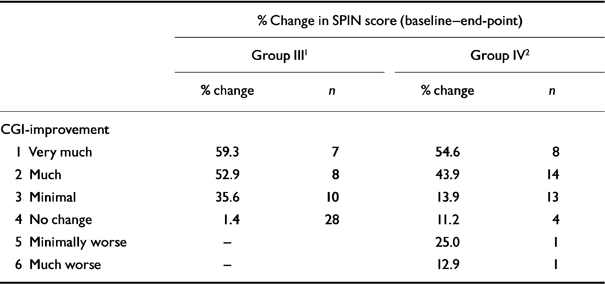
Construct validity was also demonstrated by establishing that different levels of severity of social phobia would be reflected by different levels in the SPIN score. Table 2 reports the end-point scores in groups III and IV between SPIN total and the interview-based CGI-S, which demonstrated significant similarities. The degree to which levels of interviewer-rated global improvement (CGI-I) were matched by percentage change in SPIN score also showed significant associations, and these results are presented in Table 3.
Table 2 Construct validity of the SPIN: different severity levels by global ratings at end-point
| Total SPIN scores: mean (s.d.) | ||||
|---|---|---|---|---|
| Group III1 | Group IV2 | |||
| SPIN score | n | SPIN score | n | |
| CGI-severity | ||||
| 1 Not at all ill | 23.0 (0.0) | 1 | 15.1 (8.9) | 10 |
| 2 Borderline ill | 8.2 (6.5) | 4 | 17.8 (4.1) | 8 |
| 3 Mildly ill | 22.7 (10.0) | 14 | 26.3 (9.6) | 13 |
| 4 Moderately ill | 31.4 (12.5) | 23 | 33.9 (9.6) | 19 |
| 5 Severely ill | 39.8 (10.2) | 15 | 40.7 (10.9) | 4 |
| 6 Very severely ill | 50.0 (4.7) | 8 | 54.0 (0.0) | 1 |
Table 3 Relation between global improvement and percentage change on the SPIN (baseline—end-point)
| % Change in SPIN score (baseline-end-point) | ||||
|---|---|---|---|---|
| Group III1 | Group IV2 | |||
| % change | n | % change | n | |
| CGI-improvement | ||||
| 1 Very much | 59.3 | 7 | 54.6 | 8 |
| 2 Much | 52.9 | 8 | 43.9 | 14 |
| 3 Minimal | 35.6 | 10 | 13.9 | 13 |
| 4 No change | 1.4 | 28 | 11.2 | 4 |
| 5 Minimally worse | - | 25.0 | 1 | |
| 6 Much worse | - | 12.9 | 1 | |
In establishing the diagnostic threshold for the scale, efficiency, sensitivity, specificity, and predictive value were calculated for the following groups: social phobia groups III, and IV v. control groups I and II; social phobia groups v. non-psychiatric controls (I); and social phobia groups v. non-social phobia psychiatric controls (II) (Table 4). A cut-off value of 19 distinguished between subjects with and without social phobia, and good efficiency was demonstrated, with a diagnostic accuracy of 79%. Slightly lower scores distinguished between subjects with social phobia and non-psychiatric or non-social phobic psychiatric controls, with cut-offs of 15 (78% efficiency) and 16 (80% efficiency), respectively. Receiver operating characteristic curves comparing social phobia subjects (groups III and IV) with non-psychiatric controls (group I), non-social phobic psychiatric controls (group II), and all non-social phobic controls (groups I and II) are presented in Figs 1, 2, and 3. Calculations for the corresponding area under the curve (AUC) were 0.832, 0.865, and 0.845, respectively.
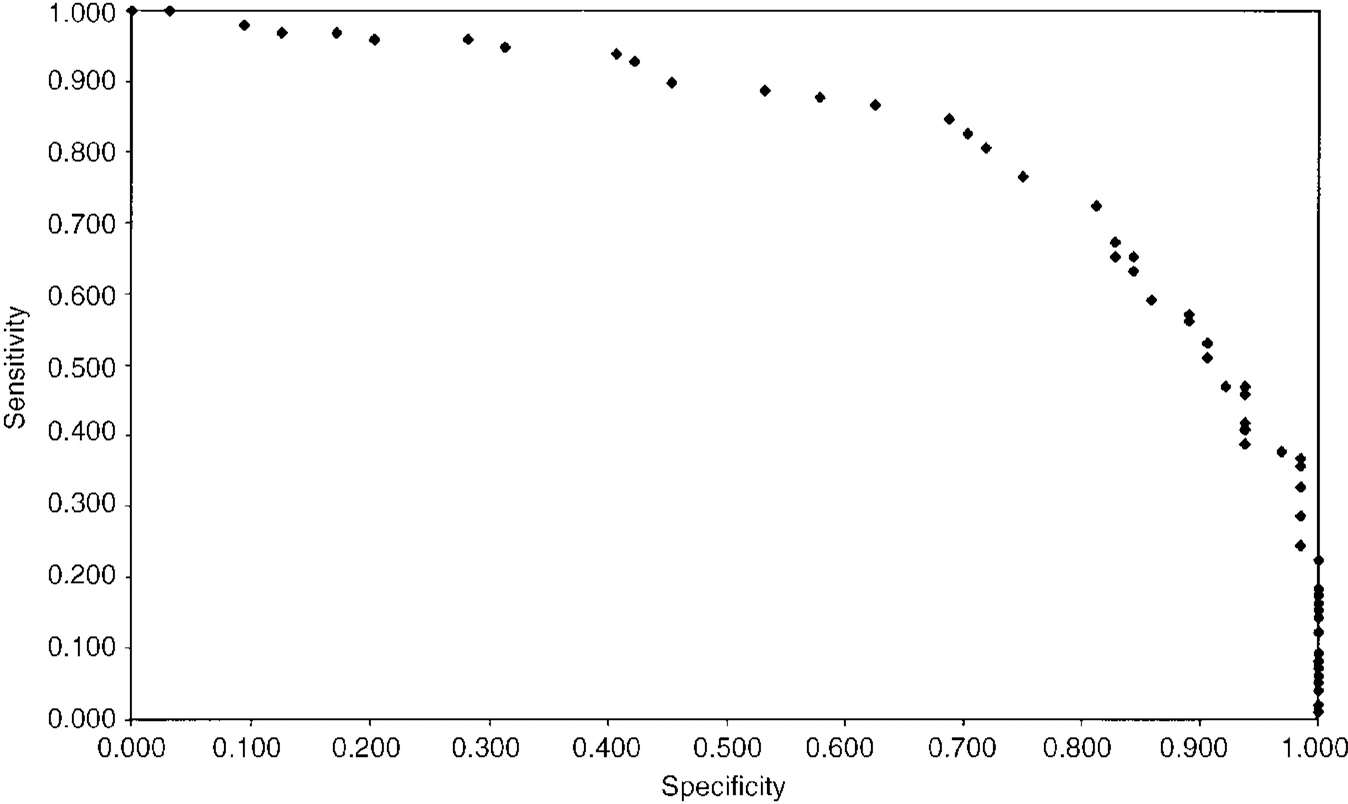
Fig. 1 Subjects with social phobia (groups III, IV) compared with non-psychiatric controls (group I): receiver operating characteristic (ROC) curve. Area under the curve (AUC)=0.832.
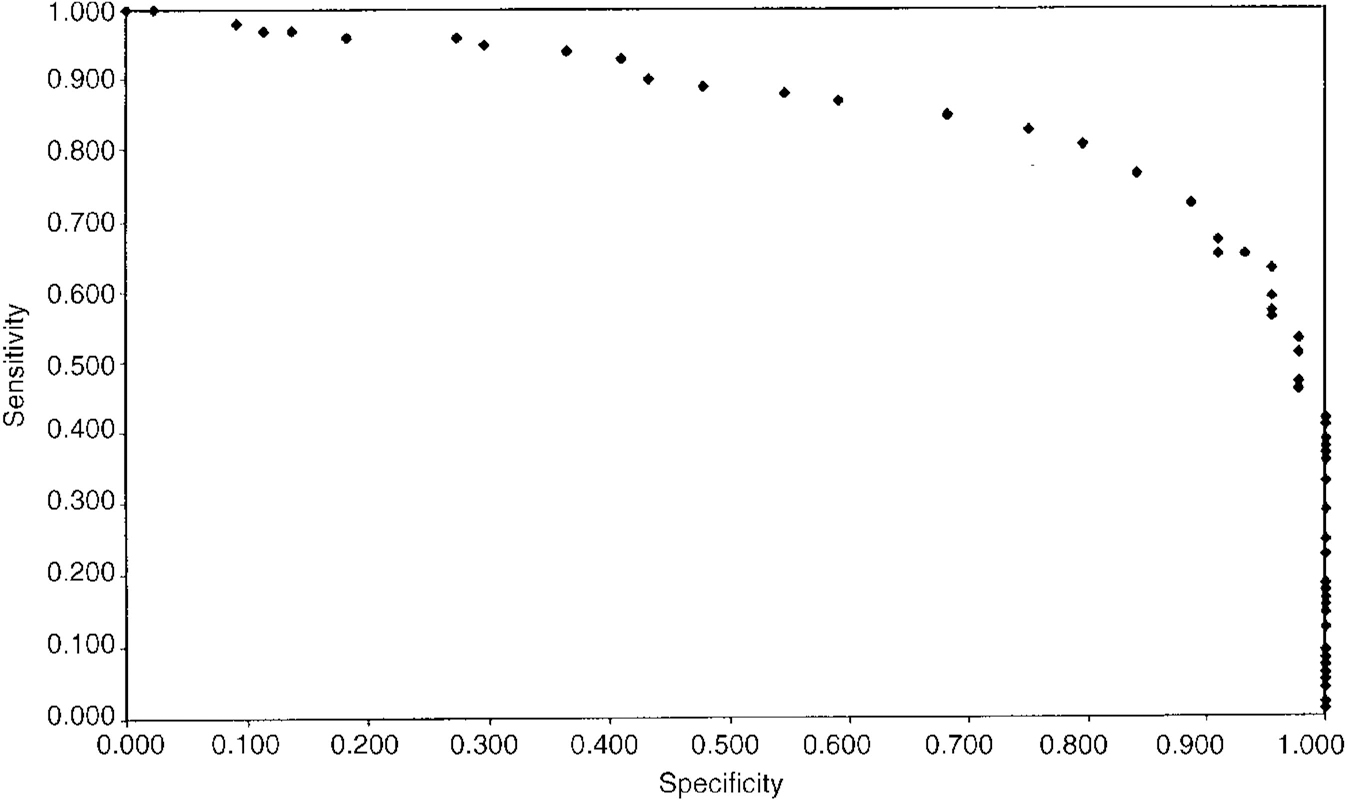
Fig. 2 Subjects with social phobia (groups III, IV) compared with non-social phobic psychiatric controls (group II): ROC curve. AUC=0.865.
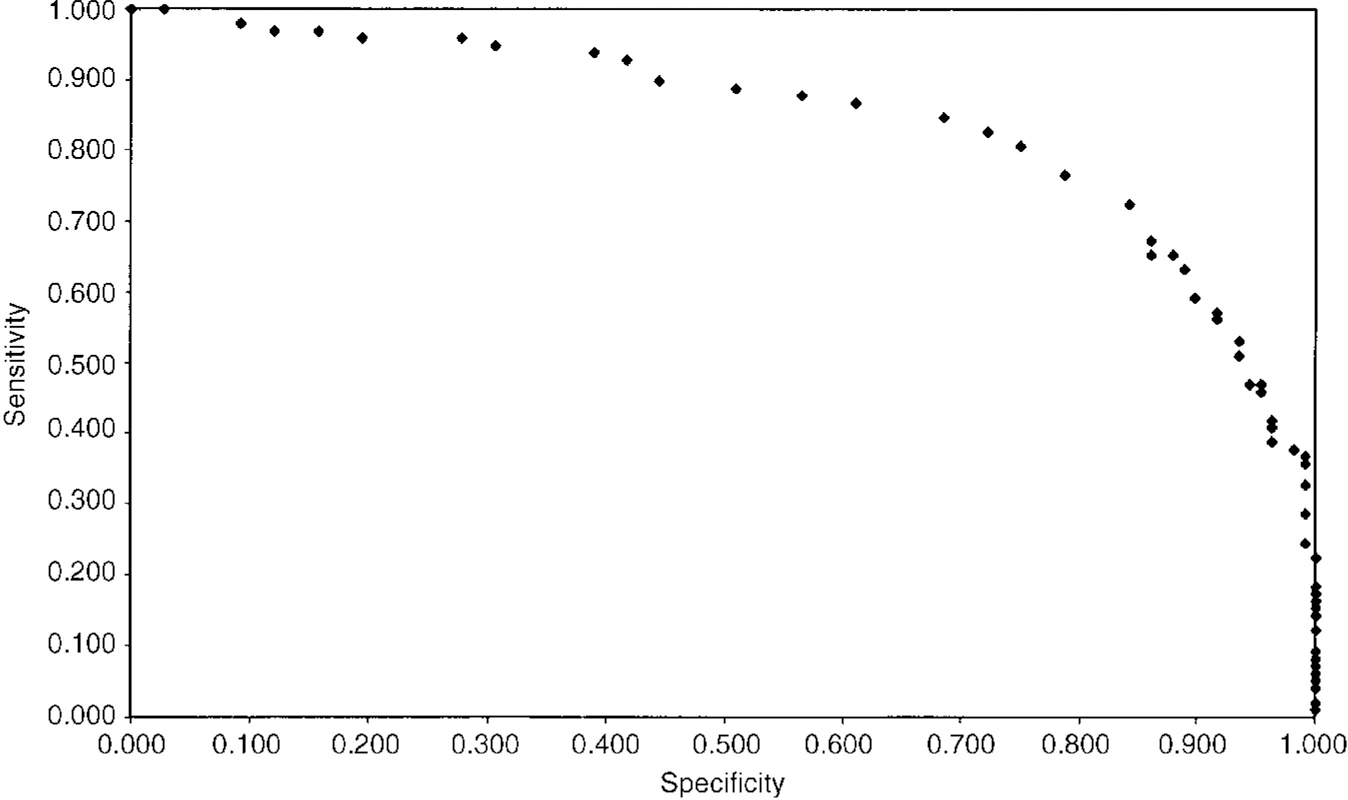
Fig. 3 Subjects with social phobia (groups III, IV) compared with non-psychiatric and non-social phobic psychiatric controls (groups I, II): ROC curve. AUC=0.845.
Table 4 Sensitivity, specificity, predictive value and efficiency of the SPIN

| SPIN score cut-off point | Sensitivity | Specificity | Predictive value | Efficiency | AUC | ||
|---|---|---|---|---|---|---|---|
| Positive | Negative | ||||||
| SP groups (III+IV) v. controls (I+II) | 19 | 0.725 | 0.843 | 0.807 | 0.771 | 0.786 | 0.845 |
| SP groups (III+IV) v. non-psychiatric controls (I) | 15 | 0.847 | 0.688 | 0.806 | 0.746 | 0.784 | 0.832 |
| SP groups (III+IV) v. non-SP psychiatric controls (II) | 16 | 0.827 | 0.750 | 0.880 | 0.660 | 0.803 | 0.865 |
Sensitivity to treatment effects
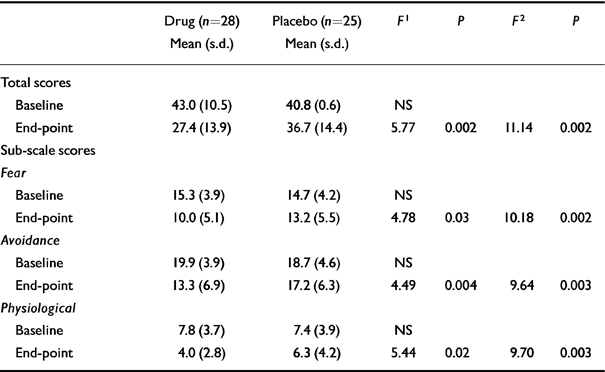
In group III, GLM repeated-measures ANOVA revealed significant effects on the SPIN score for time and for the time-by-treatment interaction. The same was true with each of the three sub-scale measures. Although no differences were observed between the treatment groups at baseline, significant differences were demonstrated between the drug and placebo groups at end-point, using both the full-scale and sub-scale SPIN scores. SPIN scores at base-line and end-point of treatment are presented in Table 5. The ANCOVA model, which adjusts for baseline differences between treatment groups, revealed significant differences at baseline and at end-point on the total SPIN and each of the sub-scale measures.
Table 5 Sensitivity to treatment effects: difference between treatments in group III at baseline and at end-point
| Drug (n = 28) Mean (s.d.) | Placebo (n = 25) Mean (s.d.) | F 1 | P | F 2 | P | |
|---|---|---|---|---|---|---|
| Total scores | ||||||
| Baseline | 43.0 (10.5) | 40.8 (0.6) | NS | |||
| End-point | 27.4 (13.9) | 36.7 (14.4) | 5.77 | 0.002 | 11.14 | 0.002 |
| Sub-scale scores | ||||||
| Fear | ||||||
| Baseline | 15.3 (3.9) | 14.7 (4.2) | NS | |||
| End-point | 10.0 (5.1) | 13.2 (5.5) | 4.78 | 0.03 | 10.18 | 0.002 |
| Avoidance | ||||||
| Baseline | 19.9 (3.9) | 18.7 (4.6) | NS | |||
| End-point | 13.3 (6.9) | 17.2 (6.3) | 4.49 | 0.004 | 9.64 | 0.003 |
| Physiological | ||||||
| Baseline | 7.8 (3.7) | 7.4 (3.9) | NS | |||
| End-point | 4.0 (2.8) | 6.3 (4.2) | 5.44 | 0.02 | 9.70 | 0.003 |
Treatment differences assessed in group V demonstrated that the effects of active treatment (n=46) differed from those of placebo (n=44), whereby mean (s.d.) final SPIN scores in the drug group were 27.3 (14.6) v. 34.0 (16.0) in the placebo group (P=0.01). Significant effects were also observed in the fear subscale (8.8 (5.1) v. 11.8 (6.1), P=0.02) and the avoidance subscale (12.9 (6.2) v. 16.2 (6.8), P=0.01), but not in the physiological subscale (5.4 (4.1) v. 5.9 (4.3), P=0.14).
For a further comparison of our scale with other scales, we calculated effect size measurements, from (mean SPIN score in drug group—mean SPIN score in placebo group)/common s.d., relative to the detection of differences between drug and placebo at end-point in group III. Effect size values for the observer-based BSPS, LSAS, and CGI-S and the patient-rated SPIN and global improvement scale (PGI) were as follows: 0.68, 0.42, 0.67, 0.66, and 0.69. Somewhat smaller effect sizes were observed in group V on the BSPS (effect size=0.51), CGI-S (effect size=0.40), SPIN (effect size=0.44), and PGI (effect size=0.44).
Item frequencies
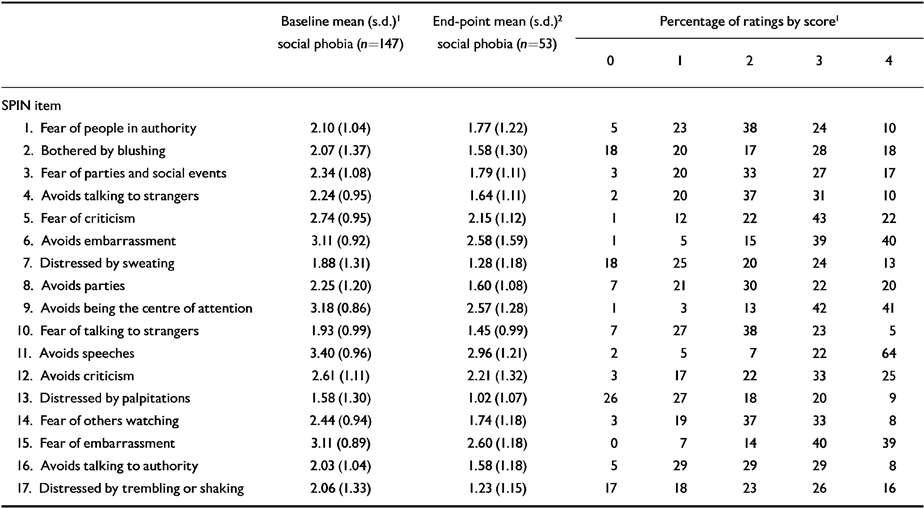
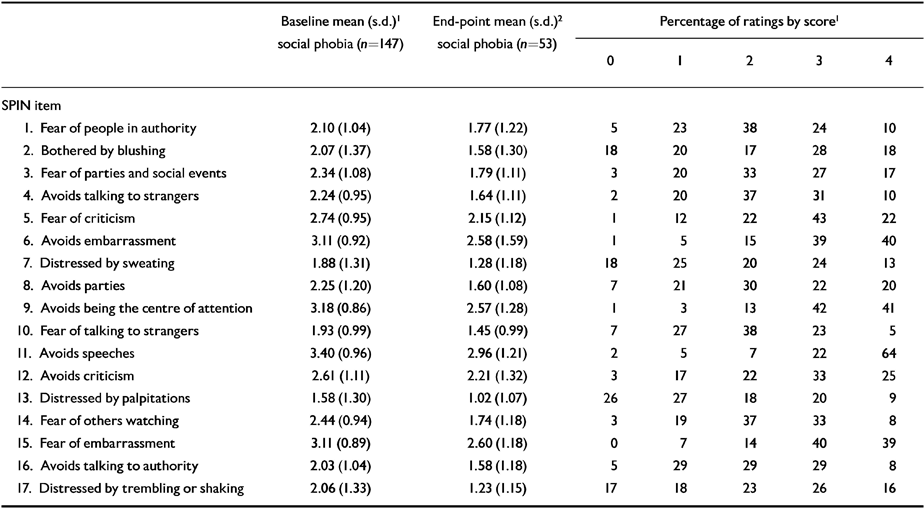
Frequency percentages for ratings of each SPIN item are presented in Table 6 for groups III and IV. Items which were not endorsed at all were most commonly items 2 (bothered by blushing), 7 (seating), 13 (palpitations), and 17 (trembling and shaking). Nevertheless, even the least commonly endorsed symptom (palpitations) was reported in 72% of subjects. Among the controls in group I, 11 symptoms were not endorsed at all by more than 50% of the group, and only one symptom (“being criticised scares me a lot”) was endorsed by more than 70% of subjects. In the non-social phobic patient control group (II), 10 items were endorsed with a rating of 4, suggesting that subjects are indeed willing to make use of the extreme anchor points on the scale.
Table 6 Mean item scores at baseline and end-point and distribution of baseline item scores from 0-4
| Baseline mean (s.d.)1 social phobia (n = 147) | End-point mean (s.d.)2 social phobia (n = 53) | Percentage of ratings by score1 | |||||
|---|---|---|---|---|---|---|---|
| 0 | 1 | 2 | 3 | 4 | |||
| SPIN item | |||||||
| 1. Fear of people in authority | 2.10 (1.04) | 1.77 (1.22) | 5 | 23 | 38 | 24 | 10 |
| 2. Bothered by blushing | 2.07 (1.37) | 1.58 (1.30) | 18 | 20 | 17 | 28 | 18 |
| 3. Fear of parties and social events | 2.34 (1.08) | 1.79 (1.11) | 3 | 20 | 33 | 27 | 17 |
| 4. Avoids talking to strangers | 2.24 (0.95) | 1.64 (1.11) | 2 | 20 | 37 | 31 | 10 |
| 5. Fear of criticism | 2.74 (0.95) | 2.15 (1.12) | 1 | 12 | 22 | 43 | 22 |
| 6. Avoids embarrassment | 3.11 (0.92) | 2.58 (1.59) | 1 | 5 | 15 | 39 | 40 |
| 7. Distressed by sweating | 1.88 (1.31) | 1.28 (1.18) | 18 | 25 | 20 | 24 | 13 |
| 8. Avoids parties | 2.25 (1.20) | 1.60 (1.08) | 7 | 21 | 30 | 22 | 20 |
| 9. Avoids being the centre of attention | 3.18 (0.86) | 2.57 (1.28) | 1 | 3 | 13 | 42 | 41 |
| 10. Fear of talking to strangers | 1.93 (0.99) | 1.45 (0.99) | 7 | 27 | 38 | 23 | 5 |
| 11. Avoids speeches | 3.40 (0.96) | 2.96 (1.21) | 2 | 5 | 7 | 22 | 64 |
| 12. Avoids criticism | 2.61 (1.11) | 2.21 (1.32) | 3 | 17 | 22 | 33 | 25 |
| 13. Distressed by palpitations | 1.58 (1.30) | 1.02 (1.07) | 26 | 27 | 18 | 20 | 9 |
| 14. Fear of others watching | 2.44 (0.94) | 1.74 (1.18) | 3 | 19 | 37 | 33 | 8 |
| 15. Fear of embarrassment | 3.11 (0.89) | 2.60 (1.18) | 0 | 7 | 14 | 40 | 39 |
| 16. Avoids talking to authority | 2.03 (1.04) | 1.58 (1.18) | 5 | 29 | 29 | 29 | 8 |
| 17. Distressed by trembling or shaking | 2.06 (1.33) | 1.23 (1.15) | 17 | 18 | 23 | 26 | 16 |
Mean scores for each SPIN item at baseline and at end-point in the groups with social phobia were calculated (Table 6). The symptoms with the highest scores were items 11 (avoiding having to give speeches), 9 (avoiding activities in which the person is the centre of attention), 6 (avoidance of doing things or speaking to people for fear of embarrassment), 15 (being embarrassed or looking stupid is one of the worst fears), and 5 (being criticised scares me a lot). Among groups I and II, only two symptoms were endorsed at the level of “a little bit”, and these were items 5 (being criticised scares me a lot) and 11 (avoiding having to give speeches). Comparison of each item between subjects with social phobia and non-social phobic subjects indicated highly significant differences (P≤0.0001) in all cases, both for treatment and post-treatment social phobia samples v. controls.
Factor analysis
Principal-components factor analysis of data from groups III and IV (n=148) yielded five main factors, with eigenvalues ranging from 5.51 to 1.06 (Table 7). Factors 1, 2 and 4 loaded on items related to fear and avoidance of: talking to strangers and in social gatherings (factor 1); criticism and embarrassment (factor 2); and people in authority (factor 4). Factor 3 contained items related to physiological changes (e.g. sweating, trembling or shaking, palpitations and blushing); factor 5 loaded on avoiding being the centre of attention and of public speaking. Of note, the item related to fear of others watching loaded equally on factors 3, 4 and 5.
Table 7 Rotated factor structure of the SPIN in subjects with social phobia (groups III and IV). Final communality estimate=11.49

| Factor | 1 | 2 | 3 | 4 | 5 |
|---|---|---|---|---|---|
| Eigenvalue | 5.51 | 2.32 | 1.38 | 1.22 | 1.06 |
| Item | |||||
| 1. Fear of people in authority | 0.09 | 0.26 | 0.19 | 0.81 | 0.08 |
| 2. Bothered by blushing | -0.02 | 0.38 | 0.65 | -0.03 | 0.15 |
| 3. Fear of parties and social events | 0.83 | 0.04 | -0.02 | 0.05 | 0.26 |
| 4. Avoids talking to strangers | 0.80 | 0.17 | 0.16 | 0.03 | -0.06 |
| 5. Fear of criticism | 0.04 | 0.79 | -0.04 | 0.38 | 0.06 |
| 6. Avoids embarrassment | 0.24 | 0.67 | 0.23 | 0.15 | 0.10 |
| 7. Distressed by sweating | 0.13 | 0.34 | 0.75 | 0.04 | 0.07 |
| 8. Avoids parties | 0.80 | -0.09 | 0.02 | 0.02 | 0.26 |
| 9. Avoids being the centre of attention | 0.29 | 0.27 | 0.12 | 0.03 | 0.74 |
| 10. Fear of talking to strangers | 0.75 | 0.19 | 0.09 | 0.21 | 0.02 |
| 11. Avoids speeches | 0.08 | 0.02 | 0.10 | 0.06 | 0.84 |
| 12. Avoids criticism | -0.01 | 0.68 | 0.09 | 0.47 | 0.15 |
| 13. Distressed by palpitations | 0.12 | 0.08 | 0.67 | 0.29 | 0.14 |
| 14. Fear of others watching | 0.26 | 0.22 | 0.34 | 0.33 | 0.39 |
| 15. Fear of embarrassment | 0.10 | 0.78 | 0.25 | -0.03 | 0.10 |
| 16. Avoids talking to authority | 0.13 | 0.16 | 0.22 | 0.85 | 0.02 |
| 17. Distressed by trembling or shaking | 0.01 | -0.09 | 0.67 | 0.20 | 0.00 |
DISCUSSION
The results of this study indicate that the SPIN exhibits acceptable psychometric properties. It demonstrates both good test—retest reliability and internal cohesion, and subjects use the full range of the scale without tending to avoid extremes. The SPIN also shows a substantial difference between people with social phobia and people without, when compared with a ‘gold standard’ clinical interview.
Validation
Support for the validity of the SPIN is demonstrated through significant correlations with other established scales of social anxiety, notably the LSAS, the BSPS, and the social phobia sub-scale of the FQ, as well as a scale of general disability (SDS). Good convergent validity was demonstrated relative to the total BSPS and LSAS scores, as well as to the BSPS fear, avoidance, and physiological sub-scales measures and the FQ social phobia sub-scale. As anticipated, no correlation was observed with the SF-36, demonstrating good divergence relative to a measure for which no a priori connection was expected. However, somewhat lower, but statistically significant, correlations were obtained with the blood-injury item on the FQ social phobia sub-scale and the SDS. Although these latter correlations do not statistically demonstrate divergence, the weaker correlations observed are what may be expected when using scales not developed to measure social anxiety. None the less, with respect to the SDS, this finding highlights the relationship between functional impairment, disability, and severity of symptoms in social phobia. Calculation of effect sizes indicated that the SPIN performed well in relation to both observer-rated and self-rated comparator scales, albeit slightly less well than the BSPS.
Another important goal for the SPIN is to serve as an instrument which discriminates between the effectiveness of different treatments. In two of the databases available to us (groups III and V), evidence for such differences was compiled, in that drug effects exceeded placebo effects. Moreover, final scores obtained on drug and placebo treatment, respectively, were very similar in the two studies. We also observed that a clinical judgement of ‘very much improved’ corresponded to a mean reduction of 54-59% in the total SPIN score, while ‘much improved’ corresponded to a mean reduction of 44-53%. These data would suggest that a 50% reduction in SPIN score might be a criterion of response in a clinical trial.
Factorial composition
Factor analysis of subjects with social phobia produced five factors and exhibited similarity to patterns identified previously in populations with social phobia (Reference Dixon, de Monchaux and SandlerDixon et al, 1957; Reference Davidson, Miner and DeVeaugh-GeissDavidson et al, 1997). The first and strongest factor, Factor I, reflected social inadequacy, with fear and avoidance of talking to strangers and of social gatherings, and was similar to factors IV and V reported for the BSPS. Factor II related to self-esteem, identifying fear and avoidance of criticism. Factor III identified physiological symptoms and corresponded to factor II of the BSPS, as well as Dixon et al's “fear of loss of control, especially bodily control” factor. Factor IV reflected social inferiority, with fear and avoidance of authority. The fifth factor loaded on avoidance of attention to oneself, specifically being the centre of attention and of public speaking — again similar to the BSPS factor II, “ fear of performing actions while being watched”, and to Dixon et al's “fear of exhibitionism”. The correspondence between the factorial composition of the SPIN and the other factorial patterns reported previously further supports the construct validity of the SPIN. It is interesting to note that fear and avoidance of criticism and of authority were identified as strong factors in the SPIN but not in the BSPS; however, these results may reflect differences in the particular study samples.
Diagnostic utility
The potential diagnostic utility of the SPIN as a screening instrument is upheld by our results. The SPIN discriminates well between subjects with and without social phobia, as noted in the highly significant difference in total SPIN scores between subjects with social phobia and non-social phobic controls. Furthermore, the ROC findings indicate that a cut-off score of 19 distinguishes well between a clinical population of social phobia patients who are engaged in treatment outcome trials and a combined group of non-treatment-seeking healthy non-psychiatric volunteers and treatment-seeking psychiatric patients. Given that the scale takes only a few minutes to fill out and can be quickly scored by an observer, its utility perhaps deserves further exploration as a screening instrument and diagnostic tool.
Unique features of the SPIN
Since other psychometrically-validated scales are available, what are the unique contributions of the SPIN? The findings of this study indicate that its advantages are its brevity, simplicity, and ease of scoring, its embracing of three clinically important domains of symptoms, a promising performance with respect to diagnostic efficiency, and an ability to faithfully reflect responses to, and differences between, treatment over time. Its forerunner, the interview-based BSPS, has become relatively well accepted and has established itself in many different settings. None the less, further studies of the SPIN are needed. In particular, information is needed regarding its application in subjects with social phobia according to DSM-IV criteria, as well as in other populations (e.g. children, ethnic minorities, non-English speakers).
Initial studies such as the one we have reported here can tell us no more than the composition of the groups of patients involved, as well as their particular sources of recruitment: issues which all introduce a degree of unrepresentativeness. However, notwithstanding the relatively small sample sizes, we have included subjects with social phobia seeking treatment, non-treatment-seeking healthy volunteers, and a control group of non-social phobic subjects seeking psychiatric treatment. The sample is quite well balanced from the point of view of gender, age and social composition, although the members are predominantly Caucasian.
In summary, as an abbreviated, self-rated scale assessing the fear, avoidance, and physiological aspects of social phobia, the SPIN has satisfied the goals outlined earlier, namely, it distinguishes between individuals with and without social phobia, validly measures severity of illness, is sensitive to the reduction in symptoms over time, and discriminates between different treatments. Hopefully, recognising these attributes, the SPIN may be found to be a useful contribution to the domain of screening for, and treatment response in, social phobia.
Clinical Implications and Limitations
CLINICAL IMPLICATIONS
-
▪ The Social Phobia Inventory (SPIN) provides a patient-rated assessment of the three clinically important symptom domains of social phobia, with the practical advantages of brevity, simplicity and ease of scoring.
-
▪ The SPIN demonstrates solid psychometric properties, can be used as a valid measure of severity of social phobia symptoms, and is sensitive to the reduction in symptoms over time.
-
▪ The SPIN shows promise as a screening measure of, and for testing treatment response to, social phobia, discriminating between treatments of different efficacy.
LIMITATIONS
-
▪ The SPIN has been studied using relatively small sample sizes.
-
▪ Additional information is needed about the application of the SPIN to subjects with DSM-IV social phobia.
-
▪ While psychometrically sound in this population, the SPIN has not been tested in other important groups, notably children, ethnic minorities, and non-English speakers.
ACKNOWLEDGEMENTS
We acknowledge the help of Atul Pande, MD, Brinda Wiita, MD, and Larry A. Tupler, PhD.




eLetters
No eLetters have been published for this article.