


1. Introduction
Shock waves are ubiquitous in science and engineering. They are not only physically interesting in kinetic theory (Struchtrup Reference Struchtrup2005; Boudet, Amarouchene & Kellay Reference Boudet, Amarouchene and Kellay2008; Kosuge, Kuo & Aoki Reference Kosuge, Kuo and Aoki2019), fluid dynamics (Cramer & Crickenberger Reference Cramer and Crickenberger1991; Young & Guha Reference Young and Guha1991; Rendón & Crighton Reference Rendón and Crighton2003), non-equilibrium thermodynamics (Ruggeri Reference Ruggeri1996; Taniguchi et al. Reference Taniguchi, Arima, Ruggeri and Sugiyama2014), plasma physics (Jaffrin & Probstein Reference Jaffrin and Probstein1964; Domínguez-Vázquez & Fernandez-Feria Reference Domínguez-Vázquez and Fernandez-Feria2019) and astrophysics (Levinson & Bromberg Reference Levinson and Bromberg2008; Mostafavi & Zank Reference Mostafavi and Zank2018), but also of practical value in aerospace engineering (Shanmugasundaram & Murty Reference Shanmugasundaram and Murty1980; Chikitkin et al. Reference Chikitkin, Rogov, Tirsky and Utyuzhnikov2015), nuclear engineering (Bondorf, Ivanov & Zimanyi Reference Bondorf, Ivanov and Zimanyi1981; Danielewicz Reference Danielewicz1984), optical engineering (Timokhin et al. Reference Timokhin, Tikhonov, Mursenkova and Znamenskaya2020) and so forth.
As the most violent process in gas dynamics, a shock wave has a quite small thickness. It is usually treated as a surface of discontinuity, through which the flow parameters experience an abrupt jump, and the entropy increases irreversibly. Instead of being the classical solution of the governing differential equations in the rigorous sense, the discontinuity is just a generalised solution of the conservation laws. Despite this fact, it is still somewhat paradoxical that the entropy increase of a shock wave is allowed by the isentropic Euler system, in which no mechanism of dissipation is present. The inevitable jump of flow parameters and the irreversibility of shock compression clearly indicate the breakdown of the adiabatic Euler equations and the presence of dissipative transport processes.
Although the research of shock waves has a history of more than a century (Johnson & Chéret Reference Johnson and Chéret1998; Salas Reference Salas2007), the mechanisms of their formation, maintenance and dissipation, especially the roles of multiple transport phenomena in shock compression, are still not well understood. It is generally acknowledged that dissipative processes play a fundamental role in the transition process of shock waves, but their contributions are far from equal, and less is known about their effects on shock waves, hence the need for further investigation.
To figure out what happens inside shock waves, the so-called shock structure problem arose. It is to provide quantitative descriptions of the thin transition layer of shock waves, which is important to many scientific and engineering issues (Shanmugasundaram & Murty Reference Shanmugasundaram and Murty1980; Bondorf et al. Reference Bondorf, Ivanov and Zimanyi1981; Danielewicz Reference Danielewicz1984; Chikitkin et al. Reference Chikitkin, Rogov, Tirsky and Utyuzhnikov2015; Timokhin et al. Reference Timokhin, Tikhonov, Mursenkova and Znamenskaya2020). The shock structure problem is quite complicated as it always involves multiple transport processes, including at least viscosity and heat conduction. For shocks in reacting gases and plasmas, e.g. detonation waves and hydromagnetic shock waves, the problem is made even more complicated by molecular diffusion, chemical reactions and electric currents. For simplicity, in this work we will concentrate on the basic case, in which only viscosity and heat conduction are taken into account. Additionally, the issue of this paper can be simplified and approached by considering the one-dimensional steady flow of a stationary normal shock, because the vanishingly small thickness eliminates the influence of unsteady effects and curved fronts on the internal structure of shock waves.
To the authors’ knowledge, there are dozens of developed theories and thousands of papers dealing with the shock structure problem. An exhaustive review of this subject is nearly impossible, and one can expect only to grasp some of the most important points from those established approaches. Hence, we will focus on the most significant and the most relevant.
Like many other problems of fluid mechanics, there are three ways to deal with the shock structure problem – the experimental, the theoretical and the computational. On the experimental side, the extremely small thickness of shock fronts poses a major difficulty to the observation of the flow inside shock waves. The hot-wire technique is only valid for shocks with a large thickness, i.e. weak shocks. At the same time, the transition layer is too thin to be observed in detail with optical methods as its typical thickness is of the order of several mean free paths (10−7 m), close to the wavelength of visible light. In consequence, the lack of experimental data once seriously hindered the understanding of the mesoscopic shock structure, and it was not until the 1960s that the electron beam technique made the practical measurement of flow parameters possible (see Alsmeyer (Reference Alsmeyer1976) and Pham-Van-Diep, Erwin & Muntz (Reference Pham-Van-Diep, Erwin and Muntz1989) and the references therein).
The theoretical research on shock structure began with the pioneering work of Rankine (Reference Rankine1870), in which he first realised the importance of dissipation in shock waves and believed that heat conduction is necessary for shocks to sustain themselves. He also discovered an analytical solution for the profile of steady shocks in heat-conducting inviscid gases. Rayleigh (Reference Rayleigh1910) subsequently found the deficiencies in Rankine's study and pointed out that viscosity is also responsible for the permanency of shocks. Almost simultaneously, Taylor (Reference Taylor1910) derived a perturbative solution for weak shocks (with both viscosity and heat conduction present), as well as the thickness.
The structure of shock waves of arbitrary strength was first exhibited in a landmark paper by Becker (Reference Becker1922), where the Navier–Stokes equations are employed to give an analytical solution. Although this implicit solution is only applicable to a special Prandtl number of  $3/4$, it is still of great significance because
  $3/4$ is a good approximation to the actual value of most gases. However, due to the utilisation of constant viscosity and thermal conductivity, the thickness of strong shocks predicted by Becker is vanishingly small, even making the Navier–Stokes equations inappropriate. To fix it, Thomas (Reference Thomas1944) briefly improved Becker's investigation by assuming a hard-sphere gas to allow for the temperature dependence of the viscosity and thermal conductivity, which can increase the calculated thickness. Morduchow & Libby (Reference Morduchow and Libby1949) further extended the investigation to cases in which the transport coefficients are power functions of temperature. Subsequently, Hayes (Reference Hayes1958) provided a comprehensive summary of the analytical solutions available at the time and derived some new ones. In the following decades, plenty of studies have been devoted to seeking more analytical solutions, and many have been deduced under all kinds of assumptions, including approximate solutions for arbitrary Prandtl numbers (Khidr & Mahmoud Reference Khidr and Mahmoud1985), solutions at large and small Prandtl numbers (Johnson Reference Johnson2013), solutions for hard-sphere and Maxwellian gases (Myong Reference Myong2014), solutions for soft-sphere (Uribe & Velasco Reference Uribe and Velasco2019) and van der Waals (Patel & Singh Reference Patel and Singh2019) gases, closed-form (explicit) solutions (Johnson Reference Johnson2014), unsteady (time-dependent) solutions (Iannelli Reference Iannelli2013) and so forth. In particular, if the scope of discussion is not limited to macroscopic continuum hydrodynamics, the famous works of Mott-Smith (Reference Mott-Smith1951) and Muckenfuss (Reference Muckenfuss1962), which gave approximate bimodal solutions for the velocity distribution function in strong shocks, should also be mentioned.
On the computational side, numerical techniques are becoming ubiquitous in solving the problems of fluid dynamics. With the development of computational science, the shock structure problem has benefited a lot, especially from the numerical methods of molecular dynamics (Valentini &Schwartzentruber Reference Valentini and Schwartzentruber2009), direct simulation Monte Carlo (DSMC) (Bird Reference Bird1970, Reference Bird1994), direct simulation of the Boltzmann equation (Ohwada Reference Ohwada1993; Kosuge, Aoki & Takata Reference Kosuge, Aoki and Takata2001), simplified models of the Boltzmann equation such as the Bhatnagar–Gross–Krook (BGK) model (Liepmann, Narasimha & Chahine Reference Liepmann, Narasimha and Chahine1962; Xu & Tang Reference Xu and Tang2004), the discrete velocity model/method (DVM) (Broadwell Reference Broadwell1964; Gatignol Reference Gatignol1975; Inamuro & Sturtevant Reference Inamuro and Sturtevant1990; Malkov et al. Reference Malkov, Bondar, Kokhanchik, Poleshkin and Ivanov2015), the classical and modified Navier–Stokes equations (Holian et al. Reference Holian, Patterson, Mareschal and Salomons1993; Greenshields & Reese Reference Greenshields and Reese2007; Uribe & Velasco Reference Uribe and Velasco2018), the higher-order hydrodynamic equations represented by the Burnett equations (Reese et al. Reference Reese, Woods, Thivet and Candel1995; Agarwal, Yun & Balakrishnan Reference Agarwal, Yun and Balakrishnan2001; García-Colín, Velasco & Uribe Reference García-Colín, Velasco and Uribe2008; Bobylev et al. Reference Bobylev, Bisi, Cassinari and Spiga2011; Zhao et al. Reference Zhao, Chen, Liu and Agarwal2014; Jadhav, Gavasane & Agrawal Reference Jadhav, Gavasane and Agrawal2021), Grad's moment equations and variants (Torrilhon & Struchtrup Reference Torrilhon and Struchtrup2004; Torrilhon Reference Torrilhon2016; Cai & Wang Reference Cai and Wang2020; Cai Reference Cai2021), generalised hydrodynamics (Al-Ghoul & Eu Reference Al-Ghoul and Eu1997, Reference Al-Ghoul and Eu2001a,Reference Al-Ghoul and Eub), the nonlinear coupled constitutive relations (Jiang et al. Reference Jiang, Zhao, Chen and Agarwal2019) and extended thermodynamics (Ruggeri Reference Ruggeri1996; Taniguchi et al. Reference Taniguchi, Arima, Ruggeri and Sugiyama2014), as well as their hybrid approaches, such as Boltzmann–MC (numerical calculation of the Boltzmann equation with collision integral evaluated by the Monte Carlo method) (Hicks, Yen & Reilly Reference Hicks, Yen and Reilly1972), DVMC (DVM with Monte Carlo evaluations of the collision integral) (Kowalczyk et al. Reference Kowalczyk, Palczewski, Russo and Walenta2008; Morris, Varghese & Goldstein Reference Morris, Varghese and Goldstein2011), BGK–DSMC (combination of the BGK scheme and the DSMC method) (Fei & Jenny Reference Fei and Jenny2021; Fei, Hu & Jenny Reference Fei, Hu and Jenny2022) and BGK–Burnett (the Burnett equations derived from the BGK model, with entropy consistency improved) (Balakrishnan Reference Balakrishnan1999, Reference Balakrishnan2004).
Based on the solution methods developed for the shock structure problem, the present study is dedicated to figuring out the roles of viscosity and heat conduction in the mechanism of shock transition and increasing the basic understanding of the physics of shock waves. The rest of the paper is organised as follows. In § 2, the mathematical formulation of the shock structure problem, i.e. the governing equations and boundary conditions, is described. In § 3, the principal role in the formation and maintenance of a shock wave is discussed by conducting an analysis on the existence of smooth shock solutions for Prandtl numbers from zero to infinity. In § 4, the counter-intuitive entropy overshoot phenomenon inside shock fronts is introduced, and the necessity of heat conduction to it is demonstrated. Finally, § 5 gives a summary and a discussion of the main findings, as well as the directions for future work.
2. Basic equations
The basic equations governing the one-dimensional motion of gases, i.e. the conservation equations of mass, momentum and energy for continuum gas, can be given as
 \begin{gather}\frac{{\partial \rho }}{{\partial t}} + \frac{{\partial (\rho V)}}{{\partial x}} = 0,\end{gather}
 \begin{gather}\frac{{\partial (\rho V)}}{{\partial t}} + \frac{\partial }{{\partial x}}(\rho {V^2} + p + \tau ) = 0,\end{gather}
 \begin{gather}\frac{\partial }{{\partial t}}\left[ {\rho \left( {u + \frac{{{V^2}}}{2}} \right)} \right] + \frac{\partial }{{\partial x}}(\rho V{h_{\textrm{t}}} + \tau V + q) = 0,\end{gather}
where t, x,  $\rho $, V, p, u,
  ${h_t}$,
  $\tau $ and q represent time, position, density, velocity, pressure, specific internal energy, specific total enthalpy, longitudinal viscous stress and heat flux, respectively. Note that, in order to follow the convention of kinetic theory, the sign of
  $\tau $ used here is opposite to that used in the field of fluid mechanics.
To avoid complicating the problem with unnecessary details, constitutive relations
 \begin{equation}\tau ={-} \frac{4}{3}\mu \frac{{\partial V}}{{\partial x}},\end{equation}
and
 \begin{equation}q ={-} \kappa \frac{{\partial T}}{{\partial x}},\end{equation}
are employed for the viscous stress and heat flux, regardless of higher-order terms. Here, T,  $\mu $ and
  $\kappa $ are temperature, dynamic viscosity and thermal conductivity, respectively. Note that
  $\mu $ and
  $\kappa $ are not necessarily constant; any nonlinear constitutive term can be included in them if needed. Equations (2.1)–(2.5) make up the one-dimensional Navier–Stokes equations.
Considering the one-dimensional flow of a steady normal shock with the coordinate system fixed on the wavefront, dropping the  $\partial /\partial t$ terms from (2.1)–(2.3) and integrating the resulting ordinary differential equations with respect to x, one has
 \begin{gather}\rho V = {J_m},\end{gather}
 \begin{gather}\rho {V^2} + p + \tau = {J_P},\end{gather}
 \begin{gather}\rho V{h_t} + \tau V + q = {J_E},\end{gather}
where  ${J_m}$,
  ${J_P}$ and
  ${J_E}$ are the constants of integration, as well as the fluxes of mass, momentum and energy. Because
  $\tau $ and q tend to zero at
  $x ={\pm} \infty $, from (2.6)–(2.8) we have
 \begin{equation}{J_m} = {\rho _1}{V_1} = {\rho _2}{V_2},\end{equation}
 \begin{equation}{J_P} = {\rho _1}V_1^2 + {p_1} = {\rho _2}V_2^2 + {p_2},\end{equation}
 \begin{equation}{J_E} = {\rho _1}{V_1}{h_{t,1}} = {\rho _2}{V_2}{h_{t,2}},\end{equation}
in which the subscripts ‘1’ and ‘2’ denote the states of the gas far upstream  $(x ={-} \infty )$ and far downstream
  $(x ={+} \infty )$ of the shock front, respectively.
Combining equations (2.4)–(2.8) with the equation of state for ideal gases
 \begin{equation}p = \rho RT,\end{equation}
( $R$ is the gas constant) and eliminating
  $\tau $, q, p and
  $\rho $ from them, we obtain
 \begin{equation}\frac{{\textrm{d}V}}{{\textrm{d}\kern 0.06em x}} = \frac{3}{{4\mu }}\left[ {{J_m}\left( {V + \frac{{RT}}{V}} \right) - {J_P}} \right],\end{equation}
and
 \begin{equation}\frac{{\textrm{d}T}}{{\textrm{d}\kern 0.06em x}} = \frac{1}{\kappa }\left[ {{J_m}\left( {u - \frac{{{V^2}}}{2}} \right) + {J_P}V - {J_E}} \right],\end{equation}
after rearrangement. Here, one should note that u is a function of T. This system is obviously autonomous as x does not appear explicitly in the equations. Therefore, if  $V(x)$ and
  $T(x)$ are a solution of the system,
  $V(x + C)$ and
  $T(x + C)$, where C is an arbitrary constant, also satisfy (2.13) and (2.14), i.e. the solution is not unique. As a result, the origin point can be specified at any position as required. In this paper, the position of
  $x = 0$ is set at the point where
  $V = ({V_1} + {V_2})/2$ unless otherwise noted.
The structure of shock waves is fully described by the system of (2.13) and (2.14) and is subject to asymptotic boundary conditions
 \begin{equation}\left\{ \begin{array}{@{}l} V( - \infty ) = {V_1}\\ T( - \infty ) = {T_1} \end{array} \right.,\quad \left\{ \begin{array}{@{}l} V( + \infty ) = {V_2}\\ T( + \infty ) = {T_2} \end{array} \right..\end{equation}
 It is generally acknowledged that the Navier–Stokes equations with constant transport coefficients do not describe strong shocks very well in the quantitative sense. Linear constitutive relations predict a vanishingly small thickness for strong shocks because  $\mu $ and
  $\kappa $ are significantly underestimated at high temperatures. In addition to that, the bulk viscosity, which manifests itself sharply in strong non-equilibrium flows of polyatomic gases, does not show up explicitly. However, employing the Navier–Stokes equations would not compromise this work for three reasons:
(i) Nonlinear constitutive relations can be considered in variable transport coefficients (e.g. temperature-dependent transport coefficients). By treating
 $\mu $ and $\kappa $ as black boxes, any complex constitutive relations, including the viscous stress and heat flux from the high-order hydrodynamics, can be taken into account through equivalent transport coefficients without changing the form of the Navier–Stokes equations.
(ii) The qualitative features of shock waves are well described by the Navier–Stokes equations, whether improved or not.
(iii) The quantitative aspects of strong shocks can be well described by the Navier–Stokes equations if appropriate modifications are made (e.g. Holian et al. Reference Holian, Patterson, Mareschal and Salomons1993, Greenshields & Reese Reference Greenshields and Reese2007).


3. Critical role of viscosity
In this section, to figure out the roles of viscosity and heat conduction in the formation and maintenance of shock waves, theoretical and numerical techniques are used to investigate the influence of each transport phenomenon on the existence of smooth shock solutions. Through comparing the cases of viscous  $(\mu > 0,\kappa = 0)$, heat-conducting
  $(\kappa > 0,\mu = 0)$ and general
  $(\mu > 0,\kappa > 0)$ shocks, it is found that the critical role in shock compression is played by viscosity.
Despite the fact that viscosity and heat conduction in gases are both the consequences of molecular collisions and are thus closely related, it still matters to look into the case when they are independent of each other because they are usually described separately in fluid mechanics, which contains no presupposed relation between viscosity and thermal conductivity.
It should be noted that the currently used theoretical model and numerical method allow for non-constant specific heats and variable Prandtl number, as no requirements other than the obvious basics, i.e. positive specific heats and non-negative transport coefficients, are assumed. However, in the following calculations, constant specific heats and constant Prandtl numbers are used for simplicity and ease of presentation, without loss of generality. Variable specific heats and non-constant Prandtl number quantitatively affect the solution, leading to slight changes in the distribution of flow variables and the shock thickness, but in general, do not change the qualitative features of the shock structure, such as the smoothness and monotonicity of shock profiles. The only substantive effect of the variability of thermophysical properties on this research is that the post-shock parameters can no longer be derived from the Rankine–Hugoniot jump conditions in the usual way but rather be calculated iteratively, which makes the initial values for numerical integration more cumbersome to obtain.
3.1. Existence of viscous shock solutions
For viscous shocks, a relation between V and T can be obtained by rearranging (2.14) into
 \begin{equation}u(T) - \frac{{{V^2}}}{2} + {J_{Pm}}V - {J_{Em}} = \frac{\kappa }{{{J_m}}}\frac{{\textrm{d}T}}{{\textrm{d}\kern 0.06em x}} = 0,\end{equation}
where  ${J_{Pm}} \equiv {J_P}/{J_m}$, and
  ${J_{Em}} \equiv {J_E}/{J_m}$. If the specific heat
  ${c_v}$ of the gas is constant, letting
  $u(T) = {c_v}T$, (3.1) can be rewritten as
 \begin{equation}T = \frac{1}{{{c_v}}}\left( {\frac{{{V^2}}}{2} - {J_{Pm}}V + {J_{Em}}} \right).\end{equation}
The substitution of (3.2) into (2.13) finally gives
 \begin{equation}\frac{{\textrm{d}V}}{{\textrm{d}\kern 0.06em x}} = \frac{3}{{4\mu }}\left[ {\frac{{\gamma + 1}}{2}{J_m}V + (\gamma - 1)\frac{{{J_E}}}{V} - \gamma {J_P}} \right],\end{equation}
where  $\gamma $ is the specific heat ratio.
The velocity distribution in a viscous shock can be obtained by numerically integrating equation (3.3) with the fourth-order Runge–Kutta method, and then the temperature distribution can be algebraically calculated from (3.2). Similar to the temperature, other variables can also be calculated without involving an integration. For example, the values of density and pressure can be obtained by substituting those of velocity and temperature into (2.6) and (2.12). Utilising the foregoing method, the structure of viscous shocks over a wide range of Mach numbers  $(M{a_1})$ is successfully calculated, and the results of four representative shocks, from extremely weak to extremely strong, are shown in figure 1.

Figure 1. Smooth profiles for viscous shocks at (a)  $M{a_1} = 1.05$, (b)
  $M{a_1} = 1.5$, (c)
  $M{a_1} = 5$ and (d)
  $M{a_1} = 50$. The properties of hard-sphere monatomic gases
  $(\gamma = 5/3,\mu \propto {T^{1/2}})$ are assumed in the calculation. No distinction is visible between the velocity distributions of our numerical result (thick lines) and Hayes’ analytical solution (squares) (Hayes Reference Hayes1958).
In this figure, the flow variables have been normalised, and the position x is non-dimensionalised with the mean free path of the molecules in the incident gas  $({\lambda _1})$. The hard-sphere model leads to a mean free path (Shen Reference Shen2005)
 \begin{equation}\lambda = \frac{8}{5}\frac{\mu }{\rho }\sqrt {\frac{2}{{{{\rm \pi} }RT}}} .\end{equation}
In the rest of this paper, the mean free path is calculated using (3.4) unless otherwise specified.
It can be seen from figure 1 that viscous shock solutions exist for Mach numbers from 1.05 up to at least 50. In fact, if the specific heat ratio remains unchanged during the compression, analytical solutions for viscous shocks can be derived from an integral of (3.3) over velocity under certain conditions, e.g. assuming a constant viscosity or a temperature-dependent viscosity directly proportional to  ${T^{1/2}}$ (hard-sphere molecules) or T (Maxwellian molecules), and these solutions are applicable to shocks of any strength (Rayleigh Reference Rayleigh1910; Taylor Reference Taylor1910; Becker Reference Becker1922; Hayes Reference Hayes1958; Johnson Reference Johnson2013). Comparing the general case to special cases with a known analytical solution, it is not difficult to see that a different value for viscosity only results in the change in velocity gradient and shock wave thickness without substantive effects on the qualitative nature of the solution. Therefore, both numerical and analytical evidence indicate the existence of smooth solutions for viscous shocks of arbitrary strength, although an analytical solution may not always be found.
3.2. Existence of heat-conducting shock solutions
Similar to the case of viscous shocks, an algebraic equation about V and T can be obtained for heat-conducting shocks by rearranging (2.13) into
 \begin{equation}{V^2} - {J_{Pm}}V + RT = \frac{{4\mu V}}{{3{J_m}}}\frac{{\textrm{d}V}}{{\textrm{d}\kern 0.06em x}} = 0,\end{equation}
which determines a parabola in the V–T plane. Equation (3.5) has two roots for  $V$
$V$
 \begin{equation}V = \Big({J_{Pm}} \pm \sqrt {J_{Pm}^2 - 4RT} \Big)/2.\end{equation}
The substitution of (3.6) into (2.14) finally gives
 \begin{equation}\frac{{\textrm{d}T}}{{\textrm{d}\kern 0.06em x}} = \frac{{{J_m}}}{\kappa }\left[ {u(T) + \frac{{RT}}{2} + \frac{{{J_{Pm}}}}{4}({J_{Pm}} \pm \sqrt {J_{Pm}^2 - 4RT} ) - {J_{Em}}} \right].\end{equation}
To determine which root should be used in the integration, further investigation is needed.
When  $\mu = 0(\tau = 0)$, (2.7) is reduced to
 \begin{equation}\rho {V^2} + p = {J_P}.\end{equation}
Equations (2.6) and (3.8), are exactly the governing equations of the Rayleigh flow. This suggests that the heat-conducting shock is actually a kind of Rayleigh flow, but the heat addition comes from internal streamwise heat conduction, instead of an external heat source.
The system of (2.6), (2.12), (3.8) and the equation for specific entropy  $(s)$, establishes a unique relation between any two variables of p,
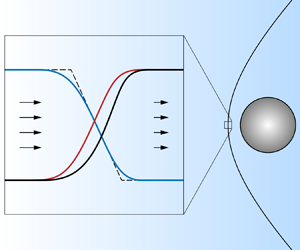
  $\rho $, V, T and s, such as (3.5) for V and T. Hence the process line of a heat-conducting shock, namely, the Rayleigh line, can be drawn in the phase plane of any two variables, as illustrated in figure 2.

Figure 2. Rayleigh lines in the (a) V–T and (b) s–T planes. The arrows indicate the direction of compression.
It can be clearly seen from figure 2 that there is an extreme point for T, where T reaches its maximum value. We shall call this point the ‘critical point’. The temperature rises before the phase point reaches it and drops after the phase point passes it. Referring to (3.5) and letting  $\textrm{d}T/\textrm{d}V = 0$, one has
  ${V_{cr}} = {J_{Pm}}/2$,
  ${T_{cr}} = J_{Pm}^2/(4R)$ and
 \begin{equation}M{a_{cr}} = \frac{{{V_{cr}}}}{{\sqrt {\gamma R{T_{cr}}} }} = \frac{1}{{\sqrt \gamma }},\end{equation}
where the subscript ‘cr’ stands for ‘critical’. Obviously, the critical Mach number is smaller than 1. For a shock wave, because  $Ma$ monotonically decreases from
  $M{a_1}( > 1)$ to
  $M{a_2}( < 1)$, the phase point will not pass the critical point when
  $M{a_2} > M{a_{cr}}$ and will pass the critical point when
  $M{a_2} < M{a_{cr}}$.
As shown in figure 2(a), the critical point divides the solution curve into two parts. On the right part, where  $V > {V_{cr}}$ or
  $Ma > M{a_{cr}}$, the sign ‘+’ is used in (3.6) and (3.7); on the left part, where
  $V < {V_{cr}}$ or
  $Ma < M{a_{cr}}$, the sign ‘−’ is used in (3.6) and (3.7). Thus, for integrations from point 1 to point 2, (3.7) is further detailed as
 \begin{equation}\frac{{\textrm{d}T}}{{\textrm{d}\kern 0.06em x}}
= \left\{ {\begin{array}{*{20}{l}} {\dfrac{{{J_m}}}{\kappa
}\left[ {u(T) + \dfrac{{RT}}{2} +
\dfrac{{{J_{Pm}}}}{4}({J_{Pm}} + \sqrt {J_{Pm}^2 - 4RT} ) -
{J_{Em}}} \right]}&{\textrm{before}\ T\ \textrm{reaches}\
{T_{cr}},}\\ {\dfrac{{{J_m}}}{\kappa }\left[ {u(T) +
\dfrac{{RT}}{2} + \dfrac{{{J_{Pm}}}}{4}({J_{Pm}} - \sqrt
{J_{Pm}^2 - 4RT} ) - {J_{Em}}} \right]}&{\textrm{after}\ T\
\textrm{reaches}\ {T_{cr}}\textrm{.}} \end{array}}
\right.\end{equation}
\begin{equation}\frac{{\textrm{d}T}}{{\textrm{d}\kern 0.06em x}}
= \left\{ {\begin{array}{*{20}{l}} {\dfrac{{{J_m}}}{\kappa
}\left[ {u(T) + \dfrac{{RT}}{2} +
\dfrac{{{J_{Pm}}}}{4}({J_{Pm}} + \sqrt {J_{Pm}^2 - 4RT} ) -
{J_{Em}}} \right]}&{\textrm{before}\ T\ \textrm{reaches}\
{T_{cr}},}\\ {\dfrac{{{J_m}}}{\kappa }\left[ {u(T) +
\dfrac{{RT}}{2} + \dfrac{{{J_{Pm}}}}{4}({J_{Pm}} - \sqrt
{J_{Pm}^2 - 4RT} ) - {J_{Em}}} \right]}&{\textrm{after}\ T\
\textrm{reaches}\ {T_{cr}}\textrm{.}} \end{array}}
\right.\end{equation}To calculate the profiles of heat-conducting shocks, the fourth-order Runge–Kutta method with adaptive step size is used to numerically integrate (3.10) with respect to x. After the temperature distribution is obtained, the velocity distribution can be calculated from (3.6).
Unlike viscous shocks, heat-conducting shocks have two different types of continuous structures, i.e. the subcritical and the supercritical types, as shown in figure 3. They can be numerically constructed with the foregoing procedure. It should be noted that the profile shown in figure 3(b) cannot be calculated in the usual way. The supercritical shock structure can be obtained only by performing the integration separately at both sides of the critical point. This is because the temperature gradient given by (3.10) is positive, but the temperature has to drop after reaching its maximum value at the critical point (see figure 2), leading to a decrease in both T and x then. Hence, it is necessary to change the integral direction at the critical point. Not to mention that the temperature gradient follows different expressions on the two sides of the critical point.

Figure 3. Continuous structures for (a) subcritical and (b) supercritical heat-conducting shocks. The profiles are generated at (a)  $M{a_1} = 1.05$ and (b)
  $M{a_1} = 5$ in a hard-sphere monatomic gas
  $(\gamma = 5/3,\kappa \propto {T^{1/2}})$. For case
  $M{a_1} = 1.05$, no distinction is visible between the numerical velocity profile (thick blue line) and Hayes’ analytical solution (blue squares) (Hayes Reference Hayes1958). The thin black dashed line denotes the line of
  $x = {x_{cr}}$, and the arrows indicate the direction in which the gas is compressed. While the subcritical shock is smooth and allowed by fluid dynamics, the supercritical shock is not smooth and thus unphysical.
Here, the mean free path used for non-dimensionalising x is given by
 \begin{equation}\lambda = \frac{{32}}{{75}}\frac{\kappa }{\rho }\sqrt {\frac{2}{{{{\rm \pi} }{R^3}T}}} ,\end{equation}
which is equivalent to (3.4) for monatomic gases.
Although the supercritical shock is mathematically reasonable, it is clearly unphysical because the decrease in x, the unbounded velocity gradient at the critical point and the non-smoothness of the temperature profile are all impossible. At the same time, the subcritical shock is permitted by the physical laws of fluid dynamics as its qualitative feature is no different from that of a real shock. The key difference between these two shock types is whether the critical point lies within the shock region, as illustrated in figure 4.

Figure 4. Process lines for (a) subcritical and (b) supercritical heat-conducting shocks in the V–T plane, as a part of the Rayleigh line. The temperature drop region appears when the critical point is contained in the shock region.
When a heat-conducting shock is sufficiently strong (figure 4b), the phase point will pass the critical point, leading to a decrease in temperature, which is not allowed in shock compression. Thus, a strong heat-conducting shock with continuous profiles is impossible, and the temperature drop region can be avoided without violating the conservation laws only if a discontinuity occurs before T reaches  ${T_2}$, as shown in figures 5(a) and 5(b). In particular, if the discontinuity occurs right at the position where T first reaches
  ${T_2}$, and the temperature remains unchanged at this position, it is called a ‘shock within the shock’ (Hayes Reference Hayes1958), ‘isothermal jump’ (Zel'dovich & Raizer Reference Zel'dovich and Raizer2002) or ‘isothermal shock’ (Johnson Reference Johnson2013). To be specific, the temperature reaches its final value before the velocity does, and then V directly jumps to
  ${V_2}$, as illustrated in figures 5(c) and 5(d). In order to distinguish between the discontinuity and the whole wave, we adopt the terminology used in Zel'dovich & Raizer (Reference Zel'dovich and Raizer2002): the whole wave is called an ‘isothermal shock’, while the discontinuity within it is called an ‘isothermal jump’. However, the isothermal shock solution is also unphysical due to the discontinuity.

Figure 5. Structures and process lines of heat-conducting shocks with a jump: the (a) structure and (b) process line with a general jump; the (c) structure and (d) process line with an isothermal jump. All jumps are represented by dashed lines.
As mentioned above, the phase point will not pass the critical point when  $M{a_2} > 1/\sqrt \gamma $, so
  $M{a_2} > 1/\sqrt \gamma $ is also the condition necessary for the existence of heat-conducting shock solutions. If
  $\gamma $ is constant, this condition can also be written as
 \begin{equation}M{a_1} < \sqrt {\frac{{3 - 1/\gamma }}{{3 - \gamma }}} .\end{equation}
For  $\gamma = 5/3$ and
  $\gamma = 7/5$, the critical free-stream Mach numbers are approximately 1.3416 and 1.1952, respectively. This value is so small for
  $M{a_1}$ that the shock of critical strength cannot be regarded as strong, not even of medium strength. In consequence, the solution region for heat-conducting shocks is quite narrow.
3.3. Existence of general shock solutions
In §§ 3.1 and 3.2, the existence of smooth shock solutions is discussed for cases in which only viscosity or heat conduction is taken into account. In this subsection, the same research is conducted on shock waves with both viscosity and heat conduction present.
In the case of the Prandtl number equals the special value  $3/4$, Becker (Reference Becker1922) noticed that the energy equation (2.8) can be reduced to
 \begin{equation}h(T) + \frac{{{V^2}}}{2} = {J_{Em}},\end{equation}
which evidently indicates an invariant total enthalpy. Just like (3.1) and (3.5), (3.13) provides an algebraic relation between V and T that makes a series of analytical solutions possible when the specific heats are constant. The simplest one, first discovered by Becker (Reference Becker1922), was subsequently extended by other researchers, as introduced in § 1. These solutions are valid for arbitrary shock strength and can be found in many papers and textbooks (e.g. Hayes Reference Hayes1958; Zel'dovich & Raizer Reference Zel'dovich and Raizer2002; Johnson Reference Johnson2013). However, no algebraic relation between V and T is found for a more general Prandtl number ( $Pr > 0$ and
  $Pr \ne 3/4$). The coexistence of two transport phenomena adds much difficulty to the theoretical analysis of general cases, so numerical experiments, rather than mathematical demonstration, are conducted.
The numerical methods for calculating the internal structure of general shocks are briefly introduced in Appendices A and B. It is shown in Appendix A that the most commonly used shooting method (Elizarova, Khokhlov & Montero Reference Elizarova, Khokhlov and Montero2007; Chikitkin et al. Reference Chikitkin, Rogov, Tirsky and Utyuzhnikov2015) does not work very well in this problem. However, with the backward marching method described in Appendix B, parametric calculations are conducted for shocks over a wide range of  $M{a_1}$ (1.05~50) and
  $Pr$ (0.1~10), and their profiles are successfully constructed. The representative results of a hard-sphere monatomic gas (
 $\gamma = 5/3$,
  $Pr = 2/3$,
  $\mu \& \kappa \propto {T^{1/2}}$) are shown in figure 6.

Figure 6. Smooth shock profiles for a hard-sphere monatomic gas in the cases of (a)  $M{a_1} = 1.05$, (b)
  $M{a_1} = 1.5$, (c)
  $M{a_1} = 5$ and (d)
  $M{a_1} = 50$, calculated with the backward marching method.
Here, one should note that the utilisation of the backward marching method is not necessary. Many other well-established numerical methods, such as the finite difference method, are competent to simulate shock fronts, but they are not as efficient and robust as the backward marching method in dealing with the shock structure problem (the backward marching method is unconditionally convergent and insensitive to numerical errors; also, it involves no iteration; more details can be seen in Appendix B), even though none of them are computationally expensive in calculating shock profiles. It should also be noted that the result for  $M{a_1} = 50$, i.e. figure 6(d), may not sufficiently reflect the actual physical process, as rapid ionisation may occur in extremely strong shocks, turning the gas into a plasma, which falls outside the scope of this paper and is far beyond the capability of the currently used model. Nevertheless, the need for test case
  $M{a_1} = 50$ would not be compromised because its introduction is for the primary purpose of checking the existence of smooth solutions under the most extreme conditions and incidentally providing a stringent examination of the theory rather than describing the physical process as accurately as possible, which is beneficial but not necessary.
After successfully carrying out a significant number of calculations for shocks from extremely weak to extremely strong and in gases from nearly inviscid  $(Pr \to 0)$ to nearly adiabatic
  $(Pr \to + \infty )$, we assert that, within the framework of the Navier–Stokes–Fourier formalism, smooth shock structures can always be formed in gases with neither viscosity nor heat conduction vanishing. Although no rigorous mathematical proof is provided, it is easy to numerically verify this conclusion in the most extreme cases.
3.4. Roles of viscosity and heat conduction in shock compression
In this section, utilising the solution methods developed for the shock structure problem, the existence of smooth shock solutions is theoretically and numerically investigated. It is found that:
(i) When viscosity is present, smooth solutions exist for shocks of arbitrary strength, whether heat conduction is present or not.
(ii) When viscosity is absent and heat conduction is present, smooth solutions only exist for shocks below a fairly small critical strength.
Except for the situations mentioned above, the only case left is the case of the adiabatic Euler equations, in which both viscosity and heat conduction vanish, and continuous shock solutions are known to be impossible. Table 1 lists all four cases, presenting the result more clearly.
Table 1. Existence of smooth shock solutions.

From table 1, it is not difficult to see that heat conduction cannot support the formation of strong shocks by itself while viscosity can, and therefore viscosity is necessary and sufficient for shock waves, but heat conduction is not. This conclusion can be interpreted from the perspective of the conservation equations of momentum and energy ((2.7) and (2.8)). While the viscous term shows itself as a source term in both equations, the heat flux term only appears in the energy equation. Physically, a shock wave is an irreversible process that converts mechanical energy into thermal energy, in which both compression and dissipation are essential. Although heat conduction can result in irreversible compression as viscosity does, their mechanisms of action are vastly different. The normal viscous force directly compresses the gas in a mechanical way and converts the kinetic energy of macroscopic motion into thermal energy (kinetic energy of random molecular motion) irreversibly by scattering the momentum of the incoming flow. Heat conduction, on the other hand, only indirectly compresses the gas through the concerted action of geometric constraints and the expansion caused by heating. Not to mention that its irreversibility originates from the decline in the quality of thermal energy, instead of the direct dissipation of mechanical energy. In summary, it is viscosity rather than heat conduction that plays the key role in shock compression.
4. Minor role of heat conduction
In § 3, it is shown that the principal role in shock formation is played by viscosity, and heat conduction is dispensable. However, we also find that heat conduction plays an essential role in the mechanism of the entropy overshoot phenomenon within shock waves. This anomalous phenomenon, as well as the necessity of heat conduction for its emergence, will be introduced in this section.
4.1. Entropy overshoot in shock waves
There are a few curious facts about the internal flow of shock waves, the most noticeable of which are the non-constant total enthalpy (Shoev, Timokhin & Bondar Reference Shoev, Timokhin and Bondar2020) and non-monotonic entropy profile (Morduchow & Libby Reference Morduchow and Libby1949; Serrin & Whang Reference Serrin and Whang1961; Chamberlain Reference Chamberlain1965; Margolin Reference Margolin2017; Margolin, Reisner & Jordan Reference Margolin, Reisner and Jordan2017). While the deviation of total enthalpy inside a shock front is easy to understand (the  $\tau V + q$ term in (2.8) does not vanish in most cases), the entropy behaviour has baffled researchers for decades. Figure 7 shows the entropy profiles of shock waves in a specific gas for various Mach numbers. It can be seen that the entropy exhibits a peak inside the front instead of increasing monotonically as expected.

Figure 7. Distributions of normalised entropy inside shock waves at different Mach numbers. The profiles are generated in a hard-sphere monatomic gas ( $\gamma = 5/3$,
  $Pr = 2/3$,
  $\mu \& \kappa \propto {T^{1/2}}$) with the backward marching method.
There is no doubt that the second law of thermodynamics must be satisfied in the whole process of shock compression, but it appears to be violated by the decreasing entropy downstream of the extreme point. This counter-intuitive behaviour of entropy is usually called the ‘entropy overshoot’ phenomenon.
4.2. Necessity of heat conduction
Since the non-monotonicity of the entropy profile was noticed by Morduchow & Libby (Reference Morduchow and Libby1949), much effort has been spent on explaining it. Serrin & Whang (Reference Serrin and Whang1961) theoretically proved the negativity of  $\textrm{d}s/\textrm{d}\kern 0.06em x$ towards the rear of the wave
  $(x \to + \infty )$, confirming that the specific entropy must be decreasing over the final portion of the shock transition. The necessity of heat conduction to the entropy overshoot phenomenon is also implied in the paper, although no complete proof is provided. Chamberlain (Reference Chamberlain1965) gave a constant-area-streamtube explanation for the decrease in entropy that, while somewhat curious and unable to get to the real issue (i.e. how exactly the second law of thermodynamics is satisfied since it appears to be violated), is nonetheless a beneficial attempt to address the physical mechanisms. However, the principle behind the entropy overshoot phenomenon, i.e. what bridges the gap between positive entropy production and negative entropy change and how to explain the counter-intuitive nature of the phenomenon, remains unclear. In this subsection, we will demonstrate how the second law of thermodynamics is satisfied, and a detailed analysis regarding the role of heat conduction in the mechanism of entropy overshoot will be provided. It is shown that all the anomalies can be attributed to the entropy flux caused by heat conduction.
The full three-dimensional local entropy balance equation in Eulerian form for an infinitesimal control volume can be written as (de Groot & Mazur Reference de Groot and Mazur1984)
 \begin{equation}\frac{{\partial (\rho s)}}{{\partial t}} ={-} \boldsymbol{\nabla }\boldsymbol{\cdot }({\boldsymbol{J}_S} + \rho s\boldsymbol{V}) + \sigma ,\end{equation}
where  $\boldsymbol{V}$ and
  ${\boldsymbol{J}_S}$ are the vectors of velocity and entropy flux, and
  $\sigma $ denotes the time rate of entropy generation per unit volume (also known as the local entropy generation/production rate). The entropy flux
  ${\boldsymbol{J}_S}$ consists of two components which result from heat conduction and diffusion. In single-component gases, only the entropy flux caused by heat conduction remains, i.e.
  ${\boldsymbol{J}_S} = \boldsymbol{q}/T$, where
  $\boldsymbol{q}$ is the heat flux vector.
For the one-dimensional steady flow inside a shock front, (4.1) can be reduced to
 \begin{equation}\rho V\frac{{\textrm{d}s}}{{\textrm{d}\kern 0.06em x}} ={-} \frac{{\textrm{d}{J_S}}}{{\textrm{d}\kern 0.06em x}} + \sigma ,\end{equation}
in which V and  ${J_S}$ are the magnitudes of velocity and entropy flux in the only one dimension x. Due to the presence of term
  $- \textrm{d}{J_S}/\textrm{d}\kern 0.06em x$, non-negative
  $\sigma $ does not necessarily lead to non-negative
  $\textrm{d}s/\textrm{d}\kern 0.06em x$, and only the former is ensured by the second law of thermodynamics. Hence, it is possible that the decreasing entropy downstream of the extreme point does not contradict the second law of thermodynamics. But to make it happen, the positivity of
  $\textrm{d}{J_S}/\textrm{d}\kern 0.06em x$, which relies on heat conduction, is essential. To satisfy ourselves of this, the entropy profiles of shock waves at various Prandtl numbers are plotted for comparison in figure 8. It is shown that the amplitude of entropy overshoot decreases with the increase of Prandtl number (larger Prandtl number indicates relatively less heat conduction). In particular, the overshoot vanishes when heat conduction is absent
  $(Pr ={+} \infty )$ and reaches its maximum when only heat conduction remains
  $(Pr = 0)$. Therefore, heat conduction is necessary for the non-monotonicity of the entropy profile and promotes the entropy overshoot in shock waves. In addition to the subject of the present paper, this conclusion is also important to artificial-viscosity-type shock capturing schemes utilised in computational fluid dynamics, as the unphysical effective Prandtl number resulting from artificial viscosity can lead to serious errors in the flow field, and incorrect estimation of entropy overshoot is just one of the epiphenomena. In view of this, a discussion on the topic should be beneficial, and the central point we are trying to get across is that the problem lies primarily, if not entirely, in the model itself rather than the discretisation process.

Figure 8. Entropy profiles of shock waves in gases with different Prandtl numbers. The results are calculated under the condition of  $M{a_1} = 1.25$ and
  $\gamma = 5/3$. The transport coefficients are assumed to be directly proportional to
  ${T^{1/2}}$, and the mean free path is taken as the arithmetic average of the values calculated with
  $\mu $ (using (3.4)) and
  $\kappa $ (using (3.11)).
On a sparse mesh with a minimum size much larger than the actual shock thickness, artificial viscosity is usually employed to stabilise the front by smearing it with a much greater value than that of the molecular viscosity. It significantly enhances the local dissipation capability and compensates for lowered gradients, thereby capturing the shock. However, a few difficulties, such as the well-known overheating problem (Noh Reference Noh1987; Rider Reference Rider2000), may arise in the region where artificial viscosity takes effect, and one among them related to this study is the lesser-known entropy preserving problem. It is not difficult to see from figure 8 that a large effective Prandtl number resulting from artificial viscosity suppresses the entropy overshoot inside shock waves, leading to a lower peak and incorrect distribution of specific entropy, as indicated in Tonicello, Lodato & Vervisch (Reference Tonicello, Lodato and Vervisch2020). The entropy preserving problem, although less impactful than the excess wall heating problem, deserves more attention. These problems, not to say errors but rather anomalies, are inherent in the physical nature of the artificial viscosity method. By and large, they can be ascribed to the inappropriate allocation of dissipation to which Noh (Reference Noh1987) provides an evident solution – adding an artificial heat flux term to the energy equation. The simplest way to determine the artificial thermal conductivity is to calculate it with the artificial viscosity and the physical Prandtl number, which preserves as much physics as possible while minimising the increase in computational cost (Cook Reference Cook2013; Tonicello et al. Reference Tonicello, Lodato and Vervisch2020). The introduction of artificial heat conduction has been physically justified (Noh Reference Noh1987; Bae & Lahey Reference Bae and Lahey1999; Cook Reference Cook2013; Li, Tian & Wang Reference Li, Tian and Wang2017; Tonicello et al. Reference Tonicello, Lodato and Vervisch2020): enhanced conductivity promptly disperses the heat overly generated by viscous dissipation and restores the balance between viscosity and heat conduction. In particular, it significantly improves the physical consistency of artificial-viscosity-type shock capturing schemes in terms of entropy preservation (Tonicello et al. Reference Tonicello, Lodato and Vervisch2020). To summarise, the physical value of Prandtl number represents a reasonable balance between viscosity and heat conduction, deviation from which may lead to unexpected anomalies.
It is difficult to determine the exact location where the entropy starts to decrease (i.e. the position of  $\textrm{d}s/\textrm{d}\kern 0.06em x = 0$) as no analytical solution for general cases has been found. But a condition that narrows the possible region for entropy drop can be obtained through decomposing the entropy generation. Every transport process contributes to the irreversibility of shock waves. For the problem discussed in this study we have
  $\sigma = {\sigma _h} + {\sigma _v}$, where
  ${\sigma _h}$ and
  ${\sigma _v}$ are the local entropy generation rates due to heat conduction and viscous dissipation, and each of them must be non-negative according to the second law of thermodynamics.
Considering that the theory of non-equilibrium thermodynamics gives  ${\sigma _h} = q\boldsymbol{\nabla }(1/T)$ and noting
  ${J_S} = q/T$, (4.2) can be rearranged into
 \begin{equation}\rho V\frac{{\textrm{d}s}}{{\textrm{d}\kern 0.06em x}} ={-} \frac{1}{T}\frac{{\textrm{d}q}}{{\textrm{d}\kern 0.06em x}} + {\sigma _v}.\end{equation}
Because  ${\sigma _v} > 0$, a positive and sufficiently large
  $\textrm{d}q/\textrm{d}\kern 0.06em x$, which indicates heat-releasing infinitesimal control volumes, is crucial to the negativity of
  $\textrm{d}s/\textrm{d}\kern 0.06em x$, and thus the entropy drop region is fully contained in the exothermic region. In particular, if the thermal conductivity of gases increases with rising temperature, the exothermic region, as well as the entropy drop region, are both the proper subsets of the region in which the temperature curve is convex
  $({\textrm{d}^2}T/\textrm{d}{x^2} < 0)$, as illustrated in figure 9.

Figure 9. Distributions of temperature, temperature gradient, heat flux and entropy in a shock wave  $(M{a_1} = 5)$. The thermal conductivity and temperature are in positive correlation as the properties of hard-sphere monatomic gases (
 $\gamma = 5/3$,
  $Pr = 2/3$,
  $\mu \& \kappa \propto {T^{1/2}}$) are assumed in the calculation. It is quite clear that the extreme point of the heat flux curve is downstream of the temperature inflexion point (also the extreme point of the temperature gradient curve) and upstream of the maximum entropy point, i.e. the exothermic region is included in the convex temperature region and contains the entropy drop region.
5. Summary and discussion
Both viscosity and heat conduction contribute to the compression and dissipation of shock waves, but their importance is far from equal. To reveal their roles in the mechanism of shock waves, the problem of shock structure is revisited and further investigated, with special concentration on the existence of smooth shock solutions, as well as the entropy overshoot phenomenon. Based on the present analysis, the following conclusions can be drawn:
(i) Heat conduction is unable to sustain strong shocks
$(M{a_1} > \sqrt {(3 - 1/\gamma )/(3 - \gamma )} )$ without the assistance of viscosity. In contrast, viscosity is adequate for maintaining smooth profiles at all strengths, even when heat conduction is absent.(ii) The critical role in shock waves is played by viscosity rather than heat conduction, especially in strong shocks. This distinction can be attributed to their different mechanisms of action. While viscous stress directly compresses the gas and converts mechanical energy into thermal energy by scattering directed motion into random motion, heat conduction only indirectly compresses the gas through heating and generates irreversibility by reducing the quality of thermal energy instead of the direct dissipation of mechanical energy.
(iii) Instead of monotonically increasing, the specific entropy has a maximum within the transition layer of shock waves and overshoots its final value.
(iv) Although heat conduction is dispensable in shock formation, it is essential to the entropy overshoot phenomenon inside the wavefront because the entropy flux resulting from it neutralises the positive production of entropy, thus preventing the entropy drop region from violating the second law of thermodynamics and allowing the emergence of an entropy peak.

To summarise, viscosity plays the principal role in shock transition, and heat conduction is dispensable. But to make an entropy overshoot occur, heat conduction is crucial. Here, one should be reminded that, although not fully explained, conclusions (i) and (iii) have been partially confirmed in the literature (Morduchow & Libby Reference Morduchow and Libby1949; Hayes Reference Hayes1958; Serrin & Whang Reference Serrin and Whang1961; Chamberlain Reference Chamberlain1965; Zel'dovich & Raizer Reference Zel'dovich and Raizer2002). In this paper, they are re-emphasised out of systematicity and completeness. By looking into the existence of smooth solutions and the entropy overshoot phenomenon inside shock waves, as well as providing detailed explanations, i.e. conclusions (ii) and (iv), the present study makes a complete physical image regarding the roles of viscosity and heat conduction and their mechanisms of action in shock waves clearer than ever.
In addition to the above, a computational procedure for constructing shock profiles is developed to conduct numerical experiments, and it is proven to be reliable and efficient (see Appendix B for details). The new method is able to solve the shock structure problem in the framework of macroscopic continuum hydrodynamics as long as the constitutive relations are thermodynamically consistent.
It should be noted that the conclusions of this paper are not only applicable to the classical Navier–Stokes equations, as no extra limitations apart from the obvious basics ( $\mu \ge 0$ and
  $\kappa \ge 0$, which are ensured by the second law of thermodynamics) are assumed for
  $\mu $ and
  $\kappa $, and any complex constitutive relations can be taken into account by replacing the transport coefficients with equivalent ones. In other words, the restriction of constant transport coefficients is abandoned, while the ‘linear’ form of constitutive relations is preserved. Although a different expression for
  $\mu $ or
  $\kappa $ affects the quantitative details (such as the shock thickness and the profiles’ shape) of the shock flow, it would not change the qualitative aspects inherent in the system. For example, the bulk viscosity of polyatomic gases, which manifests itself sharply at high temperatures and significantly influences the structure of strong shocks, can be considered in an equivalent/apparent viscosity without changing the ‘linear’ form of viscous stress (2.4). Similarly, the radiative heat transfer in opaque gases can be represented by heat conduction with an equivalent/apparent thermal conductivity directly proportional to
  ${T^3}$ (Zel'dovich & Raizer Reference Zel'dovich and Raizer2002; Johnson Reference Johnson2013). In these cases, our conclusions still hold.
This research only considers the two transport phenomena of viscosity and heat conduction. For shocks in multi-component reactive gases such as detonation waves, molecular diffusion and chemical reactions may significantly affect the shock structure, and the roles of these processes in the mechanism of shock transition need further investigation. Another limitation of this work is that only one temperature is considered. Multiple temperatures not only exist in polyatomic (Taniguchi et al. Reference Taniguchi, Arima, Ruggeri and Sugiyama2016; Alekseev & Kustova Reference Alekseev and Kustova2021) or multi-component gases (Madjarević, Ruggeri & Simić Reference Madjarević, Ruggeri and Simić2014) but also reside in single-component monatomic gases (Malkov et al. Reference Malkov, Bondar, Kokhanchik, Poleshkin and Ivanov2015). Taking the example of a polyatomic gas, due to asynchronous excitation of different degrees of freedom, different internal energy modes may have distinct temperatures, and the relaxations between them are of finite rates. Only by introducing multi-temperature models or using a more fundamental hydrodynamic theory can the behaviours of gases in shock waves related to multiple temperatures, such as the temperature overshoot phenomenon (Madjarević et al. Reference Madjarević, Ruggeri and Simić2014; Malkov et al. Reference Malkov, Bondar, Kokhanchik, Poleshkin and Ivanov2015; Taniguchi et al. Reference Taniguchi, Arima, Ruggeri and Sugiyama2016; Alekseev & Kustova Reference Alekseev and Kustova2021), be correctly described. Hence, how the relaxations between different temperatures affect shock structure and heat conduction therein, especially the influence of the multi-temperature effect on the role of each transport process in shock compression, deserves further exploration. Besides the above two points, how dissipative processes and finite shock thickness reshape the flow field of multi-dimensional shock systems (e.g. the viscous effect in Mach reflection of shock waves Shoev et al. Reference Shoev, Kudryavtsev, Khotyanovsky and Bondar2023) is also of interest.
Acknowledgements
The first author would like to thank Q. Lin for her inspiration.
Funding
This work was supported by the Youth Program of National Natural Science Foundation of China (Grant No. 51706010).
Declaration of interests
The authors report no conflict of interest.
Author contributions
Q.Z.: conceptualisation, methodology, software, investigation, formal analysis, visualisation, writing – original draft, writing – review and editing; Y.W.: validation, writing – review and editing; W.Z.: validation, writing – review and editing; Q.Y.: supervision, funding acquisition, resources; X.X.: supervision, funding acquisition, resources.
Appendix A. Failure of the shooting method
The internal flow of shock waves is described by a set of hydrodynamic equations ((2.6)–(2.8)) that satisfy asymptotic boundary conditions (2.15). It is usually converted into an initial value problem and solved iteratively by the traditional shooting method, as introduced in the literature (Elizarova et al. Reference Elizarova, Khokhlov and Montero2007; Chikitkin et al. Reference Chikitkin, Rogov, Tirsky and Utyuzhnikov2015). Yet this method does not work very well in the shock structure problem. In our verification calculations, no matter how accurate the initial values are, flow variables always depart from their post-shock values when  $x \to + \infty$, as illustrated in figure 10. High sensitivity indicates the existence of instability, so further investigation into the dynamics of the shock system is required.

Figure 10. Example of a Mach 2 shock in a monatomic gas calculated with the shooting method. The initial value point is specified as the origin point.
To find out what leads to the failure of the shooting method, the direction field (or slope field) approach is employed to provide an intuitive observation of the system's dynamics. This approach is quite useful as it establishes a flow pattern for solutions of the differential equations, which reveals qualitative aspects of the system. Based on the direction field determined by (2.13) and (2.14), the phase portrait (phase-plane diagram) of a shock wave with both viscosity and heat conduction present is drawn and shown in figure 11.

Figure 11. Phase portrait of a shock wave in the V–T plane. Point 1 is the pre-shock point; point 2 is the post-shock point. Curve S is the target trajectory that connects points 1 and 2. Dashed line M is the solution curve of heat-conducting shock; dashed line N is the solution curve of viscous shock; L denotes the area bounded by curves M and N. The arrows indicate the direction in which the phase point moves as x increases.
From figure 11 we see that points 1 and 2 are both singular points, with point 1 being an unstable node and point 2 being a saddle point. To solve the shock structure problem is actually to find the integral curve S, which is a heteroclinic orbit starting from point 1 and ending at point 2. However, if we follow the arrow direction to perform an integration from the pre-shock state to the post-shock state, it is not difficult to see that the phase point will approach point 2 first but then move away quickly unless the initial value point is precisely on curve S. In an actual calculation, even if the initial value point is strictly located on curve S, the inevitable round-off error will cause the integral curve to deviate from the target trajectory and be directed out of area L. The nature of point 2 as a saddle point is the direct reason for the divergence of forward marching calculations.
Appendix B. Backward marching method
Given the importance of integral direction, now let us consider the feasibility of a backward marching strategy. It is clearly shown in figure 11 that, if we follow curve S to perform a numerical integration from point 2 to point 1, the integral curve will always reach point 1, regardless of the initial value error and round-off error. Thus a backward marching calculation is valid in principle. Yet this strategy is still troubled by a problem – the determination of the initial value.
Backward marching calculations always converge to the pre-shock point, which is of great benefit but also makes it incompatible with the shooting method. As is well known, the shooting method approaches the exact trajectory by updating the initial value. But the unconditional convergence of a backward marching integration provides no feedback for the iteration, invalidating the shooting method, hence the need for a new initial value determination method.
Point 2 cannot be the initial value point, because the numerical integration cannot start from  $x ={+} \infty $. But we can use the Euler scheme to determine an initial value point
  $({V_0},{T_0})$ near it
 \begin{equation}{T_0} = {T_2} + {\left( {\frac{{\textrm{d}T}}{{\textrm{d}V}}} \right)_2}({V_0} - {V_2}),\end{equation}
where  ${V_0}$ is slightly greater than
  ${V_2}$ and
  ${(\textrm{d}T/\textrm{d}V)_2}$ is the slope of the solution curve at point 2.
Divide both sides of (2.14) by that of (2.13), and the slope of the solution curve in the V–T plane is thus obtained as
 \begin{equation}\frac{{\textrm{d}T}}{{\textrm{d}V}} = \frac{{f(V,T)}}{{g(V,T)\zeta (V,T)}},\end{equation}
in which
 \begin{gather}f(V,T) \equiv{-} \frac{{{V^2}}}{2} + {J_{Pm}}V - {J_{Em}} + u,\end{gather}
 \begin{gather}g(V,T) \equiv {V^2} - {J_{Pm}}V + RT,\end{gather}
 \begin{gather}\zeta (V,T) \equiv \frac{{3\kappa }}{{4\mu V}}.\end{gather}
Note that u,  $\mu $ and
  $\kappa $ are functions of T.
However, the slopes at points 1 or 2 cannot be obtained in the usual way by substituting the values of V and T into (B2)–(B5) as the two points make both f and g be zero. But we can use L'Hôpital's rule to evaluate the indeterminate form  $f/g$.
Multiplying both sides of (B2) by  $\zeta $, considering the resulting equation in a limiting process where the phase point
  $(V,T)$ approaches point
  $i(i = 1,2)$ along the solution curve (during the process T can be regarded as a function of V and vice versa) and applying L'Hôpital's rule to the limit of
  $f/g$, one has
 \begin{equation}{\left( {\zeta \frac{{\textrm{d}T}}{{\textrm{d}V}}} \right)_i} = \mathop {\lim }\limits_{V \to {V_i}} \frac{f}{g} = \mathop {\lim }\limits_{V \to {V_i}} \frac{{{f_V} + {f_T}\dfrac{{\textrm{d}T}}{{\textrm{d}V}}}}{{{g_V} + {g_T}\dfrac{{\textrm{d}T}}{{\textrm{d}V}}}},\end{equation}
where the subscripts ‘ $V$’ and ‘
 $T$’ denote partial derivatives.
Equation (B6) can be rearranged into
 \begin{equation}R{\zeta _i}\left( {\frac{{\textrm{d}T}}{{\textrm{d}V}}} \right)_i^2 + ({g_{V,i}}{\zeta _i} - {c_{v,i}}){\left( {\frac{{\textrm{d}T}}{{\textrm{d}V}}} \right)_i} - {f_{V,i}} = 0,\end{equation}
which has distinct roots
 \begin{equation}{\left( {\frac{{\textrm{d}T}}{{\textrm{d}V}}} \right)_i} = \frac{{{V_i}}}{{2{\gamma _i}R}}\left[ {\frac{4}{3}P{r_i} + \frac{1}{{Ma_i^2}} - {\gamma_i} \pm \sqrt {{{\left( {\frac{4}{3}P{r_i} + \frac{1}{{Ma_i^2}} - {\gamma_i}} \right)}^2} + \frac{{16}}{3}\frac{{({\gamma_i} - 1)P{r_i}}}{{Ma_i^2}}} } \right].\end{equation}
It is not difficult to see that the two roots are real and of opposite signs.
Point 1 is an unstable node, with an infinite number of integral curves starting from it, one pair of which share a positive slope; all other integral curves, including the solution curve S, are tangent at point 1 with the same negative slope. Point 2 is a saddle point, with one pair of integral curves starting from it and one pair ending at it; while the first pair share a positive slope, the second pair with curve S included share a negative slope.
The backward marching technique and the new method for initial value determination practically provide us with a computational procedure for simulating shock wave structure with four major steps:
(i) Use the pre-shock parameters to calculate the post-shock parameters, particularly the post-shock Mach number
$M{a_2}$, post-shock velocity ${V_2}$ and post-shock temperature ${T_2}$.(ii) Substitute the post-shock parameters into the expression of the negative root in (B8) to acquire the slope
${(\textrm{d}T/\textrm{d}V)_2}$.(iii) Set a value
${V_0}$ which is slightly greater than ${V_2}$ and substitute it with other required parameters into (B1) to obtain ${T_0}$.(iv) Use
$({V_0},{T_0})$ as the initial value point to numerically integrate the system of (2.13) and (2.14), during which the step size is negative, and halt the calculation when $|V - {V_1}|$ and $|T - {T_1}|$ are smaller than their tolerances.


Available methods for the numerical integration include but are not limited to the Runge–Kutta method. With this procedure, the distributions of velocity and temperature are acquired. Other variables can be obtained without joining in the integration. For example, the density and pressure can be algebraically calculated by substituting the values of V and T into (2.6) and (2.12). The numerical method introduced in this appendix, which we shall designate as the ‘backward marching method’, allows non-constant transport coefficients, such as temperature-dependent  $\mu $ and
  $\kappa $ for inverse power law models.
To verify the backward marching method, it is employed to simulate the shock structure of a special case. In this case, constant specific heats, constant transport coefficients and the special value  $3/4$ of Prandtl number make an implicit solution (Becker Reference Becker1922; Hayes Reference Hayes1958; Zel'dovich & Raizer Reference Zel'dovich and Raizer2002; Johnson Reference Johnson2013) possible. The numerical results are compared with this analytical solution in figure 12. It is shown that the difference between them is vanishingly small.

Figure 12. Comparison between Becker's analytical solution (denoted by lines) and the numerical results (denoted by symbols) calculated with the backward marching method. No distinction is visible between them.
To prove the stability of backward marching, attenuation of the numerical error induced by inappropriate initial value is demonstrated by analysing the developments of velocity and temperature with decreasing x and comparing them with Becker's solution, as shown in figure 13. In the calculations, the new method for initial value determination is neglected, and large initial value errors are intentionally introduced. It can be seen that the errors monotonically decrease as the integrations proceed upstream, and the distinction between the numerical and exact solutions becomes visually negligible in approximately only two mean free paths, hence the insensitivity of the new algorithm to initial value error.

Figure 13. Comparison between Becker's exact solution and the numerical results of backward marching calculations with large initial value error. The calculations quickly converge to the exact solution in approximately two mean free paths. The numerical integrations are carried out from the downstream (right side) to the upstream (left side) under the condition of  $\mu \& \kappa = \textrm{const}\textrm{.}$,
  $M{a_1} = 2$,
  $\gamma = 7/5$ and
  $Pr = 3/4$.
In summary, the backward marching method can calculate the flow inside shock waves correctly and efficiently. It has the following advantages over the shooting method:
(i) The calculation is unconditionally convergent.
(ii) The calculation is insensitive to initial value error and round-off error, and these inevitable errors decrease with the march of the numerical integration.
(iii) The computational cost is much lower as no iteration is involved.


