


Introduction
Marine sediments play an important role in interpreting past climate change which provides a crucial clue for future climate forecasting (Lisiecki and Raymo Reference Lisiecki and Raymo2005; Tierney et al. Reference Tierney, Poulsen, Montanez, Bhattacharya, Feng, Ford, Hönisch, Inglis, Petersen, Sagoo, Tabor, Thirumalai, Zhu, Burls, Foster, Goddéris, Huber, Ivany, Turner, Lunt, McElwain, Mills, Otto-Bliesner, Ridgwell and Zhang2020; Wang et al. Reference Wang, Li and Tian2014). Previous studies based on foraminifera, bivalve, and coral have made excellent progress in revealing the past climate change (Yan et al. Reference Yan, Liu, Zhang, Li, Zheng, Wei, Xie, Deng and Sun2017; Yu Reference Yu2012; Zhang et al. Reference Zhang, Xu, Beil, Holbourn, Kuhnt, Li, Xiong, Yan, Cui, Liu and Wu2021). However, the ambiguous nature of the marine radiocarbon reservoir effect (MRE) constrains the building of reliable chronology (Alves et al. Reference Alves, Macario, Ascough and Ramsey2018; Burr et al. Reference Burr, Beck, Corrège, Cabioch, Taylor and Donahue2009; Stuiver et al. Reference Stuiver, Pearson and Braziunas1986), thus hindering the reconstruction and comparison of these centennial to millennial scale climate changes. Hence, precisely evaluating temporal and spatial MRE variations is urgently needed in paleoclimate research.
MREs often reflect air-sea exchange, regional ocean circulation, and freshwater input (Stuiver and Ostlund Reference Stuiver and Ostlund1983; Southon et al. Reference Southon, Kashgarian, Metivier and Yim2002). A MRE can be expressed as the radiocarbon age difference between the atmosphere and the surface ocean. This difference is expressed as the value R (reservoir age) in radiocarbon years. Generally, MREs are cited as ΔR values, which are differences between measured R values and modeled R values (e.g. difference between IntCal13 and Marine13 calibration curves) for a particular region, based on calibration curves (e.g. Marine 13, Reimer et al. Reference Reimer, Bard, Bayliss, Beck, Blackwell, Bronk Ramsey, Buck, Cheng, Edwards, Friedrich, Grootes, Guilderson, Haflidason, Hajdas, Hatté, Heaton, Hoffmann, Hogg, Hughen, Kaiser, Kromer, Manning, Niu, Reimer, Richards, Scott, Southon, Staff, Turney and van der Plicht2013).
Corals loyally document the 14C of seawater dissolved inorganic carbon (DIC) (Druffel Reference Druffel1997; Grumet et al. Reference Grumet, Abram, Beck, Dunbar, Gagan, Guilderson, Hantoro and Suwargadi2004) and can be accurately dated by U-series (Yu et al. Reference Yu, Zhao, Shi, Chen, Wang, Collerson and Liu2006) or absolutely refined annual band, which provide the opportunity for evaluating ΔR. A series of studies have determined regional R and ΔR based on corals or known-age materials (Burr et al. Reference Burr, Beck, Corrège, Cabioch, Taylor and Donahue2009; Oliveira et al. Reference Oliveira, Carvalho, Macario, Evangelista, Lamounier and Hammerschlag2019; Yoneda et al. Reference Yoneda, Uno, Shibata, Suzuki, Kumamoto, Yoshida, Takenori, Atsushi and Hodaka2007). However, R and ΔR are seen to vary with time in coral records (Hua et al. Reference Hua, Webb, Zhao, Nothdurft, Lybolt, Price and Opdyke2015; Yu et al. Reference Yu, Quan, Zhao, Hodge, Fink and Barbetti2010) and model results (Butzin et al. Reference Butzin, Kohler and Lohmann2017). Hence R and ΔR are a function of time and location. Previous studies have revealed a tight connection between seawater 14C and climate from pre- and post-bomb corals (Grottoli et al. Reference Grottoli, Gille, Druffel and Dunbar2003; Hirabayashi et al. Reference Hirabayashi, Yokoyama, Suzuki, Miyairi, Aze, Siringan and Maeda2017). Nevertheless, the temporal relationship between regional ΔR and climate change for most regions remains unknown.
As the largest marginal sea in the Pacific, with abundant riverine sediments and a high sedimentation rate, the monsoon-dominated South China Sea (SCS) has been a focus of paleoclimate research (e.g. Shen et al. Reference Shen, Hu, Yan, Donson, Zhao, Li, Ding, Li, Wang and Xu2022; Wang et al. Reference Wang, Li and Tian2014). A precise ΔR for the SCS and its temporal variability are of importance for elucidating these paleoclimate records. Previous studies have suggested different ΔR values for the SCS. For instance, ΔR at Hòn Tre Island, Vietnam (Bolton et al. Reference Bolton, Goodkin, Druffel, Griffin and Murty2016), was estimated to be 18±29 14C years (relative to Marine 13, Reimer et al. Reference Reimer, Bard, Bayliss, Beck, Blackwell, Bronk Ramsey, Buck, Cheng, Edwards, Friedrich, Grootes, Guilderson, Haflidason, Hajdas, Hatté, Heaton, Hoffmann, Hogg, Hughen, Kaiser, Kromer, Manning, Niu, Reimer, Richards, Scott, Southon, Staff, Turney and van der Plicht2013), larger than the ΔR at Con Dao Island (Dang et al. Reference Dang, Mitsugchi, Kitagawa, Shibata and Kobayashi2004) of –74±39 14C years (relative to Marine 98, Stuiver et al. Reference Stuiver, Reimer and Braziunas1998) and the average ΔR (Southon et al. Reference Southon, Kashgarian, Metivier and Yim2002) of –25±20 14C years for the SCS (relative to Marine 98, Stuiver et al. Reference Stuiver, Reimer and Braziunas1998). Nevertheless, decadal ΔR variations related to climate have yet to be determined. Furthermore, the newly updated marine calibration curve (Marine20 curve) (Heaton et al. Reference Heaton, Köhler, Butzin, Bard, Reimer, Austin, Ramsey, Grootes, Hughen, Kromer, Reimer, Adkins, Burke, Cook, Olsen and Skinner2020), is almost 150 14C years older than that implied by the Marine13 (Reimer et al. Reference Reimer, Bard, Bayliss, Beck, Blackwell, Bronk Ramsey, Buck, Cheng, Edwards, Friedrich, Grootes, Guilderson, Haflidason, Hajdas, Hatté, Heaton, Hoffmann, Hogg, Hughen, Kaiser, Kromer, Manning, Niu, Reimer, Richards, Scott, Southon, Staff, Turney and van der Plicht2013) and previous marine curves. Hence, it is crucial to reconcile regional ΔR time series records to clarify the relationship between ΔR and climatic factors through time.
In this study, we present two coral radiocarbon records exceeding two decades from the east of Hainan Island and Xisha Island in the northern SCS. The relationship between regional ΔR and climatic factors (e.g. monsoon) in these corals were thoroughly examined and explored. Further, the newly average ΔR for the SCS base on the most recent marine radiocarbon Curve-Marine20 (Heaton et al. Reference Heaton, Köhler, Butzin, Bard, Reimer, Austin, Ramsey, Grootes, Hughen, Kromer, Reimer, Adkins, Burke, Cook, Olsen and Skinner2020) and its implication for paleoclimate research were specifically considered.
Materials and methods
Oceanographic setting of the SCS
As a semi-closed marginal sea, the SCS connects the surrounding sea through seven straits. The Luzon strait, contributes to the primary water exchange with the northwest Pacific Ocean (Qu et al. Reference Qu, Song and Yamagata2009), with a deep sill of 2400m (Qu et al. Reference Qu, Girton and Whitehead2006). In addition, two large rivers, the Pearl River and Mekong River, supply a large amount of sediments into the north SCS and west SCS, with annual runoffs of 3.3 and 4.7×10¹¹ m3, respectively (Mckee et al. Reference McKee, Aller, Allison, Bianchi and Kineke2004). The surface circulation in the SCS seasonally shifts due to the reversing monsoon winds, with clockwise flows in summer and anti-clockwise flows in winter (Hu et al. Reference Hu, Kawamura, Hong and Qi2000). Moreover, the summer monsoon influences coastal upwelling prevails around east of Hainan, off Vietnam and off Guangdong province, while the prevalent coastal upwelling west of Luzon is in winter under the effect of winter monsoon (Wu and Li Reference Wu and Li2003; Hu and Wang Reference Hu and Wang2016).
The summer sea surface temperature (SST) in the SCS is roughly homogeneous above 28°C. In contrast, the winter SST displays conspicuous ascent from north to south (Figure 1 a–d). These seasonal differences in SST distribution patterns are mainly induced by seasonal reversing monsoon including the East Asian Winter Monsoon (EAWM) and the Southern Asian Summer Monsoon (SASM) (Liu et al. Reference Liu, Jiang, Xie and Liu2004). In this study, the two sample sites (shown in Figure 1 a and b) share distinct oceanography. At east of Hainan Island, prevailing in summer, the prominent upwelling dominant the regional circulation, which is mainly influenced by the SASM (Hu and Wang Reference Hu and Wang2016; Jing et al. Reference Jing, Qi, Hua and Zhang2009). During summer, shallow regional mixed layer depth is observed (Figure 1 e) (Zeng et al. Reference Zeng, Wang, Chen, Wang and Chen2016), which favors upwelling of aged 14C to the surface. In contrast, at Xisha Island, an open ocean site, no seasonal upwelling is observed (deep mixed layer depth, Figure 1 f). The annual average wind speed is larger in Xisha Island than in Hainan Island, especially in winter (Figure 1 g and h). Besides, runoff from the Wanquan River and Wenjiao River at Hianan Island accounts for more than 6×10⁹ m3 yr-1 (Zhang et al. Reference Zhang, Wang, Jennerjahn and Dsikowitzky2013), while negligible runoff occurs at the Xisha Island.

Figure 1. Map and hydroclimate parameters of sampling site. (a) winter (December-January-February) and (b) summer (June-July-August) mean 850 hPa stream line from the ERA-Interim (https://climatedataguide.ucar.edu/climate-data/era-interim-derived-components), the red and black dots represent the sampling sites of coral core 15WC23 and 15XS28 from east of Hainan Island and Xisha Island, respectively. (c) Monthly mean sea surface temperature (SST), precipitation and (g) wind speed at east of Hainan Island (centered at 19°N, 110°E within 2° × 2° grid) from NCEP Reanalysis Dataset (https://psl.noaa.gov/cgi-bin/data/timeseries/timeseries1.pl). (d) Monthly mean sea surface temperature (SST), precipitation and (h) wind speed at Xisha Island (centered at 17°N, 112°E within 2° × 2° grid) from NCEP Reanalysis Dataset. All the monthly mean data are ranged from 1948 to 2021. (e) and (f) Monthly mean mixed layer (MLD) depth from SCSPOD14 (Zeng et al. Reference Zeng, Wang, Chen, Wang and Chen2016) ranging from 1971 to 2015 at east of Hainan Island (centered at 19.5°N, 111°E within 0.5° × 0.5° grid) and Xisha Island (centered at 17°N, 112.5°E within 0.5° × 0.5° grid), respectively.
Sampling
In 2015, two coral cores were obtained from living massive Porites lutea colonies from the northern SCS. The coral core 15WC23 (19.39°N, 110.76°E) was collected at a water depth of 5 m, from a fringing reef, off the east coast of Hainan Island (Figure 1 a and b, red dot). The other coral core 15XS28 (16.96°N, 112.25°E) was collected at a water depth of 4 m from Qilianyu Reef in the Xisha Islands (Figure 1 a and b, black dot). The chronology of the coral cores was well established by the annual density bands revealed by X-ray photograph (Figure S1, see Supplementary), with a growth period from 1900 to 2015 for 15WC23 (Chen et al. Reference Chen, Deng, Kang, Zeng, Zhang, Zhao and Wei2021) and from 1930 to 2015 for 15XS28 (Kang et al. Reference Kang, Chen, Deng, Wang, Cui, Liu, Cai, Zeng, Zhao and Wei2021). The powder samples were carefully milled along the main growth axis by a digitally controlled milling machine (Deng et al. Reference Deng, Wei, Xie, Ke, Wang, Zeng and Liu2013). Limited by sample size, coral 15WC23 and 15XS28 were sampled with biennial and annual resolution, respectively.
Radiocarbon dating
All pre-1950 powder samples (45 samples in total) were employed for radiocarbon analysis. For each sample, about five to seven milligrams of coral powder were reacted with 85% phosphoric acid in a Y-shaped vessel under vacuum of less than 1×10⁻¹ torr. After complete reaction, the CO2 gas was purified in a vacuum line and reduced to graphite using a zinc reduction method (Slota et al. Reference Slota, Jull, Linick and Toolin1987). Graphite samples were then measured for 14C analysis at the Xi’an Accelerator Mass Spectrometry (AMS) center (Zhou et al. Reference Zhou, Zhao, Lu, Liu, Wu, Cheng, Zhao and Huang2016).
Result
The radiocarbon result (Table 1) of 45 coral samples is presented in Figure 2, expressed as ΔR. The ΔR data from east Hainan Island from 1900 to 1949 are cited with biennial resolution, while the Xisha Island results from 1930 to 1949 are cited with annual resolution. Recalculated previous-published average ΔR values from different sites around the SCS are summarized in Table 2, consisting of 725 ΔR values from eighteen sites. The R, ΔR and the associated Δ14C are calculated by the following equations (Stuiver et al. Reference Stuiver, Pearson and Braziunas1986; Stuiver and Polach Reference Stuiver and Polach1977):
 $${\rm{Measured\ R}}\left( {\rm{t}} \right) = {\rm{Measure}}{{\rm{d}}\ ^{14}}{\rm{C\ age}}\left( {\rm{t}} \right)-{\rm{Terrestrial}}\ {^{14}}{\rm{C\ age}}\left( {\rm{t}} \right)$$
 $$\Delta {\rm{R}}\left( {\rm{t}} \right) = {\rm{Measured\ R}}\left( {\rm{t}} \right)-{\rm{modeled\ R}}\left( {\rm{t}} \right)$$
 $${\rm{Modeled\ R}}\left( {\rm{t}} \right) = {\rm{Modeled\ marin}}{{\rm{e}}\ ^{14}}{\rm{C\ age}}\left( {\rm{t}} \right)-{\rm{Terrestria}}{{\rm{l}}\ ^{14}}{\rm{C age}}\left( {\rm{t}} \right)$$
 $${\rm{Measure}}{{\rm{d}}\ ^{14}}{\rm{C\ age}}\left( {\rm{t}} \right) = -8033{\rm{ }} \times {\rm{ln}}\left( {{F}} \right)$$
 $${\Delta ^{14}}{\rm{C}} = {{F}}{{{e}}^{\lambda \left( {1950 - t} \right){\rm{ }} - 1}} \times 1000{\unicode{x2030}}$$
Table 1. ΔR result from east of Hainan Island and Xisha Island


Figure 2. The ΔR result from east of Hainan Island (15WC23, blue dotted line) and Xisha Island (15XS28, green dotted line).
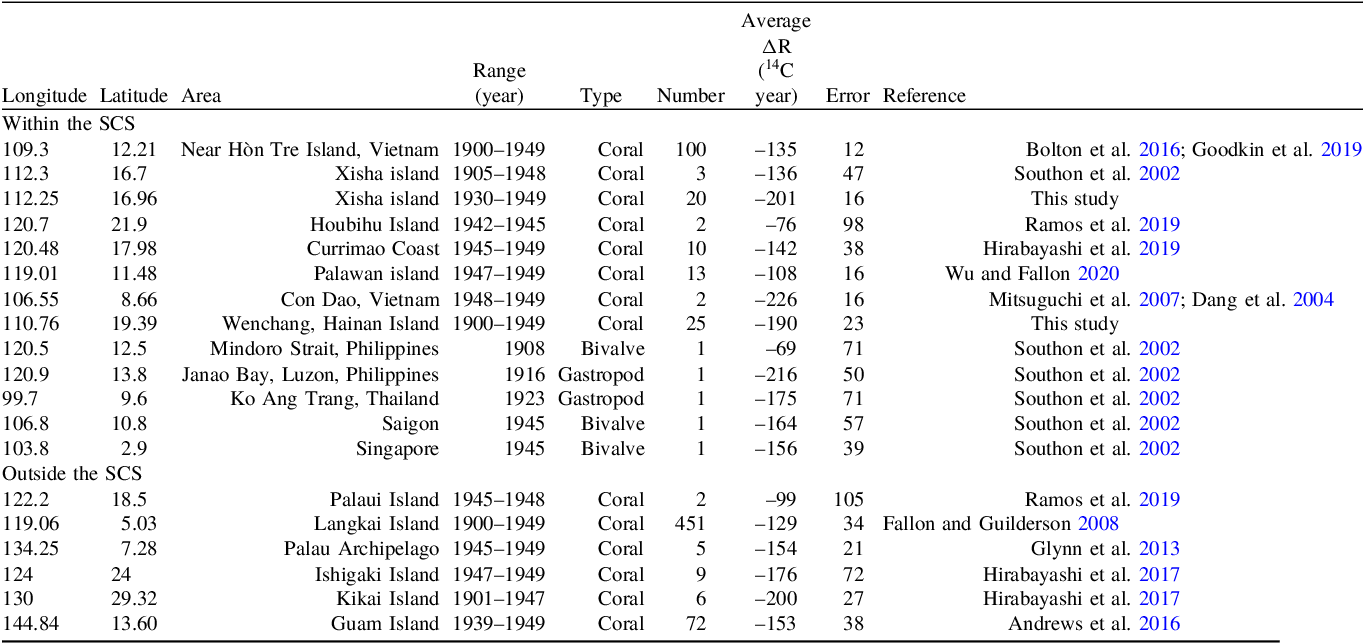
Table 2. The detailed information of collected and recalculated ΔR data around the SCS
Where t is the true living age of the sample in cal BP (based on the counted annual density band), F represents the fraction of Modern carbon, λ=1/8267 yr–1 is the radiocarbon decay constant associated with a 5730-yr half-life, and t is the calendar age of the sample (Stuiver and Polach Reference Stuiver and Polach1977). The terrestrial and modeled 14C age were obtained from Intcal20 Curve and Marine20 Curve, respectively.
ΔR results from Hainan Island and Xisha Island
As shown in Figure 2, 25 ΔR results from east of Hainan Island (blue dotted line) fluctuate from –229±14 to –131±14 14C years (average value –190±23 14C years) from 1900 to 1949. Additionally, 20 ΔR data from Xisha Island (green dotted line) range from –230±17 to –150±18 14C years (average value –201±16 14C years) from 1930 to 1949. Generally, our sites have more negative average ΔR values than other SCS sites (Table 2, published ΔR values were all recalculated using Marine20), except for Con Dao Island, Vietnam (–226±18 14C years) (Dang et al. Reference Dang, Mitsugchi, Kitagawa, Shibata and Kobayashi2004; Mitsuguchi et al. Reference Mitsuguchi, Dang, Kitagawa, Yoneda and Shibata2007) and Janao Bay, Philipines (–216±50 14C years) (Southon et al. Reference Southon, Kashgarian, Metivier and Yim2002). Additionally, the average Hainan Island ΔR value is lower than that off Hòn Tre Island, Vietnam (–135±12 14C years) (Bolton et al. Reference Bolton, Goodkin, Druffel, Griffin and Murty2016; Goodkin et al. Reference Goodkin, Bolton, Hughen, Karnauskas, Griffin, Phan, Vo, Ong and Druffel2019), although upwelling occurs at both sites.
Averaged ΔR for the SCS
As summarized in Table 2, overall 725 ΔR values from 18 sites were compiled to recalculate the regional ΔR around the SCS ranging from 1900 to 1950. The majority of ΔR values were obtained from the coral skeletons. Twelve sites and 130 ΔR values in total were included within the SCS. The updated SCS ΔR values varied from –61±14 14C years to –241±40 14C years, with the maximum ΔR value from Houbihu, Nanwan Bay, Taiwan, and the minimum ΔR from Con Dao Island, Vietnam. The average SCS ΔR is –161±39 14C years. Note that the average value and error were calculated by the formulas from http://calib.org/marine/AverageDeltaR.html.
Discussion
ΔR is mainly regulated by the regional upwelling, freshwater input, and the circulation (Stuiver and Ostlund Reference Stuiver and Ostlund1983). Normally, areas with notable upwelling have high ΔR values, and areas with more freshwater have relatively low ΔR values. The effect of surface circulation on ΔR depends on the Δ14C value upstream of the site. Besides, the decreasing atmospheric Δ14C (Suess effect, Suess Reference Suess1955) since the industrial revolution probably influence our ΔR calculation. However, given the ambiguous trend of ΔR at the Hainan Island and long equilibration times (∼10 yr) between atmosphere and ocean (Bolton et al. Reference Bolton, Goodkin, Druffel, Griffin and Murty2016), we believed negligible impact of the Suess effect on our coral Δ14C. Moreover, the Suess effect was ignored at Marine20 calibrated curve (Heaton et al. Reference Heaton, Köhler, Butzin, Bard, Reimer, Austin, Ramsey, Grootes, Hughen, Kromer, Reimer, Adkins, Burke, Cook, Olsen and Skinner2020), by its nonsignificant statistics. Therefore, we neglected potential influence from the Suess effect. As mentioned above, the ΔR difference between Xisha Island and Hainan Island reflects their different oceanographic setting (Hainan Island is a coastal site and Xisha is an open ocean site). Thereby the difference in sampling resolution would exert negligible effect on our ΔR variability. Considering the seasonal climate-dominant circulation in the SCS (Hu et al. Reference Hu, Kawamura, Hong and Qi2000), we compare indicators of regional climate and corresponding ΔR values to explore possible linkages.
Monsoon rainfall influenced regional ΔR off east Hainan Island
As demonstrated by SST (Wu and Li Reference Wu and Li2003), nutrient (Hu et al. Reference Hu, Chen, Huang and Zhou2021), climatological Advanced Very High-Resolution Radiometer SST image and numerical model (Jing et al. Reference Jing, Qi, Hua and Zhang2009), wind-induced coastal upwelling at east of Hainan Island has been thoroughly investigated. Thus, ΔR values here are probably controlled by regional upwelling. However, the ΔR from Hainan Island showed poor correlation (Figure 3b, r=0.3, p=0.12) with reconstructed intensity of regional upwelling based on the summer sea surface temperature anomaly from a 121-yr coral record (Liu et al. Reference Liu, Peng, Shen, Zhou, Song, Shi, Chen, Wei and DeLong2013). In addition, despite our ΔR values displayed consistent variations with the Indian rainfall anomaly (viewed as intensity of SASM, Singh et al. Reference Singh, Ghosh, Roxy and McDermid2019) in part, insignificant correlation (Figure 3c, r<0.2, p>0.5) between them did not support the dominant influence from SASM on ΔR off Hainan Island. Therefore, we excludeded the SASM induced wind as a driver for influencing ΔR off Hainan Island.

Figure 3. Comparison of ΔR from Hainan Island with regional climate. (a) comparison of ΔR (black dotted line) with Δδ18 O (orange line) from Hainan Island corals (Deng et al. Reference Deng, Liu, Chen, Wei, Zeng, Xie and Zhao2017). (b) comparison of ΔR (black dotted line) with SST anomaly (SSTA, blue line) from Hainan Island corals (Liu et al. Reference Liu, Peng, Shen, Zhou, Song, Shi, Chen, Wei and DeLong2013). (c) comparison of ΔR (black dotted line) with Indian monsoon index (purple line) derived from Indian rainfall anomaly (Singh et al. Reference Singh, Ghosh, Roxy and McDermid2019). (d) comparison of ΔR (red dotted line) off Hòn Tre Island, Vietnam (Bolton et al. Reference Bolton, Goodkin, Druffel, Griffin and Murty2016) with ΔR (black dotted line) at east Hainan Island.
Significantly, reconstructed regional SASM precipitation index (Δδ18O) from Hainan Island correlated well (r=0.45, p<0.05) with our ΔR (Figure 3 a, Deng et al. Reference Deng, Liu, Chen, Wei, Zeng, Xie and Zhao2017), which probably indicated that monsoon rainfall dominated regional ΔR. The minor difference between average ΔR value in Xisha Island (–201±16 14C years) and Hainan Island (–190±23 14C years) suggested the underlying effect of runoff/rainfall from Hainan Island, considering that aged seawater vigorously upwelled off Hainan Island. The influence from freshwater, lowering the ΔR values, likely explained the lower average ΔR values than the average ΔR off the coastal site at Hòn Tre Island, Vietnam (Bolton et al. Reference Bolton, Goodkin, Druffel, Griffin and Murty2016), areas with distinct upwelling activity (Figure 3 d). Furthermore, previous research indicated that both the river plume and coastal upwelling contributed to the carbonate system at east of Hainan according to observation data from 2014 to 2015 (Dong et al. Reference Dong, Huang, Zheng, Pan, Wang, Huo, Zhou, Lin and Ji2017). Lin et al. (Reference Lin, Hu, Zheng, Sun and Zhu2016) suggested that freshwater impacted the northeastern coast of Hainan Island more than the eastern coast of Hainan Island, based on cruise observations and reanalysis data from 2009. Therefore, we proposed that runoff/rainfall dominated the ΔR values off Hainan Island. Further, as part of SASM, wind and precipitation from SASM both have an impact on Hainan Island, the former dominates the upwelling off Hainan Island (Hu and Wang Reference Hu and Wang2016; Li et al. Reference Li, Peng, Yang and Wang2012), while the latter regulates the regional ΔR.
As mentioned above, upwelling off Hainan Island held less contribution to variable ΔR, despite the seawater ages still older than the atmospheric. To quantify how the freshwater input contributed to ΔR off Hainan Island, a two end-members model was used as follows.
For convenience, all measured F value were employed for the model. We supposed the F value of the freshwater runoff was determined from atmospheric F value of the same year. The F value of the upwelled deepwater was equated with the F value of off Hòn Tre Island, Vietnam (Bolton et al. Reference Bolton, Goodkin, Druffel, Griffin and Murty2016), considering its characteristics with significant upwelling activity. The contribution of the two end-members were computed using Equations (6–7):
 $${{\rm{f}}_{\rm{r}}} + {\rm{ }}{{\rm{f}}_{\rm{w}}} = 1$$
 $${{\rm{F}}_{\rm{r}}}{{\rm{f}}_{\rm{r}}} + {{\rm{F}}_{\rm{w}}}{{\rm{f}}_{\rm{w}}} = {{\rm{F}}_{{\rm{obs}}}}$$
where f indicates the fractions of runoff or freshwater (fr), upwelled deepwater (fw). Fr, Fw, and Fobs denote the F value of the runoff, the deepwater, and the measured F value east of Hainan Island, respectively. Given the negligible difference of DIC between runoff (1805 mol kg–1) and the offshore seawater (1937 mol kg–1, observational data from 2014) (Dong et al. Reference Dong, Huang, Zheng, Pan, Wang, Huo, Zhou, Lin and Ji2017), fr and fw are assumed to represent the runoff and deepwater fractions.
The two end-members model results revealed that the fr varied from 0% to 19.2%, with an average of 11.4%. The calculated runoff proportion correlated well (r=-0.53, p<0.01) with the local precipitation reconstructed from the coral (Figure S2, see Supplementary) (Deng et al. Reference Deng, Liu, Chen, Wei, Zeng, Xie and Zhao2017). This correlation reinforced our two end-members model, despite previous study suggested nearly 50% runoff contribution, as observed from measured pH value (Dong et al. Reference Dong, Huang, Zheng, Pan, Wang, Huo, Zhou, Lin and Ji2017). Hence, ΔR off Hainan Island was mainly dominated by the SASM induced precipitation rather than wind, namely the upwelling activity.
EAWM influenced regional ΔR in Xisha Island
Different from Hainan Island, the oceanographic setting around Xisha Island is not dominated by upwelling. Due to negligible runoff, freshwater input is expected to exert a minor impact on seawater Δ14C. Hence, ΔR values at Xisha Island were dominated by the regional circulation. Lacking observational data, we correlated the Xisha Island ΔR with the reconstructed SST (Sun et al. Reference Sun, Sun, Wei, Lee, Nie and Yu2004), precipitation (Han et al. Reference Han, Yu, Yan, Yan, Tao, Zhang, Wang and Chen2019), and wind speed (intensity of EAWM, Song et al. Reference Song, Peng, Zhou, Liu, Liu and Chen2012) from Xisha Island corals (Figure 4 a–c). We observed a negative correlation between EAWM and ΔR (with one year lag, r=−0.37, p<0.1), and an insignificant relationship between ΔR and reconstructed SST (r<0.1, p>0.5) and precipitation (r=−0.15, p>0.5). Similarly, the SASM displayed a negligible correlation (r<0.1, p>0.5) with the ΔR. Therefore, the ΔR in Xisha Island was mainly modulated by the EAWM, the same as the surface circulation in winter.

Figure 4. Comparison of ΔR from Xisha Island with regional climate. (a) comparison of ΔR (black dotted line) in Xisha Island with reconstructed SST (red line) from coral in Xisha Island (Sun et al. Reference Sun, Sun, Wei, Lee, Nie and Yu2004). (b) comparison of ΔR (black dotted line) with Δδ18O (orange line) from coral at Yongxing Island (Han et al. Reference Han, Yu, Yan, Yan, Tao, Zhang, Wang and Chen2019). (c) comparison of ΔR (black dotted line) with reconstructed winter wind velocity anomaly (blue line) from coral in Xisha Island (Song et al. Reference Song, Peng, Zhou, Liu, Liu and Chen2012). Note that ΔR lagged the wind velocity anomaly by one year.
However, given the Ekman transport, the stronger the wind, the more overturning of the deep water, thus the more negative seawater DIC Δ14C and higher ΔR values (Druffel and Griffin Reference Druffel and Griffin1993; Grumet et al. Reference Grumet, Abram, Beck, Dunbar, Gagan, Guilderson, Hantoro and Suwargadi2004). The abnormal negative correlation here probably reflects horizontal water mass movement. Not unique, a seasonal Δ14C signal from 1968 to 1995, in Currimao, the Philippines, was found to be positively correlated with winter wind speed, implying horizontal transport from the Luzon Strait (Hirabayashi et al. Reference Hirabayashi, Yokoyama, Suzuki, Miyairi, Aze, Siringan and Maeda2017). Moreover, the winter Δ14C variations from coral at Houbihu (Ramos et al. Reference Ramos, Goodkin, Druffel, Fan and Siringan2019) in the 1970s displayed a distinct positive correlation between Δ14C and EAWM. Despite post-bomb rather than pre-bomb relationship between coral Δ14C and EAWM was revealed, the positive correlation between coral Δ14C and EAWM did support the horizontal transport of sea water from the Luzon Strait. This horizontal transport of sea water was consistent with our proposal mentioned above. Furthermore, from the Luzon Strait to the Xisha Island, the ΔR should gradually decrease as a result of keeping exchanging between the seawater and air, as can be seen the ΔR values along the path from the Palaui island (–99±105 14C years) (Ramos et al. Reference Ramos, Goodkin, Druffel, Fan and Siringan2019) to Currimao (–142±38 14C years) (Hirabayashi et al. Reference Hirabayashi, Yokoyama, Suzuki, Esat, Miyairi, Aze, Siringan and Maeda2019), and Xisha Island (–201±16 14C years). Consequently, the strong EAWM would facilitate the transport of surface water from Luzon Strait to Xisha Island, leading to a distinct negative correlation with the ΔR. Likewise, in spite of the long time, the one-year lag of ΔR probably represents the transporting time.
Implication for paleoclimate
As shown in Figure 5, the average ΔR inside the SCS (–161±39 14C years) is similar to the ΔR on Guam Island (–153±38 14C years) (Andrews et al. Reference Andrews, Asami, Iryu, Kobayashi and Camacho2016) and Palau Island (–154±21 14C years) (Glynn et al. Reference Glynn, Druffel, Griffin, Dunbar, Osborne and Sanchez-Cabeza2013). This similarity implies that the water in the SCS originated from the western Pacific (Qu et al. Reference Qu, Song and Yamagata2009), despite that the Kuroshio Current (KC) furnished the SCS to a large extent and the ΔR along the KC path progressively decreased (Nan et al. Reference Nan, Xue and Yu2015; Yoneda et al. Reference Yoneda, Uno, Shibata, Suzuki, Kumamoto, Yoshida, Takenori, Atsushi and Hodaka2007). Nevertheless, the ΔR inside the SCS is not uniform. The distribution of regional average ΔR was nearly paralleled with the circulation. From the Luzon Strait to the south SCS, the gradually decreased ΔR probably indicated that the seawater kept exchanging with the air along the current path. In addition, the upwelling area held the larger ΔR due to the upwelled depleted Δ14C water, like the Hon Tre Island (Bolton et al. Reference Bolton, Goodkin, Druffel, Griffin and Murty2016). In contrast, supplied by plentiful runoff, the ΔR values from estuary was extremely low, like the minimum ΔR in Con Dao Island (Dang et al. Reference Dang, Mitsugchi, Kitagawa, Shibata and Kobayashi2004). Additionally, near the Luzon Strait, the regional ΔR ranged from –76±98 to –99±105 14C years, higher than the ΔR from other sites. Considering the regional bedrock (without limestone) and the special deep circulation across the Luzon Strait, the higher ΔR may be contributed to the overturned deepwater in the Bashi Strait (Qu et al. Reference Qu, Girton and Whitehead2006). Moreover, there seems homogeneous ΔR in the south SCS and northwest SCS, with ΔR of nearly –161±9 14C years (average of ΔR in Singapore, Saigon and Ko Ang Trang in Thailand) and –194±22 14C years (average of ΔR in Xisha and Hainan Island), respectively. In summary, the average ΔR of –161±39 14C years in the SCS was similar to ΔR in the western Pacific. The northwest SCS and estuarine area (such as the Mekong River estuary) were characterized with low ΔR, the Luzon Strait area and the upwelling zone processed high ΔR.

Figure 5. The distribution of ΔR around the SCS. The ΔR was based on Marine 20 Curve, expressed as regional average ΔR with errors (black symbol). Information of the sites (blue dot) is given in Table 2. The average ΔR for Xisha Island of –200±19 14C years shown in this figure was calculated using data from this study and from Southon et al. (Reference Southon, Kashgarian, Metivier and Yim2002). The red circles denote the coastal upwelling area (Hu and Wang Reference Hu and Wang2016). The thick gray line represents circulation outside the SCS, while the thin gray solid and dashed line represents winter and summer circulation inside the SCS, respectively (Fang et al. Reference Fang, Fang, Fang and Wang1998). NEC = North Equatorial Current, KC = Kuroshio Current, MC = Mindoro Current.
Previous studies indicated that the El Niño Southern Oscillation (ENSO) and the East Asian summer monsoon affected the SCS ΔR values through time, using paired 14C and U-Th dates on pristine corals from the past 8000 years (Hua et al. Reference Hua, Ulm, Yu, Clark, Nothdurft, Leonard, Pandolfi, Jacobsen and Zhao2020; Yu et al. Reference Yu, Quan, Zhao, Hodge, Fink and Barbetti2010). However, in spite of the short duration of our ΔR time series data, our results indicated that the monsoon (like SASM and EAWM) mainly modulated the ΔR in the north SCS. Normally, large-scale ΔR variability will be dominated by ocean circulation (Stuiver and Ostlund Reference Stuiver and Ostlund1983), with minor effect near estuarine area. These tight relations have been verified from coral Δ14C (Druffel et al. Reference Druffel, Griffin, Glynn, Dunbar, Mucciarone and Toggweiler2014; Fallon and Guilderson Reference Fallon and Guilderson2008; Rafter et al. Reference Rafter, Sanchez, Ferguson, Carriquiry, Druffel, Villaescusa and Southon2017). In addition, based on the interannual coral Δ14C records from the Luzon Strait, Ramos et al. (Reference Ramos, Goodkin, Druffel, Fan and Siringan2019) highlighted that the monsoon primarily control inside the SCS, while ENSO dominated outside the SCS. Therefore, given the negative correlation between ΔR from Xisha Island and EAWM, the glacial SCS ΔR was probably lower than interglacial period, rather than expected from previous studies (Siani et al. Reference Siani, Paterne, Michel, Sulpizio, Sbrana, Arnold and Haddad2001).
Conclusion
Here two corals from the north SCS were studied to reveal temporal ΔR variation and its relationship to climate change. The coral ΔR at east of Hainan Island was modulated by the Southern Asian Summer Monsoon (SASM), which affected the regional runoff, rather than wind induced upwelling. The freshwater from runoff contributed average 11.4% based on the two end-members model. Different from Hainan Island, the coral ΔR at Xisha Island was mainly regulated by the East Asian Winter Monsoon (EAWM), which blew the surface water to Xisha Island along the circulation. Hence the stronger the wind, the lower the ΔR at Xisha Island, especially during glacial, when the EAWM became stronger. The average ΔR in the SCS was –161±39 14C years, by compiling the radiocarbon data from 1900 to 1950, based on the new calibration curve, Marine20. In spite the limited data, our result from Xisha Island and Hainan Island together implied that the ΔR was mainly regulated by the monsoon. The newly average ΔR for the SCS would contribute to paleoclimate research in the SCS. Further research is needed for the long-term and seasonal ΔR variety.
Supplementary material
To view supplementary material for this article, please visit https://doi.org/10.1017/RDC.2024.118.
Acknowledgments
This research was supported by the Strategic Priority Research Program of Academy of Sciences (grant No. XDB40000000), the Natural Science Foundation of China (No. 41991252, No. 41706071), the Youth Innovation Promotion Association (No. 2019401). The authors thank great help for this work by the State Key Laboratory of Loess and Quaternary Geology, Institute of Earth Environment, Chinese Academy of Sciences, the Pilot National Laboratory for Marine Science and Technology (Qingdao), and the Ministry of Science and Technology of China. The authors would also like to thank Prof. George Burr for linguistic assistance and Dr. Xuefei Chen for coral sampling.
Declaration of competing interests
The authors declare that they have no known competing financial interests or personal relationships that could have appeared to influence the work reported in this paper.


