INTRODUCTION
The first influenza pandemic for 40 years emerged in Mexico towards the end of that country's winter in March 2009 [Reference Echevarría-Zuno1, Reference Chowell2]. Within weeks the disease had spread to parts of the USA and Canada [Reference Jain3, 4]. After that, it entered the UK and other parts of Europe [5, 6]. By the end of 2009, some countries in the Northern Hemisphere had experienced two waves of pandemic H1N1 (2009) influenza. The pattern in the Southern Hemisphere was more variable, with most countries having an initial wave coinciding with the regular influenza season [Reference Baker, Kelly and Wilson7].
Experience from around the world has informed the initial public health response. Conditions conferring increased risk of severe illness have been identified. These are broadly similar to those for seasonal influenza. However, the pandemic virus has produced a marked age shift in morbidity and mortality towards the young [Reference Echevarría-Zuno1, Reference Jain3, Reference Baker, Kelly and Wilson7]. Additionally, up to 20% of hospitalized patients have been treated in critical care [Reference Jain3, Reference Baker, Kelly and Wilson7]. The availability of high-quality critical care facilities may have contributed to the relatively low mortality in many developed countries. Other modern treatments including antiviral medication and extra-corporeal membrane oxygenation therapy may have reduced mortality further.
Over 1 year on, it is important to take a comprehensive look at the experience of this pandemic. In the coming influenza seasons the pandemic strain may dominate, as has happened after previous pandemics, displacing previous circulating strains of influenza virus. Future influenza seasons may therefore be characterized by a higher death rate in the young relative to the death rate in the elderly compared with the pre-pandemic years [Reference Simonsen8].
The mortality documented from this pandemic has been relatively low, with no excess mortality signal in the UK [9]. Despite this the risk of future pandemics remains. The data from this pandemic are far richer than before and should be used to prepare for future pandemics.
In an earlier paper, we reported on deaths related to pandemic H1N1 (2009) influenza in England during the first wave of the pandemic in the summer of 2009 [Reference Donaldson10]. We found a low case-fatality rate (CFR), a shift in mortality towards the young, and an increased risk of death for those with pre-existing conditions. Here we provide a fuller description of the groups who died, and compare mortality between the initial and subsequent waves, placing this in the context of England's response to the pandemic.
METHODS
We established a system to identify all deaths in England suspected of being related to pandemic (H1N1) 2009 influenza during the period when the virus was circulating and causing illness. The full methods have been described in more detail elsewhere [9]. Initial death reports were based either on clinical suspicion or confirmed laboratory diagnosis. From 7 July 2009, all hospitals in England were asked to report deaths occurring in hospital directly to the Department of Health, which has responsibility for the National Health Service (NHS). On 14 August 2009, a separate system was established for reporting deaths outside hospital. Deaths prior to these dates were sought by the same routes. These records were cross-checked with data held by the Health Protection Agency's (HPA) ’flu reference centres and through records held by public health leads in the ten regions of England.
All reports of suspected pandemic (H1N1) 2009 influenza deaths were reviewed by physicians working for the Chief Medical Officer for England, in the Department of Health. This clinical team made direct contact with the responsible senior physician in the organization that had reported each death, to determine whether it was related to pandemic (H1N1) 2009 influenza. A death was defined as related to pandemic (H1N1) 2009 influenza if it or a synonym was recorded on any part of a patient's death certificate, and/or the patient had a positive laboratory test for pandemic (H1N1) 2009 influenza, either before or after death.
Once the death was validated according to these criteria, a standard set of information was gathered from the responsible senior physician. This included: demographic characteristics (age, gender), pre-existing medical conditions, time-course of the illness (date of symptom onset, admission to hospital, first antiviral use, admission to intensive care unit and death), and results for laboratory testing of pandemic (H1N1) 2009 influenza. Physicians were asked to rate the patient's general health, before the acute illness, using the American Society of Anesthesiologists (ASA) scale [Reference Saklad11]. On this scale individuals are classified as being healthy (ASA grade 1) or having mild (ASA grade 2), moderate (ASA grade 3) or severe (ASA grades 4 or 5) pre-existing systemic disease.
This exercise was undertaken under the Health Service (Control of Patient Information) Regulations SI1438/2002, which provides a lawful basis for collecting and processing data without patient consent for the purposes of communicable disease control in England. As such no explicit ethical approval was necessary or sought. High standards of confidentiality were maintained when handling patient data.
Denominators
The HPA generated weekly estimates of the number of cases of pandemic (H1N1) 2009 influenza in England by age throughout the pandemic up to 28 March 2010 [9]. These estimates were based on the number of people consulting primary-care services (both general practitioners and a national telephone/internet advice service), the proportion of these people who had a laboratory positive test, and an estimate of the ratio of symptomatic individuals in the community who consult primary-care services. The generated figure provides an estimate of the number of symptomatic patients in the whole community. Official estimates of the English mid-2008 population, by age, were obtained from the Office for National Statistics [12].
To better demonstrate the risk of death associated with particular pre-existing conditions, we obtained estimates of the numbers of people aged ⩾6 months in England with risk factors for seasonal influenza. These estimates were extrapolated from the Department of Health seasonal influenza vaccine uptake monitoring system [Reference Gates13]. This system extracts information from electronic records held in primary care to estimate the number of patients falling into different risk groups for seasonal influenza in 11 distinct age groups [14].
Statistical analysis
CFRs were calculated for each age group using the mid-point of the HPA case estimates. This method of calculating CFRs has been used previously [9, Reference Pebody15]. A sensitivity analysis around the estimate of case fatality was undertaken. The upper and lower estimates for the cumulative number of cases by age were used to estimate a lower and upper CFR, respectively. A 95% exact confidence interval (CI) was then calculated around these estimates [Reference Clopper and Pearson16]. The presented range is from the lower 95% CI of the lower case-fatality estimate to the upper 95% CI of the upper estimate.
Mortality rates (number of deaths per million population) were calculated for each seasonal influenza risk group, directly standardized to the England mid-2008 population. The stratified χ2 test of association was used to calculate an overall P value for the relative risk across all age strata. Direct standardization is less statistically efficient compared to the stratified χ2 test of association, and so gives relatively large confidence intervals. Direct standardization was chosen to allow comparison between different risk groups, and because it does not assume a uniform risk across different age strata.
Descriptions of which conditions are included within each risk group are circulated to the NHS annually, in order to identify patients for seasonal influenza vaccination [Reference Gates13]. Deaths occurring in individuals with these specified pre-existing conditions were allocated to risk groups. An individual could fall into more than one risk group if they had more than one condition.
A comparison of key characteristics of the two waves was made. The end of the first wave was defined by the nadir of estimated cases between the two waves. The first wave lasted from 1 June 2009 to 30 August 2009, a period of 13 weeks. The second wave lasted from 31 August 2009 to 28 March 2010, a period of 30 weeks. Deaths were assigned to a wave based on date of symptom onset. When no date of symptom onset was available the earlier of two dates was used: either the date of hospital admission or the estimated date of symptom onset (date of death minus median time from symptom onset to death).
RESULTS
By 18 April 2010 reports of 508 deaths suspected to be due to pandemic (H1N1) 2009 influenza in England had been received. In all, 361 met the case definition as being related to pandemic (H1N1) 2009 influenza (264 laboratory-confirmed and on death certificate, 89 laboratory-confirmed only, 8 on death certificate only). This equates to a population mortality rate of 7·0 (95% CI 6·3–7·8) deaths per million population. The remaining reports were duplicates (n=28), resident outside England (n=5), did not meet the case definition (n=112), or were awaiting the outcome of a coroner's investigation (n=2). All of those who died became symptomatically infected before 28 March 2010.
Descriptive statistics of deaths
More men than women died (195 and 166 deaths, respectively), although the population mortality rates did not differ significantly between the sexes (males 7·7 deaths per million, females 6·4 deaths per million; Pearson χ2=3·3, d.f.=1, P=0·07). The median age of death was 44 years [inter-quartile range (IQR) 26–60]. Over one-third of those who died were either healthy (18%, 65/361) or had mild pre-existing systemic disease (18%, 66/361). The remaining two thirds had either severe (39%, 141/361) or incapacitating (25%, 89/361) pre-existing systemic illness. Those who died had a median of two pre-existing medical conditions (IQR 1–3). Most deaths occurred in hospital (91%, 328/361). Of these, the majority had been treated in critical care (82%, 268/328). The remaining 33 deaths occurred in the community.
CFRs
There were an estimated 784 000 cases of pandemic (H1N1) 2009 influenza in England, giving an overall CFR of 0·046% (range 0·019–0·11). Three age groups had markedly higher CFRs (<1 year, 45–64 years, ⩾65 years; Table 1). In particular, those aged ⩾65 years had an eightfold greater CFR than any other age group.
Table 1. The case-fatality rate from pandemic (H1N1) 2009 influenza in England by age in the two waves

M, Male; F, female; P values based on χ2 test with Yates’ continuity correction; comparing wave 1 and wave 2.
* The presented range is from the lower 95% confidence interval of the lower case-fatality estimate, using the upper estimate of the number of cases, to the upper 95% confidence interval of the upper estimate, using the lower estimate of the number of cases.
Comparison of wave 1 with wave 2
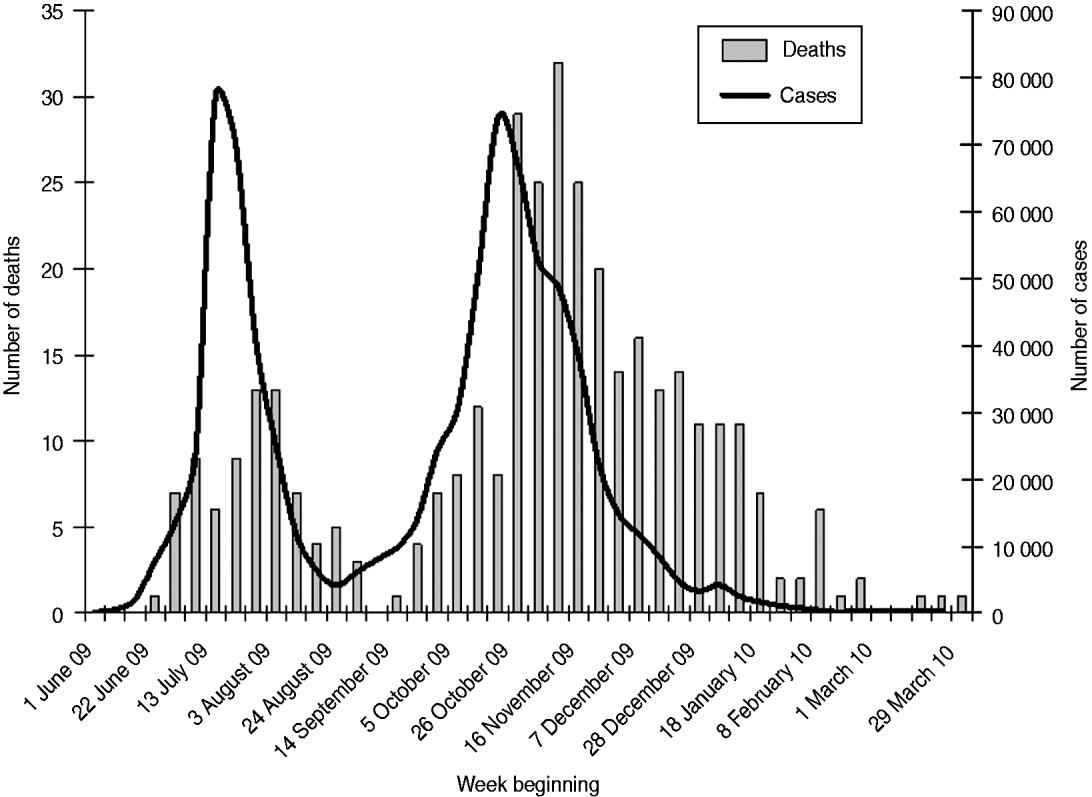
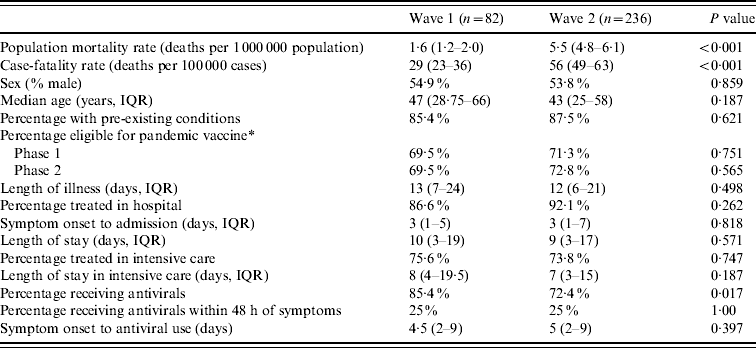
Cases and deaths occurred over two distinct waves (Fig. 1). There were nearly four times as many deaths in the second wave as in the first (279 vs. 82). This was reflected in a higher population mortality rate (5·4 vs. 1·6/1 000 000, Pearson χ2=108, d.f.=1, P<0·001) and a higher overall CFR (56 vs. 29/100 000, Pearson χ2=28, P<0·001) in the second wave. CFRs were higher for each age group in the second wave than in the first except for those aged ⩾65 years, in whom the rate was unchanged (Table 1). These differences only achieved statistical significance in the 25–44 years age group. The characteristics, place and duration of treatment were similar across the two waves (Table 2). The proportion of patients who received antiviral medication was lower during the second wave than the first.

Fig. 1. The weekly estimated incidence of pandemic (H1N1) 2009 influenza cases and confirmed deaths in England.
Table 2. A comparison of deaths in the first and second waves of pandemic (H1N1) 2009 influenza in England

IQR, Inter-quartile range.
* England had two phases of vaccination, phase 1 included those eligible for seasonal influenza and pregnant women, phase 2 included those aged <5 years.
95% exact confidence intervals presented for mid-point estimate of cases; the median duration of treatment/stay is presented; χ2 test with Yates' continuity correction used to compare proportions; Mann–Whitney U test to compare medians.
Risk associated with pre-existing conditions
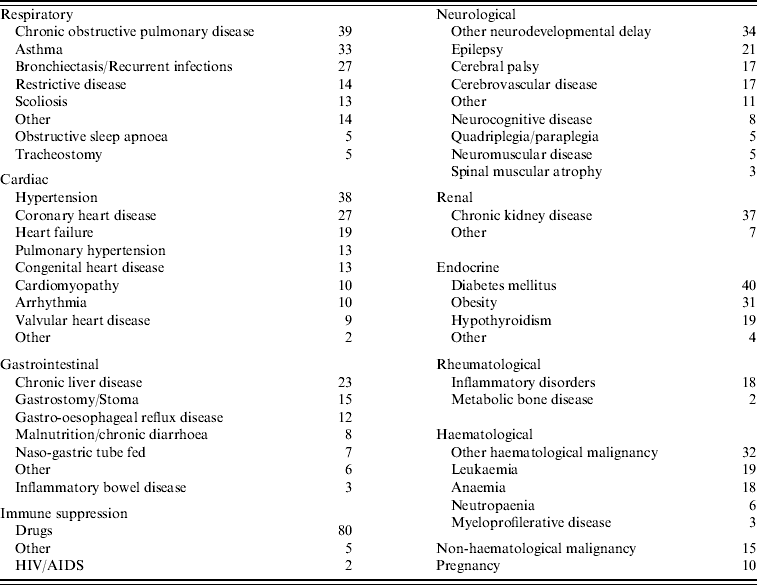
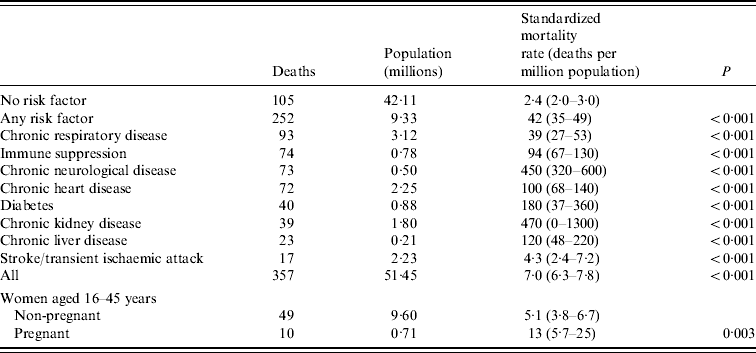
Chronic neurological disease, particularly neurodevelopmental conditions, chronic respiratory disease, and immune suppression were the most common pre-existing conditions in those who died (Table 3). When the numbers of deaths from these conditions were related to the prevalence of the diseases in the population, individuals with chronic neurological disease, chronic heart disease or immune suppression had a significantly higher age-standardized mortality rate than those with chronic respiratory disease (Table 4). The age-standardized mortality rate for pregnant women was over twofold greater than for non-pregnant women of the same age, although this observation was not statistically significant. Of the pregnant women who died, only two had any other pre-existing medical conditions.
Table 3. Pre-existing conditions in those who died from pandemic (H1N1) 2009 influenza in England (n=361)

Table 4. Mortality due to pandemic (H1N1) 2009 influenza associated with pre-existing conditions in England

Values in parentheses are 95% confidence intervals.
Chronic respiratory disease includes chronic obstructive pulmonary disease (COPD), asthma treated with steroids, bronchiectasis and restrictive lung disease.
Chronic neurological disease includes neurodevelopmental, neurodegenerative conditions and dementia, excludes stroke and transient ischaemic attack.
Immune suppression includes haematological malignancies and immune suppressive drugs, excluding steroids. Chronic heart disease includes ischaemic heart disease, congestive cardiac failure and congenital heart disease [Reference Gates13].
The mortality rate is standardized to the English population aged ⩾6 months; except for women aged 16–45 years where the mortality rates is standardized to the English population aged 16–45 years.
Antiviral medication
A quarter (63/252) of those who received antiviral medication and had a recorded date of symptom onset received this medication within the recommended time window of 48 h from symptom onset. The median interval from symptom onset to starting antiviral medication was 5 days (IQR 2–9 days). Those that died in the community were less likely to have been treated with antiviral medication than those that died in hospital (12/33 vs. 260/328, χ2=29·7, d.f.=1, P<0·001).
DISCUSSION
In England, the second wave of pandemic (H1N1) 2009 influenza caused significantly higher population mortality than the first wave. A similar pattern has been observed in the three previous influenza pandemics in the UK [Reference Woodall, Rowson and McDonald17–Reference Viboud19]. None of the explanations for the increase in these previous pandemics appears to hold this time. Genetic drift is generally accepted as the explanation for higher second wave mortality in the pandemics of 1918 [Reference Kobasa20] and 1968/1969 [21]. The pandemic (H1N1) 2009 virus did not change during its passage through countries [Reference Viboud19]. In the 1957 pandemic, an increase in cases in the elderly in the second wave resulted in higher mortality [Reference Woodall, Rowson and McDonald17, Reference Payne18]. In the 2009 pandemic, we have not observed any shift in the age distribution of those affected in the two waves.
There are two possible explanations for greater population mortality – an increase in community transmission, or an increase in CFR. A higher estimated number of cases in the second wave implies greater community transmission. Environmental and behavioural factors may explain the increase. Lower absolute humidity due to lower temperatures during the second wave peak (mean temperature: October 2009, 11·3°C; November 2009, 8·3°C) compared to the summer peak (July 2009, 16·1°C; August 2009, 16·6°C) could have facilitated transmission [22, Reference Lowen23].
Reduced compliance with non-pharmaceutical preventive measures has been associated with increased community transmission [Reference Hatchett, Mecher and Lipsitch24]. In England, compliance with preventive measures may have been higher in the first wave, when public anxiety was greater and a prominent advertising campaign (‘Catch it, Bin it, Kill it’) was active. National policy was to maintain a containment phase for as long as feasible during the first wave. This involved treatment and home quarantine of cases, prophylaxis for identified contacts, and closure of schools. Such measures may reduce viral transmission [Reference Cao25]. Use of antiviral medication was also higher during the first wave. Antiviral collection from the National Pandemic Flu Service, the main supplier of antiviral medication, relative to cases was threefold higher in the first wave [26]. In combination these behaviours could have reduced community transmission of the virus during the first wave.
In contrast during the second wave, a general assumption of ‘mildness’ fuelled by less media coverage may have meant that patients were less likely to consult medical services when ill or delay their presentation. Similarly, clinicians may have seen less need for aggressive patient monitoring and treatment. Supporting this is our finding of a lower prescription of antiviral medication in patients who died in the second wave than in the first.
Our finding of a higher CFR in the second wave might suggest the possibility of increasing severity. There are inherent uncertainties in calculating this rate. The calculation requires estimation of case numbers. In turn, this requires an estimate of the proportion of symptomatic people who consult medical services. This proportion may have changed between waves. Specifically, it may have fallen during the pandemic, as public anxiety subsided [Reference Garske27, Reference Baguelin28]. Estimates of the relative magnitude of this effect (the proportion of infected people, based on seroprevalence studies, who consulted) between the two waves suggest this could account for the apparent increase in case fatality observed [Reference Baguelin28]. This makes it difficult to confidently compare CFRs between the two waves. In the absence of genetic drift [22], a genuine increase case fatality may be difficult to explain. Although recent studies propose that higher viral load, or multiple infections, due to higher levels of community transmission may increase the CFR [Reference Paulo29].
We also note that in the second wave the number of deaths appears to persist at a high number relative to the number of cases after the wave's peak, compared to the first wave. This does not appear to be simply explained by a time lag between cases and deaths occurring. The median onset from symptoms to death was the same in both waves. The effect could be explained by an increase in the CFR as the pandemic progressed. However, such an apparent increase in CFR could also be explained by a lower proportion of the symptomatic population seeking medical help, reflected in a lower estimate of the number of cases.
The CFR is an important measure for modelling the pandemic, giving clear messages to the public and guiding policy makers. Our overall estimate of case fatality (0·046%) tends to fall in the mid-range of estimates described in the literature, with high estimates around 0·1–0·9% [Reference Echevarría-Zuno1, Reference Fraser30], and low estimates around 0·005% [Reference Baker31]. The estimation of the denominator, the number of influenza cases, is particularly difficult [Reference Presanis32, Reference Hadler33]. Different case definitions, methods, timing of the estimate and population characteristics both for influenza deaths and influenza cases will explain some of the international differences.
Some influenza deaths, particularly where a secondary bacterial infection occurred, may have been overlooked by clinicians. Nonetheless clinical vigilance and testing rates in hospital appeared to be high during the pandemic. The absence of an excess deaths signal also suggests that a large number of influenza deaths were not missed. Better clinical reporting in the second wave, once the NHS had adapted to the pandemic, might account for the greater number of deaths in the second wave. Conversely the heightened media attention during the first wave, might predict better reporting in the first wave. Other measures, notably case estimates based on seroprevalence data, suggest a two- to threefold greater incidence of cases in the second wave (in the young), suggesting the observed increase in deaths is real [Reference Baguelin28, Reference Miller34].
By expressing the number of deaths for different chronic conditions relative to the prevalence of these conditions in the population, we have been able to describe the risk associated with different pre-existing medical conditions. Other studies have suggested that chronic respiratory disease is the most significant risk factor for severe illness and death [Reference Echevarría-Zuno1, Reference Jain3, 22]. In contrast, our analysis suggests that other conditions, notably chronic neurological disease, chronic heart disease, and immune suppression, confer a greater individual risk than chronic respiratory disease. Chronic respiratory disease is common and therefore remains a significant risk at the population level. However, clinicians and patients should be aware that many other conditions are associated with greater risk of death. Vaccination for these patients with high individual risk is particularly important. Early recognition of pandemic (H1N1) 2009 influenza in patients with these conditions will enable aggressive clinical management, which may be necessary to save their lives.
The greater population mortality in the second wave may reflect a fall in temperature, the ending of containment measures and a decrease in the public and professional perception of risk. This emphasizes the importance of maintaining preventative and treatment-seeking behaviours in the population beyond the period of initial high profile that the pandemic phenomenon attracts. This is a valuable lesson for future influenza seasons and for future pandemics.
ACKNOWLEDGEMENTS
We are grateful to the many clinicians in England who supplied the clinical information on their patients. Gillian Perkins and Tara Fajeyisan kindly managed the database.
DECLARATION OF INTEREST
L.J.D. is the former Chief Medical Officer for England. In this role he advised the government on public health policy, including the management of the pandemic. O.T.M., P.D.R., M.M., E.A.I.S., and N.S. supported him in this task. This work was conducted as part of the public health response to pandemic (H1N1) 2009 influenza in England. No additional funding was sought.


