Original text and correction:
ORIGINAL TEXT (page 3374, Discussion)
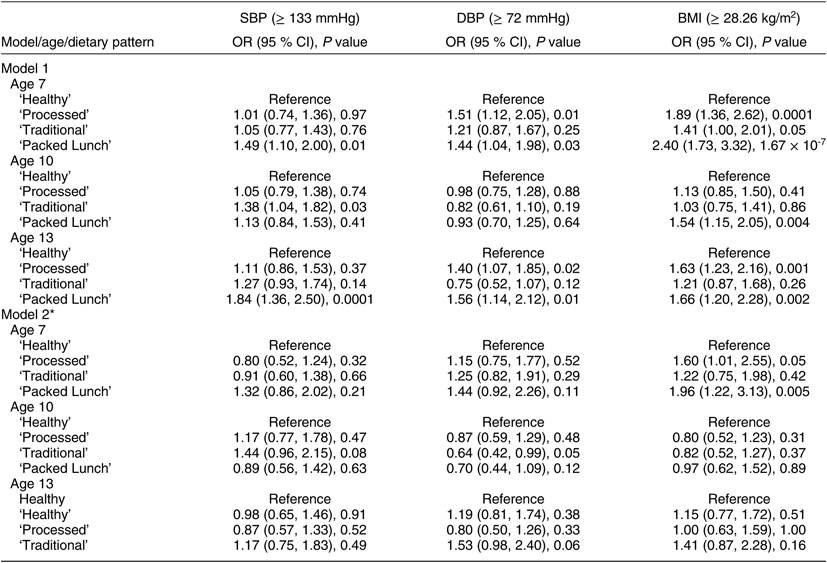
Table 2 Logistic regression model: diet patterns and physiological outcomes; Avon Longitudinal Study of Parents and Children (ALSPAC). Unadjusted and adjusted OR and 95 % CI and P values for being above the 90th centile (value shown in parentheses) for each outcome

SBP, systolic blood pressure; DBP, diastolic blood pressure.
* Model 2 adjusts for: age at time of dietary assessment, age at time of outcome measurement, gender, birth weight, gestational age, energy intake at time of dietary assessment, maternal age and parity, mother’s social class, father’s social class, maternal education and dietary patterns at other ages.
CORRECTION
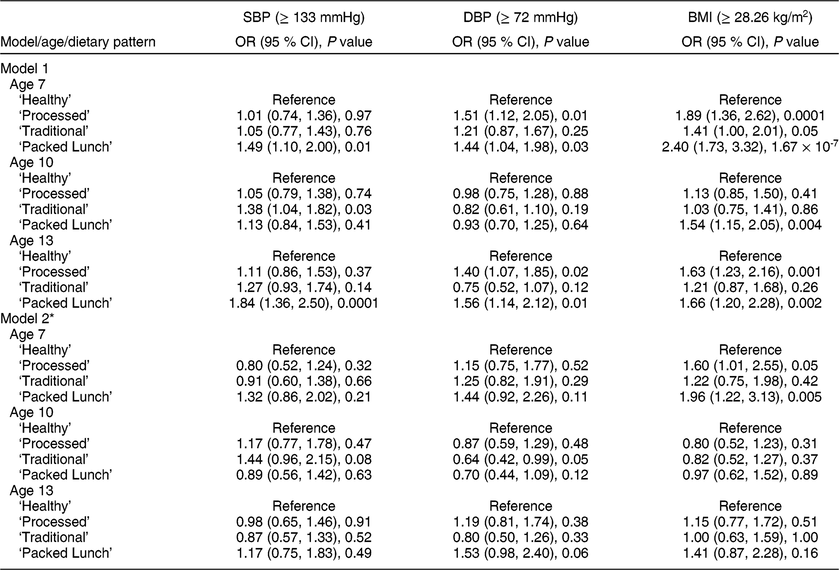
The row titles for Model 2, Age 13 should read ’Healthy’, ’Processed’, ’Traditional’, and ‘Packed Lunch’ as they do for the rest of the rows in Table 2. This has been updated below.
Table 2 Logistic regression model: diet patterns and physiological outcomes; Avon Longitudinal Study of Parents and Children (ALSPAC). Unadjusted and adjusted OR and 95 % CI and P values for being above the 90th centile (value shown in parentheses) for each outcome

SBP, systolic blood pressure; DBP, diastolic blood pressure.
* Model 2 adjusts for: age at time of dietary assessment, age at time of outcome measurement, gender, birth weight, gestational age, energy intake at time of dietary assessment, maternal age and parity, mother’s social class, father’s social class, maternal education and dietary patterns at other ages.
ORIGINAL TEXT (page 3375, Discussion)
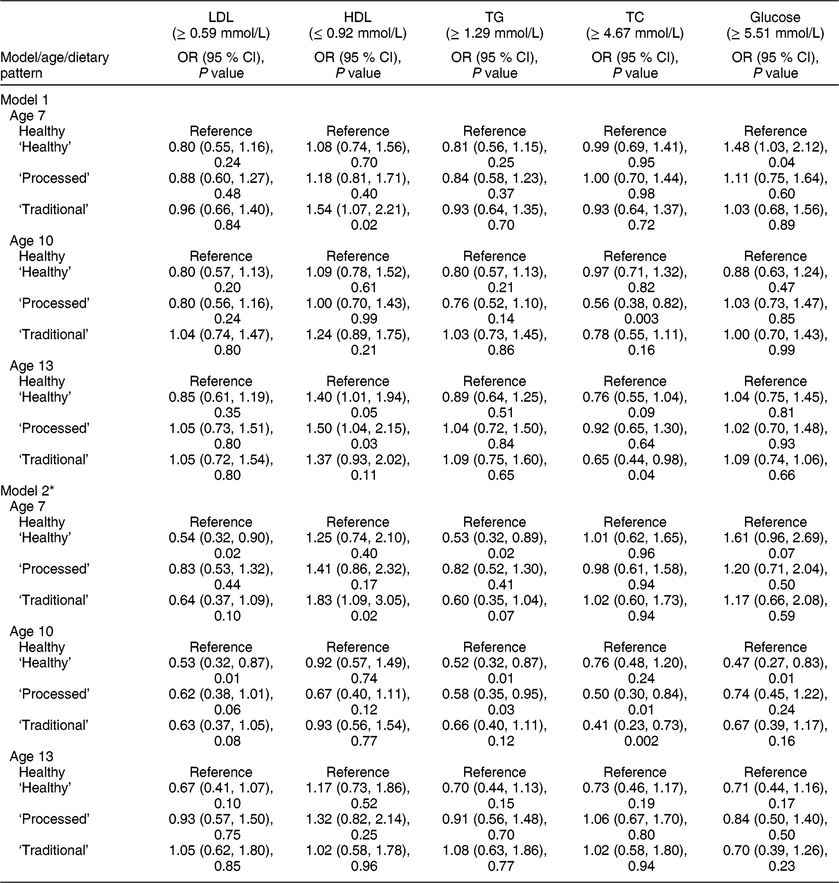
Table 3 Logistic regression model: diet patterns and biochemical outcomes; Avon Longitudinal Study for being above the 90th centile (value shown in parentheses) for each outcome of Parents and Children (ALSPAC). Unadjusted and adjusted OR and 95 % CI and P values

LDL, C, LDL cholesterol; HDL, C, HDL cholesterol; TC, total cholesterol.
* Model 2 adjusts for: age at time of dietary assessment, age at time of outcome measurement, gender, birth weight, gestational age, energy intake at time of dietary assessment, maternal age and parity, mother’s social class, father’s social class, maternal education and dietary patterns at other ages
CORRECTION
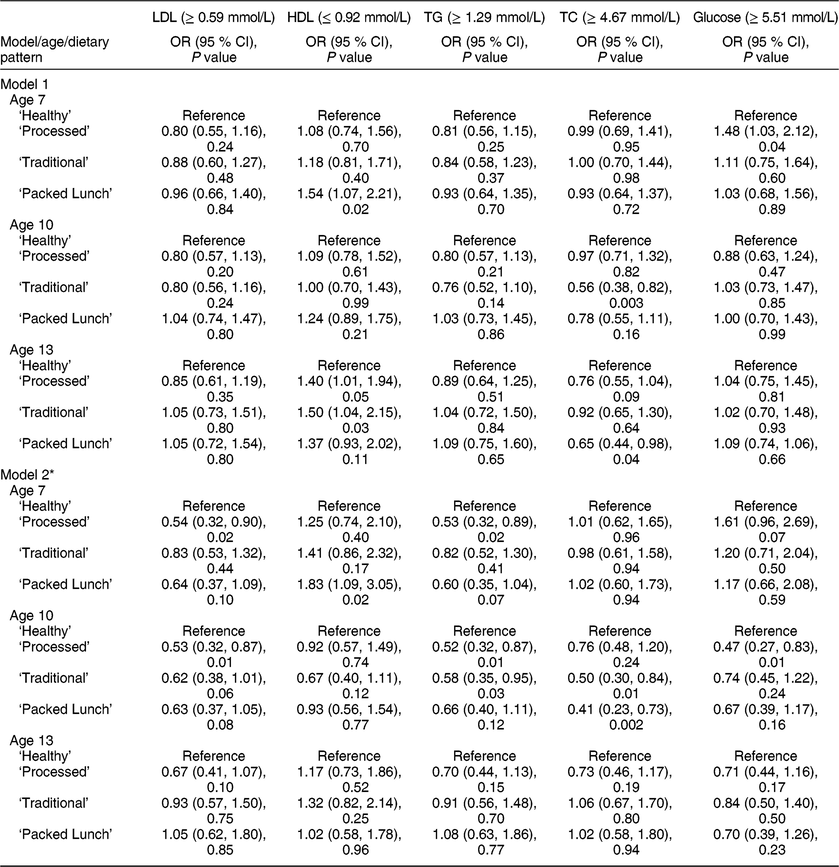
The row titles for each age in both models should read ’Healthy’, ’Processed’, ’Traditional’ and ’Packed Lunch’ in Table 3. This has been updated below.
Table 3 Logistic regression model: diet patterns and biochemical outcomes; Avon Longitudinal Study for being above the 90th centile (value shown in parentheses) for each outcome of Parents and Children (ALSPAC). Unadjusted and adjusted OR and 95 % CI and P values

LDL, C, LDL cholesterol; HDL, C, HDL cholesterol; TC, total cholesterol.
* Model 2 adjusts for: age at time of dietary assessment, age at time of outcome measurement, gender, birth weight, gestational age, energy intake at time of dietary assessment, maternal age and parity, mother’s social class, father’s social class, maternal education and dietary patterns at other ages


