Hostname: page-component-586b7cd67f-dsjbd Total loading time: 0 Render date: 2024-11-24T08:27:46.489Z Has data issue: false hasContentIssue false

Modelling the effect of soluble surfactants on droplet deformation and breakup in simple shear flow

Published online by Cambridge University Press:  24 July 2024
Yan Ba
Affiliation:
School of Astronautics, Northwestern Polytechnical University, 127 West Youyi Road, Xi'an 710072, PR China
Haihu Liu*
Affiliation:
School of Energy and Power Engineering, Xi'an Jiaotong University, 28 West Xianning Road, Xi'an 710049, PR China
Wenqiang Li*
Affiliation:
School of Astronautics, Northwestern Polytechnical University, 127 West Youyi Road, Xi'an 710072, PR China
Wenjing Yang
Affiliation:
School of Astronautics, Northwestern Polytechnical University, 127 West Youyi Road, Xi'an 710072, PR China
*
Email addresses for correspondence: [email protected], [email protected]

Abstract

A hybrid lattice Boltzmann and finite difference method is applied to study the influence of soluble surfactants on droplet deformation and breakup in simple shear flow. First, the influence of bulk surfactant parameters on droplet deformation in two-dimensional shear flow is investigated, and the surfactant solubility is found to influence droplet deformation by changing average interface surfactant concentration and non-uniform effects induced by non-uniform interfacial tension and Marangoni forces. In addition, the droplet deformation first increases and then decreases with Biot number, increases significantly with adsorption number $k$ and decreases with Péclet number or adsorption depth; and among the parameters, $k$ is the most influential one. Then, we consider three-dimensional shear flow and investigate the roles of surfactants on droplet deformation and breakup for different capillary numbers and viscosity ratios. Results show that in the soluble case with $k=0.429$, the droplet exhibits nearly the same deformation as in the insoluble case due to the balance between surfactant adsorption and desorption; upon increasing $k$ from 0.429 to 1, the average interface surfactant concentration is greatly enhanced, leading to significant increase in droplet deformation. The critical capillary number of droplet breakup $C{{a}_{cr}}$ is identified for varying viscosity ratios in clean, insoluble and soluble ($k=0.429$ and 1) systems. As the viscosity ratio increases, $C{{a}_{cr}}$ first decreases and then increases rapidly in all systems. The addition of surfactants always favours droplet breakup, and increasing solubility or $k$ could further reduce $C{{a}_{cr}}$ by increasing average interface surfactant concentration and local surfactant concentration near the neck during the necking stage.

Type
JFM Papers
Copyright
© The Author(s), 2024. Published by Cambridge University Press

1. Introduction

The droplet deformation and breakup under simple shear flow is a fundamental process in many industrial applications including biomedical and chemical processing (Sackmann, Fulton & Beebe Reference Sackmann, Fulton and Beebe2014), emulsification (McClements Reference McClements2007), coatings (Sharma et al. Reference Sharma, Sharma, Arya, Ahuja and Agnihotri2018) and droplet manipulation in microfluidics (Baret Reference Baret2012; Riechers et al. Reference Riechers, Maes, Akoury, Semin, Gruner and Baret2016), which has been the subject of numerous experimental, theoretical and computational studies over several decades. For a clean droplet, the study of droplet deformation under shear flow can be traced back to Taylor (Reference Taylor1934), who derived a theoretical model for predicting the steady-state deformation as a function of the viscosity ratio (the ratio of droplet to matrix viscosities) and capillary number (the ratio of viscous to capillary forces). Inspired by Taylor's theory, a number of theoretical or phenomenological models (Shapira & Haber Reference Shapira and Haber1990; Maffettone & Minale Reference Maffettone and Minale1998; Van Puyvelde et al. Reference Van Puyvelde, Vananroye, Cardinaels and Moldenaers2008) were proposed, which improved the accuracy of Taylor's model and complemented Taylor's theory by additionally introducing the effect of confinement ratio (the ratio of droplet diameter to wall separation). With regard to the droplet breakup, Grace (Reference Grace1982) experimentally studied the critical capillary number of droplet breakup under various viscosity ratios, and Vananroye, Van Puyvelde & Moldenaers (Reference Vananroye, Van Puyvelde and Moldenaers2006) supplemented the effect of confinement ratio on the critical capillary number. Janssen et al. (Reference Janssen, Vananroye, Van Puyvelde, Moldenaers and Anderson2010) identified different critical breakup modes, namely binary breakup and ternary breakup, and provided a generalized explanation for the effect of confinement ratio and viscosity ratio on the critical capillary number. Up to date, these predictive models for droplet deformation and critical capillary number data have been extensively used to verify numerical methods for two-phase flow simulation (Li, Renardy & Renardy Reference Li, Renardy and Renardy2000; Vananroye, Van Puyvelde & Moldenaers Reference Vananroye, Van Puyvelde and Moldenaers2007; Liu et al. Reference Liu, Ba, Wu, Li, Xi and Zhang2018), and extended to a wider range of viscosity ratios, confinement ratios and capillary numbers (Komrakova et al. Reference Komrakova, Shardt, Eskin and Derksen2015; Yang, Li & Kim Reference Yang, Li and Kim2022).

With the addition of surfactants, the droplet deformation and breakup can be strongly affected (Riechers et al. Reference Riechers, Maes, Akoury, Semin, Gruner and Baret2016). Generally, two types of surfactants can be added to a two-phase system: insoluble and soluble surfactants. Insoluble surfactants exist only at the interface, usually generated by the chemical reactions at the interface; while soluble surfactants are present both at the interface and in the bulk fluid, which are mostly added to at least one bulk fluid, and then migrate to the interface by the adsorption process. In the presence of soluble surfactants, the droplet behaviour under shear would be modified not only by the uneven distribution of surfactants at the interface, which produces non-uniform capillary forces and Marangoni stresses along the interface, but also by the adsorption–desorption dynamics between bulk and interface surfactants (Etienne, Kessler & Amstad Reference Etienne, Kessler and Amstad2017).

Experimental studies have been carried out to investigate the deformation and breakup of a surfactant-covered droplet under shear flow (Megías-Alguacil, Fischer & Windhab Reference Megías-Alguacil, Fischer and Windhab2006; Feigl et al. Reference Feigl, Megias-Alguacil, Fischer and Windhab2007; Vananroye, Van Puyvelde & Moldenaers Reference Vananroye, Van Puyvelde and Moldenaers2011). However, it is challenging to precisely capture the local surfactant concentration and flow fields using experimental measurements, and experimental studies suffer from the difficulty to assess the influence of an independent factor. Numerical simulations can overcome the limitations of experimental studies, helping one to gain additional insights into the flow physics and influencing mechanisms of surfactants. Since the pioneering work of Stone (Reference Stone1990), numerical simulation of interfacial flows with surfactants has become a hot topic. Due to the complexities of numerical simulation, including the solution of interface surfactant concentration equation over a dynamically deformable interface, incorporation of adsorption–desorption kinetics between interface and bulk surfactants, and nonlinear coupling between surfactant concentration and two-phase flow fields, previous numerical studies on surfactants mainly focused on the development and validation of numerical methods, which can be classified into sharp-interface (Stone Reference Stone1990; Milliken & Leal Reference Milliken and Leal1994; James & Lowengrub Reference James and Lowengrub2004; Bazhekov, Anderson & Meijer Reference Bazhekov, Anderson and Meijer2006; Xu et al. Reference Xu, Li, Lowengrub and Zhao2006; Muradoglu & Tryggvason Reference Muradoglu and Tryggvason2008; Xu, Yang & Lowengrub Reference Xu, Yang and Lowengrub2012; Chen & Lai Reference Chen and Lai2014; Khatri & Tornberg Reference Khatri and Tornberg2014; Muradoglu & Tryggvason Reference Muradoglu and Tryggvason2014; de Jesus et al. Reference de Jesus, Roma, Pivello, Villar and da Silveira-Neto2015; Hu, Lai & Misbah Reference Hu, Lai and Misbah2018; Shin et al. Reference Shin, Chergui, Juric, Kahouadji, Matar and Craster2018; Zhao, Ren & Zhang Reference Zhao, Ren and Zhang2021) and diffuse-interface methods (Liu & Zhang Reference Liu and Zhang2010; Teigen et al. Reference Teigen, Song, Lowengrub and Voigt2011; van der Sman & Meinders Reference van der Sman and Meinders2016; Liu et al. Reference Liu, Ba, Wu, Li, Xi and Zhang2018; Soligo, Roccon & Soldati Reference Soligo, Roccon and Soldati2019; Zhu et al. Reference Zhu, Kou, Sun, Yao and Li2019Reference Zhu, Kou, Yao, Li and Sun2020; Zong et al. Reference Zong, Zhang, Liang, Wang and Xu2020; Far, Gorakifard & Fattahi Reference Far, Gorakifard and Fattahi2021; Zhang et al. Reference Zhang, Liu, Wei, Hou and Jiang2021a).

With the aid of the numerical methods, simulations, albeit not many, have been conducted to identify the influence of surfactants on the droplet behaviour under shear flow. In the case of insoluble surfactants, Feigl et al. (Reference Feigl, Megias-Alguacil, Fischer and Windhab2007) used the boundary integral (BI) method and experimental verifications to study the deformation and orientation behaviour of a three-dimensional (3-D) droplet for different surfactant coverages over a range of capillary numbers and viscosity ratios. Through a combination of the 3-D BI method and finite volume method, Bazhekov et al. (Reference Bazhekov, Anderson and Meijer2006) investigated the effect of insoluble surfactants on the droplet deformation for varying surfactant coverages, elasticity numbers and Péclet numbers, and obtained the phase diagram showing the critical capillary number as a function of viscosity ratio for different surfactant coverages. With a level-set continuum surface force (CSF) method, Xu et al. (Reference Xu, Yang and Lowengrub2012) studied the droplet deformation in a two-dimensional (2-D) shear flow for various flow and surfactant parameters, including surfactant coverage, capillary number, Reynolds number, Péclet number, density ratio and viscosity ratio. Using the dissipative particle dynamics, Zhang, Xu & He (Reference Zhang, Xu and He2018) investigated the effect of surfactants on the droplet deformation in 3-D shear flow for Reynolds numbers ranging from 1.6 to 16. Recently, a hybrid lattice Boltzmann and finite difference (LB-FD) method was developed and was applied to explore the effect of insoluble surfactants on the droplet deformation and critical capillary number for different confinement ratios and Reynolds numbers (Liu et al. Reference Liu, Ba, Wu, Li, Xi and Zhang2018). For the case of soluble surfactants, Teigen et al. (Reference Teigen, Song, Lowengrub and Voigt2011), by developing a diffuse-interface method that solves the interface and bulk surfactant concentration equations of diffuse-interface form in the entire fluid domain, studied the influence of Biot number and bulk Péclet number on the droplet deformation in a 2-D shear flow, and presented an example showing the droplet breakup in a 3-D shear flow. A level-set method, which solves the bulk surfactant concentration equation through a diffusive domain method, was proposed by Xu, Shi & Lai (Reference Xu, Shi and Lai2018) for two-phase flows with soluble surfactants. By investigating the influence of four bulk surfactant parameters, including Biot number ($Bi$), bulk Péclet number ($Pe_b$), adsorption number ($k$) and adsorption depth ($h$) on droplet deformation in a 2-D shear flow, they found that with the increase of $Bi$, the droplet deformation decreases due to the decreased Marangoni stresses, while other parameters only slightly influence the droplet deformation. Soligo, Roccon & Soldati (Reference Soligo, Roccon and Soldati2020) studied the influence of bulk surfactant concentration and Péclet number on the droplet deformation in shear flow using a phase-field method, in which the surfactant transport is described by a Cahn–Hilliard (CH) equation. Zong et al. (Reference Zong, Zhang, Liang, Wang and Xu2020) and Zhou et al. (Reference Zhou, Xing, Liu and Yan2023) also simulated the surfactant-laden droplet behaviour through the phase-field method, and found that increasing the bulk surfactant concentration can enhance the droplet deformation for various density ratios and capillary numbers. Focusing on the droplet breakup under shear, Zhang et al. (Reference Zhang, Shu, Guan and Yang2021b) studied the breakup regimes for clean and surfactant-laden droplets using a LB phase-field method, and obtained a regime map for multiple breakup of droplets in two dimensions.

As reviewed above, most numerical investigations on soluble surfactants were carried out using the phase-field method. However, the phase-field method for soluble surfactants suffers from some limitations: (1) it cannot independently control the diffusivities of interface and bulk surfactants; (2) it cannot adjust adsorption and desorption rates of surfactants; (3) bulk surfactants cannot be present in only one bulk fluid but must be present in both bulk fluids. Thus, the effect of bulk surfactant parameters including Biot number ($Bi$), bulk Péclet number ($Pe_b$), adsorption number ($k$) and adsorption depth ($h$) on the droplet deformation was rarely studied. In addition, all existing studies on a soluble-surfactant-laden droplet under shear were limited to two dimensions except for a 3-D example presented by Teigen et al. (Reference Teigen, Song, Lowengrub and Voigt2011). This implies the loss of much important information, which makes the obtained results not representative of the real world. Finally, although the droplet breakup with critical capillary number curves has been studied, see Zhang et al. (Reference Zhang, Shu, Guan and Yang2021b), the influence of surfactant solubility and bulk surfactant parameters on the critical capillary number for various viscosity ratios remains unexplored.

In this work a recently developed LB-FD method (Ba et al. Reference Ba, Liu, Li and Yang2023) is applied for the simulation of droplet deformation and breakup under shear with soluble surfactants. Unlike the phase-field method, the present method uses two equations, with one for interface surfactant concentration and the other for the bulk surfactant concentration, to describe the surfactant transport, which can overcome the limitations of the phase-field method and, thus, allow access to various bulk surfactant parameters. With the LB-FD method, we first investigate the influence of four bulk surfactant parameters (i.e. Biot number $Bi$, bulk Péclet number $Pe_b$, adsorption number $k$ and adsorption depth $h$) on the droplet deformation in a 2-D shear flow so that the most influential bulk surfactant parameter can be identified. Then, we focus on a 3-D shear flow and investigate the roles of surfactants, solubility and the most influential bulk surfactant parameter on the droplet deformation and breakup for various capillary numbers and viscosity ratios.

2. Problem statement and numerical method

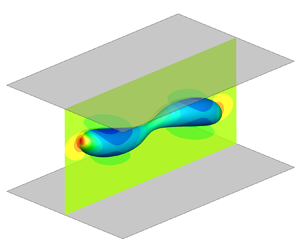
In the present work the role of soluble surfactants on the deformation and breakup of a single droplet under simple shear flow is investigated. As illustrated in figure 1, we consider a circular (2-D) or spherical (3-D) droplet (red fluid) with radius $R$ initially placed halfway between two parallel walls that are separated by a distance $H$, and the upper and lower walls move with equal but opposite velocities $\pm {{u}_{w}}$ to produce a constant shear rate of $\dot {\gamma }=2{{u}_{w}}/H$. The droplet and the ambient fluid (blue fluid) are assumed to have equal densities, i.e. ${{\rho }^{R0}}={{\rho }^{B0}}$, and their dynamic viscosities are ${{\mu }^{R0}}$ and ${{\mu }^{B0}}$, respectively. In the absence of surfactants, the interfacial tension coefficient between droplet and ambient fluid is ${{\sigma }_{0}}$. For the sake of simplicity, the bulk surfactants are considered to be soluble only in the ambient fluid with an initial uniform concentration of ${{\phi }_{0}}$, and the interface surfactants are present only at the interface with an initial uniform concentration of ${{\psi }_{0}}$.

Figure 1. Illustration of (a) a 2-D droplet and (b) a 3-D droplet in a simple shear flow. In (a) the initial circular droplet (represented by red dashed lines) finally evolves to an ellipse-like shape (represented by red solid lines) with semi-major axis $a$ (measured by the longest distance between two points at the interface) and semi-minor axis $b$ (measured by the shortest distance between two points at the interface). Point ‘A’ is the right intersection point between the horizontal centreline of the computational domain ($y=0$) and the droplet interface.

For the present problems, the droplet behaviour can be characterized by three groups of dimensionless parameters, including the flow parameters, interface surfactant parameters and bulk surfactant parameters (Xu et al. Reference Xu, Li, Lowengrub and Zhao2006; Teigen et al. Reference Teigen, Song, Lowengrub and Voigt2011; Liu et al. Reference Liu, Ba, Wu, Li, Xi and Zhang2018; Xu et al. Reference Xu, Shi and Lai2018), which are listed in table 1. In the table, $L=R$ and $U=\dot {\gamma }R$ are the characteristic length and the characteristic velocity, respectively; ${{D}_{i}}$ is the interface surfactant diffusivity, $\mathscr {R}$ is the ideal gas constant, $T$ is the absolute temperature and ${{\psi }_{\infty }}$ is the maximum capacity of the interface surfactant concentration; ${{D}_{b}}$ is the bulk surfactant diffusivity and ${{r}_{a}}$ and ${{r}_{d}}$ are the adsorption and desorption coefficients, respectively.

Table 1. Dimensionless parameters characterizing the deformation and breakup of a droplet in simple shear with soluble surfactants.

Numerical simulations are performed to investigate such a multiphase system, in which the fluid flow and the surfactant transport are respectively governed by (Teigen et al. Reference Teigen, Song, Lowengrub and Voigt2011)

(2.1)\begin{gather} \boldsymbol{\nabla} \boldsymbol{\cdot} \boldsymbol{u}=0, \end{gather}
(2.2)\begin{gather} \partial_t \left( \rho \boldsymbol{u} \right)+\boldsymbol{\nabla} \boldsymbol{\cdot} \left( \rho \boldsymbol{uu} \right)=-\boldsymbol{\nabla} p+\boldsymbol{\nabla} \boldsymbol{\cdot} \left[ \mu \left( \boldsymbol{\nabla} \boldsymbol{u}+\boldsymbol{\nabla} {{\boldsymbol{u}}^{T}} \right) \right]+{{\boldsymbol{F}}_{s}} \end{gather}

and

(2.3)\begin{gather} {{\partial }_{t}}(\delta_{\varGamma}\psi )+\boldsymbol{\nabla} \boldsymbol{\cdot} (\delta_{\varGamma}\psi \boldsymbol{u})={{D}_{i}}\boldsymbol{\nabla} \boldsymbol{\cdot} (\delta_{\varGamma}\boldsymbol{\nabla} \psi )+\delta_{\varGamma}j, \end{gather}
(2.4)\begin{gather} {{\partial }_{t}}(\chi\phi)+\boldsymbol{\nabla} \boldsymbol{\cdot} (\chi\phi \boldsymbol{u})={{D}_{b}}\boldsymbol{\nabla} \boldsymbol{\cdot} (\chi\boldsymbol{\nabla} \phi )-\delta_{\varGamma}j. \end{gather}

In the above equations, $t$ is the time, $\mu$ is the dynamic viscosity, $\rho$, $\boldsymbol {u}$ and $p$ are the total density, fluid velocity and pressure, and ${{\boldsymbol {F}}_{s}}$ is the interfacial force in the CSF form. Here $\psi$ and $\phi$ are the interface surfactant concentration and the bulk surfactant concentration; $\delta _{\varGamma }$ is the Dirac function used to localize the interface, $\chi$ is to localize the bulk surfactants only in the ambient fluid and $j$ is the source term defined as (Ba et al. Reference Ba, Liu, Li and Yang2023)

(2.5)\begin{equation} j={{r}_{a}}\phi ({{\psi }_{\infty }}-\psi )-{{r}_{d}}\psi, \end{equation}

which denotes the net flux of surfactants from the bulk phase to the interface.

In addition to (2.1)–(2.4), an advection equation has to be solved to capture the interface evolution in traditional multiphase solvers, such as the volume-of-fluid and level-set methods, which need either sophisticated interface reconstruction or unphysical reinitialization. To avoid these issues, a recently developed hybrid LB-FD method (Ba et al. Reference Ba, Liu, Li and Yang2023) is applied to simulate such an immiscible two-phase flow with soluble surfactants. In the hybrid method the LB colour-gradient model is applied to simulate two-phase flows described by (2.1) and (2.2), while a FD method is applied to solve the interface and bulk surfactant transport equations, namely (2.3) and (2.4), over the entire fluid domain (Teigen et al. Reference Teigen, Song, Lowengrub and Voigt2011). The LB model and FD method are coupled by a modified Langmuir equation of state (EOS), which relates the interfacial tension to the interface surfactant concentration and allows for the surfactant concentration exceeding the critical micelle concentration (CMC). The present method for interfacial flows with soluble surfactants has been validated against analytical solutions and available literature data by simulating several examples, including the adsorption of bulk surfactants onto the interface of a stationary droplet, the droplet migration under a constant surfactant gradient, the deformation of a surfactant-laden droplet in a simple shear flow and the buoyancy-driven bubble rise in a surfactant solution; see our recent work (Ba et al. Reference Ba, Liu, Li and Yang2023) for details. In the following, we introduce this hybrid method briefly.

In the LB colour-gradient model, two distribution functions $f_{i}^{R}$ and $f_{i}^{B}$ are introduced to represent the red and blue fluids, in which $i$ is the lattice velocity direction ranging from 0 to $(n-1)$ for a D$m$Q$n$ lattice model. Like in Liu et al. (Reference Liu, Ba, Wu, Li, Xi and Zhang2018), the D2Q9 and D3Q19 lattice models are used for 2-D and 3-D simulations, respectively, and their corresponding lattice velocities ${{\boldsymbol {e}}_{i}}$ and the weighting factors ${{w}_{i}}$ are (Halliday, Hollis & Care Reference Halliday, Hollis and Care2007; Liu, Valocchi & Kang Reference Liu, Valocchi and Kang2012; Ba et al. Reference Ba, Liu, Sun and Zheng2015)

(2.6a,b) \begin{equation} {{\boldsymbol{e}}_{i}}=\left\{ \begin{array}{@{}ll} (0,0), & i=0; \\ ({\pm} 1,0),(0,\pm 1), & i=1,2,3,4; \\ ({\pm} 1,\pm 1), & i=5,6,7,8, \\ \end{array} \right.\quad {{w}_{i}}=\left\{ \begin{array}{@{}ll} 4/9, & i=0; \\ 1/9, & i=1,2,3,4; \\ 1/36, & i=5,6,7,8, \\ \end{array} \right. \end{equation}

and

(2.7) \begin{equation} \left. \begin{aligned} & {{\boldsymbol{e}}_{i}}=\left\{ \begin{array}{@{}ll} (0,0,0), & i=0; \\ ({\pm} 1,0,0),(0,\pm 1,0),(0,0,\pm 1), & i=1,2,\ldots ,6; \\ ({\pm} 1,\pm ,0),({\pm} 1,0,\pm 1),(0,\pm 1,\pm 1), & i=7,8,\ldots ,18, \end{array} \right. \\ & {{w}_{i}}=\left\{ \begin{array}{@{}ll} 1/3, & i=0; \\ 1/18, & i=1,2,\ldots ,6; \\ 1/36, & i=7,8,\ldots ,18. \end{array} \right. \end{aligned} \right\} \end{equation}

In each time step, the colour-gradient model consists of three steps, namely the collision, recolouring and streaming. First, the total distribution function, defined as ${{f}_{i}}=f_{i}^{R}+f_{i}^{B}$, undergoes a collision step as

(2.8)\begin{equation} f_{i}^{{{{\dagger}}} }\left( \boldsymbol{x},t \right)={{f}_{i}}\left( \boldsymbol{x},t \right)-\frac{1}{\tau }\left[\, {{f}_{i}}(\boldsymbol{x},t)-f_{i}^{eq}(\boldsymbol{x},t) \right]+{{\varPhi }_{i}}, \end{equation}

where ${{f}_{i}}( \boldsymbol {x},t )$ is the total distribution function at the position $\boldsymbol {x}$ and time $t$ in the $i$th lattice velocity direction, $\tau$ is the dimensionless relaxation time, ${{\varPhi }_{i}}$ is the forcing term responsible for creating the interfacial force ${{\boldsymbol {F}}_{\boldsymbol {s}}}$ and $f_{i}^{{{\dagger}} }$ is the post-collision distribution function. Here $f_{i}^{eq}( \boldsymbol {x},t )$ is the equilibrium distribution function, which is related to the total density $\rho$ and the velocity $\boldsymbol {u}$ by (Ba et al. Reference Ba, Liu, Sun and Zheng2015; Liu et al. Reference Liu, Ba, Wu, Li, Xi and Zhang2018Reference Liu, Valocchi and Kang2012)

(2.9)\begin{equation} f_{i}^{eq}\left( \boldsymbol{x},t \right)=\rho {{w}_{i}}\left[ 1+\frac{{{\boldsymbol{e}}_{i}}\boldsymbol{\cdot} \boldsymbol{u}}{c_{s}^{2}}+\frac{{{\left( {{\boldsymbol{e}}_{i}}\boldsymbol{\cdot} \boldsymbol{u} \right)}^{2}}}{2c_{s}^{4}}-\frac{{{\boldsymbol{u}}^{2}}}{2c_{s}^{2}} \right], \end{equation}

where ${{c}_{s}}={1}/{\sqrt {3}}$ is the sound speed, and the total density $\rho$ is the sum of ${{\rho }^{R}}$ and ${{\rho }^{B}}$ with ${{\rho }^{R}}$ and ${{\rho }^{B}}$ being the local densities of the red and blue fluids, respectively. For the present problems, we use the above Bhatnagar–Gross–Krook collision operator (Liu et al. Reference Liu, Valocchi and Kang2012; Ba et al. Reference Ba, Liu, Sun and Zheng2015), which, when dealing with high-density-ratio problems, has to be replaced by its multiple-relaxation-time counterpart to improve numerical stability and accuracy (Ba et al. Reference Ba, Liu, Li, Kang and Sun2016).

With the body force model of Guo, Zheng & Shi (Reference Guo, Zheng and Shi2002), the forcing term is given by

(2.10)\begin{equation} {{\varPhi }_{i}}(\boldsymbol{x},t)=\left( 1-\frac{1}{2\tau } \right){{w}_{i}}\left[ \frac{{{\boldsymbol{e}}_{i}}-\boldsymbol{u}}{c_{s}^{2}}+\frac{({{\boldsymbol{e}}_{i}}\boldsymbol{\cdot} \boldsymbol{u}){{\boldsymbol{e}}_{i}}}{c_{s}^{4}} \right]\boldsymbol{\cdot} {{\boldsymbol{F}}_{s}}(\boldsymbol{x},t). \end{equation}

Using the CSF model, the interfacial force ${{\boldsymbol {F}}_{\boldsymbol {s}}}$ consisting of normal capillary force and tangential Marangoni stress can be expressed as (Lishchuk, Care & Halliday Reference Lishchuk, Care and Halliday2003; Halliday et al. Reference Halliday, Hollis and Care2007)

(2.11)\begin{equation} {{\boldsymbol{F}}_{s}}(\boldsymbol{x},t)=-\frac{1}{2}\sigma \kappa \boldsymbol{\nabla} {{\rho }^{N}}+\frac{1}{2}|\boldsymbol{\nabla} {{\rho }^{N}}|\left[ \boldsymbol{\nabla} \sigma -\left( \boldsymbol{n}\boldsymbol{\cdot} \boldsymbol{\nabla} \sigma \right)\boldsymbol{n} \right], \end{equation}

where ${{\rho }^{N}}={( {{\rho }^{R}}-{{\rho }^{B}} )}/{\rho }$ is the colour function introduced to distinguish two different fluids, $\sigma$ is the interfacial tension coefficient, $\boldsymbol {n}=-\boldsymbol {\nabla } {{\rho }^{N}}/|\boldsymbol {\nabla } {{\rho }^{N}}|$ is the unit vector normal to the interface and $\kappa =-\boldsymbol {\nabla } \boldsymbol{\cdot} \boldsymbol {n}$ is the local interface curvature. In the presence of surfactants, the interfacial tension coefficient $\sigma$ is no longer a constant but changes with the interface surfactant concentration $\psi$. Often, a nonlinear Langmuir EOS, taken in the form of (Kruijt-Stegeman, van de Vosse & Meijer Reference Kruijt-Stegeman, van de Vosse and Meijer2004; Nganguia et al. Reference Nganguia, Young, Vlahovska, Blawzdziewicz, Zhang and Lin2013; Liu et al. Reference Liu, Zhang, Ba, Wang and Wu2020)

(2.12)\begin{equation} \sigma (\psi )=\max \left\{ {{\sigma }_{0}}[1+{{E}_{0}}\ln (1-\psi /{{\psi }_{\infty }})], {{\sigma }_{min }} \right\} \end{equation}

is used to describe the change of $\sigma$ with $\psi$. Equation (2.12) suggests that the interfacial tension coefficient $\sigma$ would remain a constant ${{\sigma }_{min }}$ when the interface surfactant concentration exceeds a critical value, known as the CMC. Here, ${{\sigma }_{min }}$ is set to ${{\sigma }_{0}}/10$, which leads to ${\rm CMC}={{\psi }_{\infty }}[ 1-\exp ( -0.9/{{E}_{0}} ) ]$ (Liu et al. Reference Liu, Zhang, Ba, Wang and Wu2020; Nganguia et al. Reference Nganguia, Young, Vlahovska, Blawzdziewicz, Zhang and Lin2013).

Then, a recolouring step is applied to produce the phase segregation and ensure the immiscibility of both fluids. With the recolouring algorithm proposed by Latva-Kokko & Rothman (Reference Latva-Kokko and Rothman2005), the recoloured distribution functions are give by

(2.13)\begin{equation} \left. \begin{gathered} f_{i}^{R\ddagger }(\boldsymbol{x},t)=\frac{{{\rho }^{R}}}{\rho }f_{i}^{{{{\dagger}}} }(\boldsymbol{x},t)-\beta {{w}_{i}}\frac{{{\rho }^{R}}{{\rho }^{B}}}{\rho }{{\boldsymbol{e}}_{i}}\boldsymbol{\cdot}\boldsymbol{n};\\ f_{i}^{B\ddagger }(\boldsymbol{x},t)=\frac{{{\rho }^{B}}}{\rho }f_{i}^{{{{\dagger}}} }(\boldsymbol{x},t)+\beta {{w}_{i}}\frac{{{\rho }^{R}}{{\rho }^{B}}}{\rho }{{\boldsymbol{e}}_{i}}\boldsymbol{\cdot}\boldsymbol{n}, \end{gathered} \right\} \end{equation}

where $f_{i}^{k\ddagger }$ is the recoloured distribution function of the fluid $k$ and $\beta =0.7$ is the segregation parameter.

Finally, the red and blue distribution functions both undergo a propagation step as

(2.14)\begin{equation} f_{i}^{k}\left( \boldsymbol{x}+{{\boldsymbol{e}}_{i}},t+1 \right)=f_{i}^{k\ddagger }\left( \boldsymbol{x},t \right),\quad k=R,\ B, \end{equation}

and the resulting distribution functions are applied to calculate the fluid densities through ${{\rho }^{k}}={\sum }_{i}\,{f_{i}^{k}}$.

Using the Chapman–Enskog expansion, it can be shown that the fluid velocity $\boldsymbol {u}(\boldsymbol {x},t)$ should be defined as $\rho \boldsymbol {u}(\boldsymbol {x},t)=\sum _{i}{{{f}_{i}}}(\boldsymbol {x},t){{\boldsymbol {e}}_{i}}+{{\boldsymbol {F}}_{s}}(\boldsymbol {x},t)/2$ to correctly recover (2.1) and (2.2) (Ba et al. Reference Ba, Liu, Li, Kang and Sun2016; Liu et al. Reference Liu, Valocchi and Kang2012), and the dynamic viscosity of the fluid mixture and pressure are related to $\tau$ and $\rho$ by $\mu =( \tau -\tfrac {1}{2} )\rho c_{s}^{2}$ and $p=\rho c_{s}^{2}$, where $\mu$ is determined by a harmonic mean of ${{\mu }^{R0}}$ and ${{\mu }^{B0}}$, i.e. ${1}/{\mu }=({1+{{\rho }^{N}}})/{2{{\mu }^{R0}}}+({1-{{\rho }^{N}}})/{2{{\mu }^{B0}}}$ (Liu et al. Reference Liu, Zhang, Ba, Wang and Wu2020).

Substituting $\delta _{\varGamma }=\tfrac {1}{2}|\boldsymbol {\nabla } {{\rho }^{N}}|$ and $\chi =\tfrac {1}{2}(1-{{\rho }^{N}})$ into (2.3) and (2.4), one can obtain the interface and bulk convection–diffusion equations defined in the entire fluid domain, which read as (Ba et al. Reference Ba, Liu, Li and Yang2023)

(2.15)\begin{gather} {{\partial }_{t}}(|\boldsymbol{\nabla} {{\rho }^{N}}|\psi )+\boldsymbol{\nabla} \boldsymbol{\cdot} (|\boldsymbol{\nabla} {{\rho }^{N}}|\psi \boldsymbol{u})={{D}_{i}}\boldsymbol{\nabla} \boldsymbol{\cdot} (|\boldsymbol{\nabla} {{\rho }^{N}}|\boldsymbol{\nabla} \psi )+|\boldsymbol{\nabla} {{\rho }^{N}}|\,j, \end{gather}
(2.16)\begin{gather} {{\partial }_{t}}[(1-{{\rho }^{N}})\phi ]+\boldsymbol{\nabla} \boldsymbol{\cdot} [(1-{{\rho }^{N}})\phi \boldsymbol{u}]={{D}_{b}}\boldsymbol{\nabla} \boldsymbol{\cdot} [(1-{{\rho }^{N}})\boldsymbol{\nabla} \phi ]-|\boldsymbol{\nabla} {{\rho }^{N}}|\,j. \end{gather}

Following Ba et al. (Reference Ba, Liu, Li and Yang2023), the interface and bulk surfactant equations, i.e. (2.15) and (2.16), are both solved by the FD method. Specifically, a modified Crank–Nicolson scheme (Xu & Zhao Reference Xu and Zhao2003; Liu et al. Reference Liu, Ba, Wu, Li, Xi and Zhang2018) is first applied for the time discretization. Then, all the spatial derivatives are discretized using the standard central difference schemes except for the convection terms $\boldsymbol {\nabla } \boldsymbol{\cdot} (|\boldsymbol {\nabla } {{\rho }^{N}}|\psi \boldsymbol {u})$ and $\boldsymbol {\nabla } \boldsymbol{\cdot} [(1-{{\rho }^{N}})\phi \boldsymbol {u}]$, which are discretized by the third-order weighted essentially non-oscillatory scheme. Finally, the resulting linear systems for ${{\psi }^{t+1}}$ and ${{\phi }^{t+1}}$ are solved by the successive over relaxation method, in which the relaxation factor is taken as 1.2. To conserve the total mass of surfactants, ${{\psi }^{t+1}}$ and ${{\phi }^{t+1}}$ obtained from the FD solutions are rescaled using the technique proposed by Xu et al. (Reference Xu, Shi and Lai2018).

3. Deformation of a surfactant-laden droplet in 2-D shear flow

For a droplet in simple shear flow, Liu et al. (Reference Liu, Ba, Wu, Li, Xi and Zhang2018) found that the presence of insoluble surfactants increases the droplet deformation, and attributed such an increase to two reasons: (1) the decreased interfacial tension caused by the average interface surfactant concentration, which accounts for most of the increase in droplet deformation; and (2) non-uniform effects including the non-uniform interfacial tension and Marangoni stresses caused by the non-uniform surfactants. In the soluble-surfactant case the surfactant mass exchange between the interface and the bulk phase further leads to the change in the surfactant distribution at the interface, and thus, one has to consider the change of the average interface surfactant concentration and the change of non-uniform effects. To characterize these two changes, we introduce two new dimensionless parameters, i.e. the dimensionless total mass of the interface surfactants $M_{s}^{*}$ and the dimensionless source term ${{j}^{*}}$. We define $M_{s}^{*}$ as the equilibrium total mass of surfactants at the interface over the initial total mass, i.e. $M_{s}^{*}=\sum _i{\psi ^{e}_{i}}/\sum _i{\psi ^{0}_{i}}$, where $\psi ^{e}_{i}$ and $\psi ^{0}_{i}$ are the equilibrium and initial surfactant concentrations at the $i$th grid point over the interface. Here ${{j}^{*}}=j/(\gamma \phi _{0})=Bi[ k{{\phi }^{*}}(1/{{x}_{in}}-{{\psi }^{*}})-{{\psi }^{*}} ]$ indicates the direction of the surfactant mass transfer, in which ${{\psi }^{*}}=\psi /{{\psi }_{0}}$ and ${{\phi }^{*}}=\phi /{{\phi }_{0}}$. Initially, the interface and bulk surfactants are evenly distributed at the interface and in the ambient fluid with $\psi ^{*}=\phi ^{*}=1$. When the dimensionless source term ${{j}^{*}}<0$, the desorption is the dominating mechanism for the surfactant mass transfer at the interface; when ${{j}^{*}}=0$, the surfactant mass transfer is zero across the interface; when ${{j}^{*}}>0$, the adsorption is the dominating mechanism for the surfactant mass transfer at the interface.

In this section, numerical simulations are conducted to investigate the influence of the Biot number $Bi$, bulk Péclet number $P{{e}_{b}}$, adsorption number $k$ and adsorption depth $h$ on the droplet deformation under a 2-D shear flow, which is illustrated in figure 1(a). Initially, a circular droplet with radius $R=50$ is placed in the centre of the computational domain, which has a size of $[-6R,6R]\times [-2R,2R]$. The Reynolds number is taken as $Re=0.1$ to meet the Stokes flow condition, the capillary number is set as $Ca=0.2$, and the viscosity ratio $\lambda =1$. The densities of the two fluids are $\rho ^{R0} =\rho ^{B0}=1$. The Langmuir EOS is employed with $\sigma _0 = 0.001$, ${{x}_{in}}=0.3$ and ${{E}_{0}}=0.5$, and the interface Péclet number is $P{{e}_{i}}=10$. Under such parametric conditions, the droplet would eventually deform into an ellipse-like shape with semi-major axis $a$ and semi-minor axis $b$, and the droplet deformation can be quantified by the deformation parameter, which is defined as ${{D}_{f}}={( a-b )}/{( a+b )}$ (Taylor Reference Taylor1934). In what follows, all the simulation results refer to the steady-state values unless otherwise stated.

3.1. Influence of Biot number

The Biot number $Bi={{r}_{d}}/\dot {\gamma }$ is an important indicator of the surfactant mass transfer rate, and its influence on the droplet deformation is studied for $Bi$ ranging from 0 to 10, which are achieved by varying the desorption coefficient ${{r}_{d}}$ and adsorption coefficient ${{r}_{a}}$ at the same time but holding ${{r}_{d}}/{{r}_{a}}$ unchanged. The adsorption number is taken as $k={{x}_{in}}/ (1-{{x}_{in}})=0.429$, which leads to ${{j}^{*}}=0$ at $\tau =0$ ($\tau$ is the dimensionless time defined as $\tau =\dot {\gamma }t$), meaning an initial zero mass transfer of surfactants across the interface. The other parameters are chosen as $P{{e}_{b}}=10$ and $h=0.5$.

Figure 2(a) plots ${{D}_{f}}$ as a function of $Bi$, in which $Bi=0$ corresponds to the insoluble case. As shown in this figure, ${{D}_{f}}$ first increases and then decreases as $Bi$ increases, with the maximum ${{D}_{f}}$ obtained at $Bi=0.1$. To understand the role of the surfactant mass transfer on the average interface surfactant concentration, we present the dimensionless total mass of the interface surfactants $M_{s}^{*}$ for different $Bi$ also in figure 2(a). It is seen that for $Bi=0$, $M_{s}^{*}$ remains almost at 1, indicating no mass transfer of surfactants across the interface; whereas for $Bi>0$, $M_{s}^{*}$ is always larger than 1. This suggests that the adsorption process dominates the dynamics of soluble surfactants as the droplet is elongated, and some interface surfactants are swept to the poles, thus increasing the amount of interface surfactants. In addition, like ${{D}_{f}}$, $M_{s}^{*}$ first increases and then decreases as $Bi$ increases.

Figure 2. (a) The deformation parameter $D_f$ and the dimensionless total mass of interface surfactants $M_{s}^{*}$ as functions of $Bi$; the distributions of (b) the dimensionless source term ${{j}^{*}}$ and (c) the dimensionless interface surfactant concentration ${{\psi }^{*}}$ along the arc length $s$ under various $Bi$; (d) the dimensionless bulk surfactant concentration ${{\phi }^{*}}$ at different $Bi$.

To show the influence of the surfactant solubility on non-uniform effects, when the systems reach the steady state, we present the distributions of the dimensionless source term ${{j}^{*}}$ along the arc length $s$ in figure 2(b), the distributions of the dimensionless interface surfactant concentration ${{\psi }^{*}}$ in figure 2(c) and the distributions of the dimensionless bulk surfactant concentration ${{\phi }^{*}}$ in figure 2(d). Herein, the arc length $s$, measured counterclockwise from the right intersection point (i.e. the point ’$A$’ in figure 1a) between $y=0$ and the droplet interface, is normalized by the initial droplet radius $R$. As shown in figure 2(b), for $Bi=0$, no mass transfer occurs across the interface ($\,j=0$). For $Bi>0$, ${{j}^{*}}$ is negative and the desorption dominates the mass transfer process at the droplet tips or poles; while away from the tips, ${{j}^{*}}$ is positive and the adsorption becomes dominant. In addition, the amplitude of ${{j}^{*}}$ is enhanced with the increase of $Bi$, corresponding to an increased mass transfer rate, which further leads to decreased non-uniform effects of the interface surfactants (see figure 2c) and an increased non-uniformity of the bulk surfactant distribution (figure 2d). It is also seen in figure 2(c) that at low values of $Bi$ ($Bi<0.1$), the non-uniform effects keep nearly the same, but as $Bi$ further increases above 0.1, the non-uniform effects decrease sharply.

As mentioned above, at low values of $Bi$ ($Bi<0.1$), the non-uniform effects change slowly, so the increased $M_{s}^{*}$ dominates the droplet deformation and leads to an increase in ${{D}_{f}}$. As $Bi$ further increases above 0.1, $M_{s}^{*}$ and non-uniform effects both decrease (typically with the minimum ${{\psi }^{*}}$ increasing but maximum ${{\psi }^{*}}$ decreasing), which results in a decrease of ${{D}_{f}}$.

3.2. Influence of bulk Péclet number

The bulk Péclet number $P{{e}_{b}}={{R}^{2}}\dot {\gamma }/{{D}_{b}}$ represents the relative importance of convection to diffusion of the bulk surfactants, and its influence on the droplet deformation is investigated for $P{{e}_{b}}$ ranging from 0.1 to 100, which are achieved by solely varying ${{D}_{b}}$. The other parameters are fixed as $Bi=1$, $h=0.5$ and $k={{x}_{in}}/(1-{{x}_{in}})=0.429$.

Figure 3 shows the deformation parameter ${{D}_{f}}$, the dimensionless total mass of the interface surfactants $M_{s}^{*}$, the distributions of the dimensionless source term ${{j}^{*}}$ and the dimensionless interface surfactant concentration ${{\psi }^{*}}$ along $s$, and the dimensionless bulk surfactant concentration ${{\phi }^{*}}$ for different $P{{e}_{b}}$; the results of insoluble surfactants are also shown for the purpose of comparison. As expected, ${{D}_{f}}$ is larger in the soluble cases than in the insoluble case and, as $P{{e}_{b}}$ increases, ${{D}_{f}}$ decreases continuously. This is because as $P{{e}_{b}}$ increases, the bulk surfactant distribution gets more non-uniform due to weaker bulk diffusion, which prevents the surfactant adsorption from the bulk to the interface at the droplet surface away from the poles, thus producing a decreased average interface surfactant concentration (represented by $M_{s}^{*}$ and shown in figure 3a). On the other hand, as $P{{e}_{b}}$ increases, the amplitude of ${{j}^{*}}$ decreases (see figure 3b), corresponding to a decreased surfactant mass transfer rate and increased non-uniform effects of interface surfactants, as shown in figure 3(c). In this case, $M_{s}^{*}$ dominates the droplet dynamics, and thus, the droplet deformation ${{D}_{f}}$ decreases.

Figure 3. (a) The deformation parameter ${{D}_{f}}$ and the dimensionless total mass of interface surfactants $M_{s}^{*}$ as functions of $P{{e}_{b}}$; the distributions of (b) the dimensionless source term ${{j}^{*}}$ and (c) the dimensionless interface surfactant concentration ${{\psi }^{*}}$ along the arc length $s$ under various $P{{e}_{b}}$; (d) the dimensionless bulk concentration ${{\phi }^{*}}$ under various $P{{e}_{b}}$.

3.3. Influence of adsorption number

The adsorption number $k={{r}_{a}}{{\phi }_{0}}/{{r}_{d}}$ is a dimensionless parameter closely related to the initial adsorption and desorption states of surfactants. For $k<{{x}_{in}}/(1-{{x}_{in}})=0.429$, the initial source term ${{j}^{*}}<0$, indicating a dominant desorption process over the interface at the initial stage of the simulation; whereas for $k>0.429$, ${{j}^{*}}>0$ and the adsorption process dominates at $\tau =0$. In this section, $k$ varies from 0.1 to 1 by increasing ${{r}_{a}}$ alone, and the other parameters are taken as $Bi=1$, $P{{e}_{b}}=10$ and $h=0.5$.

Since $k$ affects the initial mass transfer of surfactants, in figure 4(a) we present the distributions of the dimensionless source term ${{j}^{*}}$ along the arc length at different time $\tau$ for $k= 0.1$, 0.429, 0.6 and 1. It is seen that, for $k=0.1$, initially, ${{j}^{*}}<0$ throughout the droplet interface, suggesting that the desorption dominates; as time passes by, the overall ${{j}^{*}}$ increases due to desorption, and an equilibrium state is finally achieved with ${{j}^{*}}<0$ at the droplet poles (desorption) and ${{j}^{*}}>0$ at the equator (adsorption). For $k=0.429$, ${{j}^{*}}=0$ at $\tau =0$, revealing an initially quasi-equilibrium configuration. In this case, the interface surfactant concentration increases at the droplet poles but decreases at the equator, and at equilibrium we also find that ${{j}^{*}}<0$ at the poles and ${{j}^{*}}>0$ at the equator. For $k=0.6$ and 1, ${{j}^{*}}>0$ at the beginning; as time passes by, ${{j}^{*}}$ decreases gradually, and finally we still get ${{j}^{*}}<0$ at the poles and ${{j}^{*}}>0$ at the equator. Interestingly, we notice that the difference between ${{j}^{*}}$ distributions at different values of $k$ reduces as the droplet evolves towards the equilibrium state, and eventually the influence of $k$ on non-uniform effects can be negligible.

Figure 4. (a) The distributions of the dimensionless source term ${{j}^{*}}$ and (b) the dimensionless interface concentration ${{\psi }^{{*}}}$ along the arc length $s$ for various $k$ at different times.

In figures 4(b) and 5 we plot the evolution of the distribution of ${{\psi }^{*}}$ along the arc length $s$ and the distribution of ${{\phi }^{*}}$ in the computational domain for different $k$. It is observed that the interface and bulk surfactant distributions are initially of unity for all $k$, and then the high- and low-concentration regions are formed at the poles and equators, respectively, for both interface and bulk surfactants. In addition, the average interface and bulk surfactant concentrations vary significantly for different $k$. Specifically, for $k=0.1$, the surfactant desorption dominates; ${{\phi }^{*}}$ first increases in the neighbourhood of the interface, and then, the high surfactant concentration spreads to the whole domain due to diffusion, leading to an overall increase of ${{\phi }^{*}}$ and a decrease of ${{\psi }^{*}}$. For $k=0.429$, as the droplet deforms, the high- and low-concentration regions are formed at the droplet poles and equator, respectively, and a relatively small change of the average interface and bulk surfactant concentrations is observed. For $k=0.6$ and 1, the surfactants are initially absorbed onto the interface, and then a low bulk concentration region appears in the neighbourhood of the interface that later diffuses to the whole domain. As a result, the overall ${{\phi }^{*}}$ decreases and ${{\psi }^{*}}$ increases.

Figure 5. The distributions of the bulk surfactant concentration ${{\phi }^{*}}$ at different times for (a) $k=0.1$, (b) $k=0.428$, (c) $k=0.6$ and (d) $k=1$.

In figure 6 we present ${{D}_{f}}$ and $M_{s}^{*}$ at different values of $k$ and find that as $k$ increases, $M_{s}^{*}$ increases, leading to an increase in ${{D}_{f}}$. It is also noticed that as $k$ changes from 0.1 to 1, ${{D}_{f}}$ increases from 0.310 to 0.376, with an increment up to $20.92\,\%$.

Figure 6. The deformation parameter ${{D}_{f}}$ and the dimensionless total mass of interface surfactants $M_{s}^{*}$ versus the adsorption number $k$.

3.4. Influence of adsorption depth

In this section the effect of the adsorption depth $h={{\psi }_{0}}/({{\phi }_{0}}R)$ on droplet deformation is investigated for $h$ varying from 0.1 to 1. Different values of $h$ are achieved by varying ${{\phi }_{0}}$, and ${{r}_{a}}$ should be changed accordingly to keep a constant ${{\phi }_{0}}{{r}_{a}}$. The other parameters are chosen as $Bi=1$, $P{{e}_{b}}=10$ and $k=0.429$.

In figure 7 we plot ${{D}_{f}}$ and $M_{s}^{*}$ as functions of $h$, and the distributions of ${{j}^{*}}$, ${{\psi }^{*}}$ and ${{\phi }^{*}}$ at different values of $h$. As shown in figure 7(a), as $h$ increases, $M_{s}^{*}$ and ${{D}_{f}}$ decrease. This is because as the adsorption depth $h$ increases, ${{r}_{a}}$ increases but ${{\phi }_{0}}$ decreases, indicating a decreased bulk surfactant concentration but a faster adsorption rate. With a faster adsorption rate from the bulk phase, a decreased bulk concentration in the vicinity of the droplet equator, as observed in figure 7(d), could hinder the further adsorption from the bulk phase. As a result, $M_{s}^{*}$ decreases with the increase of $h$. In addition, it can be seen in figure 7(b) that with increasing $h$, the amplitude of ${{j}^{*}}$ decreases, leading to the decrease of the surfactant mass transfer rate and, thus, to the increase of the non-uniform effects of interface surfactants, as shown in figure 7(c). In this case, $M_{s}^{*}$ dominates the droplet behaviour, so the droplet deformation ${{D}_{f}}$ decreases as $h$ increases.

Figure 7. (a) The deformation parameter ${{D}_{f}}$ and the dimensionless total mass of interface surfactants $M_{s}^{*}$ as functions of $h$; the distributions of (b) the dimensionless source term ${{j}^{*}}$ and (c) the dimensionless interface surfactant concentration ${{\psi }^{*}}$ along the arc length $s$ under various $h$; (d) the dimensionless bulk surfactant concentration ${{\phi }^{*}}$ under various $h$.

3.5. Summary of the influences of bulk surfactant parameters

By investigating the influences of various bulk surfactant parameters on droplet deformation, we have shown that the dimensionless total mass of the interface surfactants $M_{s}^{*}$ and the dimensionless source term ${{j}^{*}}$ can be good indicators for the variation of the average interface surfactant concentration and non-uniform effects. The increase of $M_{s}^{*}$ enhances the average interface surfactant concentration, while the increase of the amplitude of ${{j}^{*}}$ promotes the surfactant mass transfer rate, thus weakening non-uniform effects of interface surfactants. In most cases, $M_{s}^{*}$ determines the change of ${{D}_{f}}$. In addition, we summarize the minimum ($D_{f}^{min}$) and maximum ($D_{f}^{max}$) deformation parameters obtained from the simulations and their relative change in table 2. It can be seen that all the bulk surfactant parameters, including $Bi$, $P{{e}_{b}}$, $k$ and $h$, influence the droplet deformation but their influences are different. Specifically, the influences of $Bi$, $P{{e}_{b}}$ and $h$ are relatively small with the relative ${{D}_{f}}$ changes below $3\,\%$, while $k$ has a pronounced effect on the deformation with the relative ${{D}_{f}}$ change as high as $20.92\,\%$. This indicates that ${{D}_{f}}$ can be effectively controlled by varying $k$, and thus, in the following 3-D simulations, $k$ is varied to represent different solubilities of surfactants.

Table 2. The minimum and maximum deformation parameters and their relative change for different bulk surfactant parameters.

Finally, it is interesting to show the connection between the bulk surfactant parameters used in our investigation and those used in existing experiments. Recently, Kalogirou & Blyth (Reference Kalogirou and Blyth2020) summarized the typical values of the properties of fluids and surfactants and the ranges of dimensionless parameters in existing experiments, from which one can obtain the ranges of the bulk surfactant parameters involved in experiments: $P{{e}_{b}}$ in the range of $1\unicode{x2013}{{10}^{7}}$, $Bi$ in the range of ${{10}^{-9}}\unicode{x2013}{{10}^{1}}$, $k$ in the range of ${{10}^{-11}}\unicode{x2013}{{10}^{1}}$ and $h$ in the range of ${{10}^{-4}}\unicode{x2013}{{10}^{3}}$. In this section we have investigated the impact of dimensionless parameters on the droplet behaviour for $P{{e}_{b}}$ ranging from 0.1 to 100, $Bi$ ranging from 0.01 to 10, $k$ ranging from 0.1 to 1 and $h$ ranging from 0.1 to 1. It is clear that the bulk surfactant parameters used in our investigation all fall within the ranges of the previous experimental parameters except for $P{{e}_{b}}=0.1$, which is slightly lower than the lower bound of $P{{e}_{b}}=1$ in experiments. Although $P{{e}_{b}}=0.1$ may have rarely happened in realistic surfactant systems, it was still investigated numerically in the literature (Severino, Campana & Giavedoni Reference Severino, Campana and Giavedoni2005; Xu et al. Reference Xu, Li, Lowengrub and Zhao2006; Shang et al. Reference Shang, Luo, Bai, He and Hu2024), which can provide additional perspectives for understanding surfactant dynamics and their control mechanisms.

4. Deformation and breakup of a surfactant-laden droplet in 3-D shear flow

In this section we investigate the droplet deformation and breakup under 3-D shear flow for different values of $Ca$ and $\lambda$ in clean, insoluble-surfactant and soluble-surfactant ($k=0.429$ and 1) systems. As shown in figure 1(b), a 3-D droplet with an initial radius $R$ is placed halfway between two parallel walls that are separated by a distance $H$. The upper and lower walls move with opposite velocities of ${{u}_{w}}$ and $-{{u}_{w}}$ so that a constant shear rate $\dot {\gamma }=2{{u}_{w}}/H$ is created. The halfway bounce-back schemes are applied at the upper and lower walls to realize no-slip boundary conditions, while periodic boundary conditions are imposed at the left and right boundaries as well as at the front and back boundaries.

The simulations are run in a $L\times W\times H=240\times 160\times 100$ lattice domain with $R=25$, and a fixed Reynolds number of $Re=0.1$ is considered unless otherwise mentioned. Our recent test indicated that the grid resolution with $R=25$ is fine enough to produce grid-independent results in a two-phase system with soluble surfactants (Ba et al. Reference Ba, Liu, Li and Yang2023), and it is thus used in the present 3-D simulations to minimize the computational cost. The Langmuir EOS is employed with $\sigma _{0}=0.001$, ${{x}_{in}}=0.3$ and ${{E}_{0}}=0.5$, and the interface Péclet number is $P{{e}_{i}}=10$. Like in the last section, the densities of both fluids are chosen as $\rho ^{R0} =\rho ^{B0}=1$ and, initially, the interface and bulk surfactants are assumed to be uniformly distributed at the interface and in the ambient fluid with $\psi ^{*}=\phi ^{*}=1$.

In the present LB-FD simulations, all the parameters are presented in lattice unit, which can be converted into the physical parameters by using three reference scales, namely the time scale ${{T}_{0}}$, the length scale ${{L}_{0}}$ and the mass scale ${{M}_{0}}$. Here, we take the typical case with the lattice parameters $R=25$, ${{\rho }^{R0}}={{\rho }^{B0}}=1$, ${{\mu }^{R0}}={{\mu }^{B0}}=0.158$ and ${{\sigma }_{0}}=0.001$ (the corresponding dimensionless parameters are $Re=0.1$, $\lambda =1$ and $Ca=0.1$) as an example to show the conversion. To convert the lattice parameters to the physical parameters, three reference scales are taken as ${{T}_{0}}=7.6\times {{10}^{-9}}\ \text {s}$, ${{L}_{0}}=1.28\times {{10}^{-6}}\ \text {m}$ and ${{M}_{0}}=1\times {{10}^{-15}}\ {\rm kg}$. A physical parameter with dimensions ${{[\text {s}]}^{n1}}{{[\text {m}]}^{n2}}{{[\ {\rm kg}]}^{n3}}$ can then be obtained by multiplying the corresponding lattice parameter by ${{[{{T}_{0}}]}^{n1}}{{[{{L}_{0}}]}^{n2}}{{[{{M}_{0}}]}^{n3}}$. Therefore, one can obtain the physical values of the droplet radius, the fluid densities, dynamic viscosities and the interfacial tension: ${{R}_{p}}=R{{L}_{0}}=32\,\mathrm {\mu }\text {m}$, $\rho _{p}^{R0}=\rho _{p}^{B0}={{\rho }^{R0}}{{M}_{0}}L_{0}^{-3}=880\ {\rm kg}\ {{{\text {m}}^{-3}}}$, $\mu _{p}^{R0}=\mu _{p}^{B0}={{\mu }^{R0}}{{M}_{0}}L_{0}^{-1}T_{0}^{-1}=0.03\ \text {Pa}\ \text {s}$, ${{\sigma }_{0p}}={{\sigma }_{0}}{{M}_{0}}T_{0}^{-2}=0.032\,{\text {N}}\ \text {m}^{-1}$, where the subscript ‘$p$’ corresponds to the physical parameter and it is added to differentiate from the lattice parameter.

4.1. Droplet deformation

For a clean droplet in simple shear flow, Vananroye et al. (Reference Vananroye, Van Puyvelde and Moldenaers2007) found that in the Stokes flow regime, the droplet deformation can be accurately predicted by the MMSH model, which is a combination of the Maffettone & Minale (Reference Maffettone and Minale1998) and Shapira & Haber (Reference Shapira and Haber1990) models, when $Ca\le 0.3$. Liu et al. (Reference Liu, Ba, Wu, Li, Xi and Zhang2018) found that the presence of insoluble surfactants enhances the droplet deformation in a simple shear flow, and the contribution of surfactants increases with $Ca$. Later, Liu et al. (Reference Liu, Zhang, Ba, Wang and Wu2020) focused on the deformation and breakup of a 3-D droplet on a solid surface subject to shear flow, and showed that the addition of insoluble surfactants always promotes droplet breakup regardless of viscosity ratio and the promoting effect is more pronounced at low viscosity ratios. Here, we investigate how soluble surfactants influence the droplet behaviour at various $Ca$ and $\lambda$.

Figure 8(a) shows the evolution of the deformation parameter ${{D}_{f}}$ for $Ca=\{ 0.1, 0.2, 0.3 \}$ and $\lambda =1$ in the clean, insoluble-surfactant and soluble-surfactant ($k=0.429$ and 1) cases, and the steady state ${{D}_{f}}$ vs $Ca$ is plotted in figure 8(b), where the deformation parameters for the clean, insoluble-surfactant and soluble-surfactant cases are denoted as ${{D}_{f0}}$, ${{D}_{f1}}$ and ${{D}_{f2}}$ for description convenience. In addition, the corresponding steady-state droplet shapes in the surfactant cases are plotted in figure 9, where the droplet surface is coloured by the dimensionless interface surfactant concentration ${{\psi }^{*}}$. As shown in figure 8(a), ${{D}_{f}}$ first increases and then evolves to a steady value for all the cases except the soluble-surfactant case with $k=1$ and $Ca=0.3$, in which the droplet eventually breaks into two parts (see figure 9l) and, thus, we only show the evolution of ${{D}_{f}}$ before the breakup occurs. When the droplet can reach the steady state, the steady-state deformation value increases with $Ca$, and the surfactants prefer to accumulate at the tips of the droplet where the interface surfactant concentration is the highest (figure 9g). For a fixed $Ca$, the addition of surfactants always enhances the droplet deformation, but the enhancement of ${{D}_{f}}$ varies with the surfactant type and $k$. For the insoluble case and the soluble case with $k=0.429$, ${{D}_{f}}$ varies slightly. This is because the soluble case with $k=0.429$ corresponds to the state where the surfactant desorption and adsorption balance and, thus, the surfactant mass exchange between the interface and the bulk can be roughly ignored, like in the insoluble case. For the soluble case with $k=1$, ${{D}_{f}}$ needs a much longer time to achieve the steady state, and ${{D}_{f}}$ is greatly enhanced, compared with the insoluble case and the soluble case with $k=0.429$.

Figure 8. (a) The evolution of ${{D}_{f}}$ at $Ca=\{ 0.1, 0.2, 0.3 \}$, (b) ${{D}_{f}}$ vs $Ca$ for $\lambda =1$ in the clean, insoluble and soluble ($k=0.429$ and 1) systems. For the evolution of ${{D}_{f}}$ at $Ca=0.3$ in the soluble system with $k=1$, we only show the results before droplet breakup. In (b) the predictions from the MMSH model are also shown for comparison, and an inset is included to show the increment of ${{D}_{f}}$ caused by insoluble surfactants (denoted as ${{\delta }_{1}}$) and the increment caused by solubility (denoted as ${{\delta }_{2}}$) under various $Ca$.

Figure 9. (a) The steady droplet shapes or the droplet shape after the breakup for $Ca=\{ 0.1, 0.2, 0.3 \}$ and $\lambda =1$ in the clean, insoluble and soluble ($k=0.429$ and 1) systems. The droplet surface is coloured by the dimensionless interface surfactant concentration for systems with surfactants. In each graph, the maximum and minimum values of the interface surfactant concentration are labelled. Note that the droplet eventually breaks up into two parts in (l). Results are shown for (a) $Ca = 0.1$, clean; (b) $Ca = 0.2$, clean; (c) $Ca = 0.3$, clean; (d) $Ca = 0.1$, insoluble; (e) $Ca = 0.2$, insoluble; (f) $Ca = 0.3$, insoluble; (g) $Ca = 0.1, k = 0.429$; (h) $Ca = 0.2, k = 0.429$; (i) $Ca = 0.3, k = 0.429$; (j) $Ca = 0.1, k = 1$; (k) $Ca = 0.2, k = 1$; (l) $Ca = 0.3, k = 1$.

As shown in figure 8(b), the simulated ${{D}_{f}}$ values all agree well with the predictions from the MMSH model in the clean case. In the presence of surfactants, ${{D}_{f}}$ is enhanced for all the $Ca$ values considered, and the increased deformation $\delta ={{D}_{f2}}-{{D}_{f0}}$ consists of two parts: (1) the insoluble part ${{\delta }_{1}}={{D}_{f1}}-{{D}_{f0}}$, which is attributed to the decrease of the interfacial tension induced by the average interface surfactant concentration, and non-uniform effects (Liu et al. Reference Liu, Ba, Wu, Li, Xi and Zhang2018) caused by the non-uniform capillary forces and Marangoni stresses; and (2) the soluble part ${{\delta }_{2}}={{D}_{f2}}-{{D}_{f1}}$, which is attributed to the change of the average interface surfactant concentration and surfactant distribution caused by the adsorption and desorption at the interface. For the insoluble case, ${{\delta }_{1}}$ increases monotonously with $Ca$, consistent with the previous results of Liu et al. (Reference Liu, Ba, Wu, Li, Xi and Zhang2018). For the soluble case with $k=0.429$, ${{\delta }_{2}}$ is nearly zero owing to the balance between the surfactant desorption and adsorption, whereas for $k=1$, ${{\delta }_{2}}$ is greatly enhanced, because a higher $k$ favours the adsorption process, leading to a much higher average interface surfactant concentration.

In figure 10 we present the dimensionless total mass of interface surfactants $M_{s}^{*}$ and the minimum and maximum values of interface surfactant concentration (i.e. $\psi _{min}^{*}$ and $\psi _{max}^{*}$) in the steady state. It is seen in figure 10(a) that in the insoluble case and the soluble case with $k=0.429$, $M_{s}^{*}$ is equal or close to 1, indicating negligible surfactant mass transfer between the bulk and the interface. As $k$ changes from 0.429 to 1, $M_{s}^{*}$ is increased by nearly $50\,\%$ due to a dominant adsorption at the interface, leading to the greatly enhanced ${{D}_{f}}$ in figure 8(b). In addition, we note that $M_{s}^{*}$ increases with $Ca$, since the dilution of interface surfactants at large $Ca$ favours the surfactant adsorption and suppresses the desorption at the interface. In figure 10(b) it is observed that as surfactants change from the insoluble case to the soluble case with $k=0.429$, the minimum interface surfactant concentration $\psi _{min }^{*}$ increases but the maximum interface surfactant concentration $\psi _{max}^{*}$ decreases; while as $k$ increases from 0.429 to 1, both $\psi _{min }^{*}$ and $\psi _{max}^{*}$ increase. From these three cases, the non-uniform effects, represented by $\psi _{max}^{*}-\psi _{min }^{*}$, is the highest in the insoluble case, and it changes little as $k$ changes from 0.429 to 1.

Figure 10. (a) The dimensionless total mass of interface surfactants $M_{s}^{*}$, and (b) the minimum and maximum values of interface surfactant concentration ($\psi _{min}^{*}$ and $\psi _{max}^{*}$) for various $Ca$ in the insoluble and soluble ($k=0.429$ and 1) systems at $\lambda =1$.

In figures 11 and 12 we plot ${{D}_{f}}$, $M_{s}^{*}$, $\psi _{min}^{*}$ and $\psi _{max}^{*}$ as functions of $Ca$ for the viscosity ratios of 0.3 and 5. In figure 11 the predictions from the MMSH model at $\lambda =0.3$ and 5 are also shown for comparison, and it is seen that the simulated ${{D}_{f}}$ values in the clean case match perfectly with the MMSH predictions. As shown in figure 11(a), at $\lambda = 0.3$, the droplet deformation is higher in the insoluble system (${{D}_{f1}}$) than in the soluble system with $k=0.429$ (${{D}_{f2}}$). The increment caused by the solubility ${{\delta }_{2}}={{D}_{f2}}-{{D}_{f1}}<0$ and $| {{\delta }_{2}} |$ increases with $Ca$. This is because although $M_{s}^{*}$ is larger in the soluble system with $k=0.429$, non-uniform effects are more pronounced in the insoluble system (figure 12a,b), which dominate the droplet deformation, thereby resulting in a negative ${{\delta }_{2}}$; and as $Ca$ increases, non-uniform effects increase rapidly in the insoluble system (figure 12b), leading to the increase of $| {{\delta }_{2}} |$ with $Ca$. In the soluble system with $k=1$, $M_{s}^{*}$ is much larger than in the other two systems, and thus, ${{D}_{f}}$ is higher. In figure 11(b) we find that at $\lambda =5$ the ${{D}_{f}}$ values obtained in the insoluble system and in the soluble system with $k=0.429$ are nearly the same for all $Ca$, which is attributed to their similar $M_{s}^{*}$ and the relatively weak non-uniform effects, as shown in figure 12(c,d); while in the soluble system with $k=1$, ${{D}_{f}}$ becomes much higher due to the remarkably enhanced $M_{s}^{*}$.

Figure 11. Plots of ${{D}_{f}}$ vs $Ca$ in the clean, insoluble and soluble ($k=0.429$ and 1) systems for (a) $\lambda =0.3$ and (b) $\lambda =5$, where the predictions from the MMSH model are also shown for comparison. In (a,b) an inset is included to show the increment of ${{D}_{f}}$ caused by the insoluble surfactant (denoted as ${{\delta }_{1}}$) and the increment caused by the solubility (denoted as ${{\delta }_{2}}$) under various $Ca$.

Figure 12. (a) The dimensionless total mass of interface surfactants and (b) the minimum and maximum values of interface surfactant concentration ($\psi _{min }^{*}$ and $\psi _{max}^{*}$) versus $Ca$ in the insoluble and soluble ($k=0.429$ and 1) systems for $\lambda =0.3$; (c) $M_{s}^{*}$ and (d) $\psi _{min }^{*}$ and $\psi _{max}^{*}$ vs $Ca$ in the insoluble and soluble ($k=0.429$ and 1) systems for $\lambda =5$.

Figure 13 presents the steady droplet shapes in the clean, insoluble and soluble ($k=0.429$ and 1) systems for $\lambda =\{ 0.3, 1, 5 \}$. As shown in this figure, as $\lambda$ changes from 1 to 0.3, the steady droplet shape and ${{D}_{f}}$ change slightly, but non-uniform effects become more pronounced for all the cases investigated (see figures 10b and 12b). Specifically, in the insoluble system the droplet deformation is larger at $\lambda =0.3$ than at $\lambda =1$ due to the enhanced non-uniform effects. In the soluble system, non-uniform effects are still more pronounced at $\lambda =0.3$, but the corresponding $M_{s}^{*}$ is lower (see figures 10a and 12a); under the combined influence of non-uniform effects and $M_{s}^{*}$, at $\lambda = 0.3$, we find a slightly smaller ${{D}_{f}}$ for $k=0.429$ but a slightly larger ${{D}_{f}}$ for $k=1$. Note that an exception occurs in the case of $Ca=0.3$, $k=1$ and $\lambda = 1$ where the droplet cannot reach a steady deformation but eventually break into two daughter droplets, and this will be discussed in the next subsection. In addition, it can be observed in figures 10, 12 and 13 that compared with the results at $\lambda =1$ and $\lambda = 0.3$, at $\lambda = 5$, ${{D}_{f}}$, $M_{s}^{*}$ and non-uniform effects are overall smaller or weaker, and these values increase slowly with the increase of $Ca$, which leads to very small ${{D}_{f}}$ for the whole range of $Ca$.

Figure 13. The final droplet shapes for $Ca=\{ 0.1, 0.2, 0.3 \}$ in the clean, insoluble and soluble ($k=0.429$ and 1) systems at $\lambda =\{ 0.3, 1, 5 \}$, in which the red solid lines, the blue dashed lines and the green dash-dotted lines represent the droplet interfaces at $\lambda =1$, $\lambda =0.3$ and $\lambda =5$, respectively. Results are shown for (a) $Ca = 0.1$, clean; (b) $Ca = 0.2$, clean; (c) $Ca = 0.3$, clean; (d) $Ca = 0.1$, insoluble; (e) $Ca = 0.2$, insoluble; (f) $Ca = 0.3$, insoluble; (g) $Ca = 0.1, k = 0.429$; (h) $Ca = 0.2, k = 0.429$; (i) $Ca = 0.3, k = 0.429$; (j) $Ca = 0.1, k = 1$; (k) $Ca = 0.2, k = 1$; (l) $Ca = 0.3, k = 1$.

To sum up, in the insoluble system, as the viscosity ratio $\lambda$ increases, non-uniform effects weaken, leading to a monotonic decrease of ${{D}_{f}}$, unlike a droplet in the clean system where ${{D}_{f}}$ first increases slightly and then decreases with $\lambda$ (Maffettone & Minale Reference Maffettone and Minale1998; Vananroye et al. Reference Vananroye, Van Puyvelde and Moldenaers2007). On the other hand, in the soluble system, under the combined action of $M_{s}^{*}$ and non-uniform effects, with the increase of $\lambda$, ${{D}_{f}}$ first increases slightly and then decreases for $k=0.429$, but decreases monotonously for $k=1$.

To predict the deformation parameter $D_f$ in the shear system with soluble surfactants, a simple way is to replace the capillary number $Ca$ with the effective capillary number $C{{a}_{e}}$ in the MMSH model, where the effective capillary number is defined as $C{{a}_{e}}=Ca/[1+{{E}_{0}}\ln (1-{{x}_{in}}{{M}_{s}})]$. The prediction model obtained in such a way is called the modified MMSH model and, clearly, the modified MMSH model has taken into account the influence of ${{M}_{s}}$ that mainly affects the effective interfacial tension. Figure 14 shows the comparison between the simulated deformation parameters ($D_f$) and those predicted from the modified MMSH model ($D_{f,M}$) for three different viscosity ratios. It is seen that for $\lambda =0.3$, the difference between $D_f$ and $D_{f,M}$ is the largest, which is followed by $\lambda =1$, and when $\lambda$ is increased to $5$, $D_{f,m}$ agrees well with the simulated $D_{f}$ with a maximum relative error of $4.71\,\%$. This suggests that the modified MMSH model is only suitable for predicting droplet deformation at high viscosity ratios, which is easily understandable because the modified MMSH model has not incorporated the influence of non-uniform effects and non-uniform effects can be ignored only at high viscosity ratios (see figure 12b,d). To predict the droplet deformation at low and moderate viscosity ratios, non-uniform effects should be properly quantified, which we would like to do in future work.

Figure 14. The steady-state deformation parameter as a function of $Ca_e$ in the insoluble and soluble ($k=0.429$ and 1) systems for (a) $\lambda =0.3$, (b) $\lambda =1$ and (c) $\lambda =5$. The filled symbols represent the simulation results ($D_f$) while the hollow symbols represent the predictions from the modified MMSH model ($D_{f,M}$).

4.2. Droplet breakup

As $Ca$ increases above a critical value, the droplet no longer reaches a steady deformation but breaks up, and the critical value is called the critical capillary number of droplet breakup, denoted as $C{{a}_{cr}}$. In simple shear flow, $C{{a}_{cr}}$ is often quantified as the function of the viscosity ratio and confinement ratio (Janssen et al. Reference Janssen, Vananroye, Van Puyvelde, Moldenaers and Anderson2010). Liu et al. (Reference Liu, Ba, Wu, Li, Xi and Zhang2018) showed that the presence of insoluble surfactants tends to reduce $C{{a}_{cr}}$. Complementing the previous works, we study the influence of soluble surfactants on $C{{a}_{cr}}$ under various viscosity ratios and Reynolds numbers. In the simulations the height of the computational domain is set as $H=4R$ with $R=25$ so that the confinement ratio is $2R/H=0.5$, and the domain length and width are set as $10R$ and $6R$, respectively. As previously done in Liu et al. (Reference Liu, Ba, Wu, Li, Xi and Zhang2018), we increase $Ca$ by 0.01 at a time, and the lowest $Ca$ at which the droplet breaks up is considered as $C{{a}_{cr}}$.

Figure 15 presents $C{{a}_{cr}}$ for different viscosity ratios $\lambda$ in the clean, insoluble and soluble ($k=0.429$ and 1) systems, where insets are included to show snapshots of the droplet shapes just before and after breakup. It is seen that in each case, $C{{a}_{cr}}$ first decreases and then increases as $\lambda$ increases. The addition of surfactants always promotes the droplet breakup and for a fixed $\lambda$, $C{{a}_{cr}}$ is slightly smaller in the soluble case with $k=0.429$ than in the insoluble case, which is because in the soluble case the interface surfactant concentration in the necking region is increased, accelerating the necking process (see the ${{\psi }^{*}}$ distributions at the droplet surface before breakup in figure 15). In addition, increasing $k$ from 0.429 to 1 favours the droplet breakup, consistent with the droplet deformation trend shown previously in § 4.1.

Figure 15. Plot of $C{{a}_{cr}}$ for different viscosity ratios in the clean, insoluble and soluble ($k=0.429$ and 1) systems. The insets are included to show the droplet shapes immediately before and after droplet breakup, and the droplet surface is coloured by ${{\psi }^{*}}$ in both insoluble and soluble systems.

In figure 16 we plot the snapshots of the droplet breakup process in the clean, insoluble and soluble ($k=0.429$ and 1) systems for $\lambda =1$, and for the surfactant cases, we present the distributions of the dimensionless interface surfactant concentration ${{\psi }^{*}}$ along the arc length in the $x$$z$ mid-plane at different dimensionless time $\tau$ in figure 17. As shown in figure 16, we can see that the droplet experiences the stretching and necking stages before breakup. For insoluble surfactants, we can see in figure 17(a) that in the initial stretching stage ($\tau \le 10$), $\psi _{max}^{*}$ occurs near the droplet poles while $\psi _{min }^{*}$ at the equator of the droplet; the maximum interface surfactant concentration $\psi _{max}^{*}$ first increases to 2.056 then decreases slightly to 2.017, and the minimum interface surfactant concentration $\psi _{min }^{*}$ decreases. After the stretching stage, $\psi _{min }^{*}$ starts to migrate from the equator towards the poles at $\tau =19$, and a neck gradually forms in the middle of the droplet, where a local maximum interface surfactant concentration $\psi _{neck}^{*}$ appears, which promotes the thinning of the neck. At the same time, $\psi _{max}^{*}$ decreases severely from 2.017 at $\tau =19$ to 1.508 at $\tau =54.4$ (with a decrease of about $25\,\%$) while $\psi _{min }^{*}$ almost keeps at 0.45, exhibiting a severe dilution of the interface surfactants. The necking stage almost ends at $\tau =54.4$, when $\psi _{neck}^{*}$ increases to 0.917; finally, the droplet breaks up into two daughter droplets at $\tau =55$. For the soluble surfactants with $k=0.429$ (figure 17b), in the stretching stage ($\tau \le 10$), $\psi _{max}^{*}$ increases to 1.621, and $\psi _{min }^{*}$ decreases to around 0.59; $\psi _{max}^{*}$ is lower than in the insoluble case, but $\psi _{min }^{*}$ is higher, which is caused by the surfactant adsorption and desorption at the interface. In the necking stage, $\psi _{max}^{*}$ decreases from 1.621 to 1.473, with a decrease of about $10\,\%$, which is much smaller than that in the insoluble case, while $\psi _{min }^{*}$ holds almost constant. This means that in the soluble case an increased $M_{s}^{*}$ and a reduced non-uniformity of surfactants are observed compared with the insoluble case. In addition, before the droplet breaks up, $\psi _{neck}^{*}$ increases to 1.127 at $\tau =62.4$, much higher than in the insoluble case. Therefore, the surfactant dilution is effectively supplemented by the bulk surfactants, and the increase of $\psi _{neck}^{*}$ reduces the interfacial tension in the neck region, which both contribute to the droplet breakup. As $k$ increases to 1 (see figure 17c), $\psi _{max}^{*}$ increases to 2.108 and $\psi _{min }^{*}$ holds at around 0.9 in the stretching stage. In the necking stage, $\psi _{max}^{*}$ decreases with a decrement within $10\,\%$ while $\psi _{min }^{*}$ remains roughly a constant, and $\psi _{neck}^{*}$ increases to 1.524, much higher than the other two cases. Thus, with the higher average interface surfactant concentration and $\psi _{neck}^{*}$, $C{{a}_{cr}}$ decreases to 0.3.

Figure 16. The snapshots of droplet breakup for $\lambda =1$ in (a) the clean system with $C{{a}_{cr}}=0.392$, (b) the insoluble system with $C{{a}_{cr}}=0.34$, (c) the soluble system ($k=0.429$) with $C{{a}_{cr}}=0.33$ and (d) the soluble system ($k=1$) with $C{{a}_{cr}}=0.3$. Note that in (bd) the droplet surface is coloured by the dimensionless interface surfactant concentration ${{\psi }^{*}}$.

Figure 17. The distributions of the dimensionless interface surfactant concentration ${{\psi }^{*}}$ along the arc length $s$ in the $x$$z$ mid-plane at different dimensionless time $\tau$ in (a) the insoluble case, (b) the soluble case with $k=0.429$ and (c) the soluble case with $k=1$. The viscosity ratios are all taken as $\lambda =1$, and the critical capillary numbers are exactly the same as those in figure 16(bd). Note that the pink and blue filled circles are to highlight the droplet tips and the necking regions, respectively.

In figure 18 we present the distributions of ${{\psi }^{*}}$ along the arc length $s$ at the $x$$z$ mid-plane in the insoluble and soluble ($k=0.429$ and 1) systems for $\lambda =0.3$ and $\lambda =5$. At $\lambda =0.3$, the breakup process is similar to that at $\lambda =1$, both experiencing the stretching and necking stages, but the necking stage lasts for a shorter period; the surfactant distributions are also similar to those at $\lambda =1$ for each case, but non-uniform effects are generally more pronounced than at $\lambda =1$, which hinders the increase of $\psi _{neck}^{*}$, and thus, increases $C{{a}_{cr}}$ for each case.

Figure 18. The distributions of the dimensionless interface surfactant concentration ${{\psi }^{*}}$ along the arc length in the $x$$z$ mid-plane at different dimensionless time $\tau$ for (a) $\lambda =0.3$ and (b) $\lambda =5$. Note that the pink and blue filled circles are to highlight the droplet tips and the necking regions, respectively.

At $\lambda =5$, the droplet breakup exhibits a significant difference. We take the soluble case with $k=1$, $\lambda =5$ and $C{{a}_{cr}}=0.58$ as an example, and the corresponding snapshots of the droplet shape and ${{D}_{f}}$ evolution are shown in figure 19. As seen in this figure, ${{D}_{f}}$ first increases rapidly to around 0.5 and then increases at a much lower speed until the breakup occurs, and the necking stage lasts very long since the droplet is exposed to weak shear flow due to a low inclination angle in this case. In figure 18(b) we can clearly observe that non-uniform effects are relatively weak at $C{{a}_{cr}}$ for all cases. Specifically, in the insoluble case the non-uniformity of interface surfactants is small, with $\psi _{max}^{*}-\psi _{min }^{*}=0.88$ at $\tau =5$, and decreases significantly in the necking stage (e.g. $\psi _{max}^{*}-\psi _{min }^{*}=0.33$ at $\tau =50$); when approaching the end of the necking stage ($\tau =80.75$), $\psi _{max}^{*}-\psi _{min }^{*}$ reduces to around 0.27 under the effect of dilution, and $\psi _{neck}^{*}$ is close to $\psi _{min }^{*}$, much lower than $\psi _{neck}^{*}$ at $\lambda =1$ and $0.3$. In the soluble case with $k=0.429$, $\psi _{max}^{*}-\psi _{min }^{*}$ is almost the same as that in the insoluble case before breakup, but due to the surfactant adsorption from the bulk phase, the average interface surfactant concentration ${{\psi }^{*}}$ is higher, quickening the breakup process. Upon increasing $k$ to 1, a similar distribution of ${{\psi }^{*}}$ is also observed, but the average interface surfactant concentration is higher and the surfactants become more non-uniform before droplet breakup. As a result, the droplet breakup is promoted, corresponding to a lower $C{{a}_{cr}}$.

Figure 19. (a) Snapshots of the droplet shape and (b) the time evolution of deformation parameter ${{D}_{f}}$ in the soluble case with $k=1$ at $\lambda =5$ and $C{{a}_{cr}}=0.58$.

Another important dimensionless parameter governing droplet breakup is the Reynolds number, and its influence on $Ca_{cr}$ is investigated in the clean, insoluble and soluble ($k=0.429$ and 1) systems for the viscosity ratio of 1, and the results are displayed in figure 20. It is seen that in each of the systems considered, as $Re$ increases, the critical capillary number $C{{a}_{cr}}$ decreases monotonically, and the droplet breakup undergoes the transition from binary breakup ($Re\le 4$) to ternary breakup ($Re=10$). In addition, we observe that regardless of the value of $Re$, the presence of surfactants always reduces $C{{a}_{cr}}$, and the greater the solubility of surfactants, the more the reduction of $C{{a}_{cr}}$. As $Re$ increases, especially when increasing from 4 to 10, we interestingly find that the influence of solubility on $C{{a}_{cr}}$ weakens since inertia gradually dominates the breakup mechanism, and the influence of surfactants also shows a weakening trend.

Figure 20. Critical capillary number of droplet breakup as a function of Reynolds number in the clean, insoluble and soluble ($k=0.429$ and 1) systems for $\lambda =1$. Binary breakup and ternary breakup are represented by the discrete symbols without ‘$+$’ and the discrete symbols with ‘$+$’, respectively. Each inset plots the droplet shapes before and after breakup.

5. Conclusions

In this work a hybrid LB-FD method is used to simulate the droplet deformation and breakup in simple shear flow with soluble surfactants. First, we investigate the influence of the bulk surfactant parameters on the droplet deformation in 2-D shear flow. Results show that the droplet deformation is influenced by the change of the dimensionless total mass of interface surfactants $M_{s}^{*}$ and the variation of non-uniform effects, quantified by the dimensionless source term ${{j}^{*}}$, but the change of $M_{s}^{*}$ plays a dominant role. In addition, the droplet deformation first increases and then decreases with the Biot number, increases significantly with the adsorption number $k$ and decreases with either the adsorption depth or the bulk Péclet number. Among the four bulk surfactant parameters, $k$ is the most influential one.

Then, we focus on 3-D shear flow and study the role of surfactants on the droplet deformation and breakup for various capillary numbers ($Ca$) and viscosity ratios ($\lambda$) in the clean, insoluble and soluble ($k=0.429$ and 1) systems. Due to the balance between the surfactant adsorption and desorption, leading to negligible mass exchange between the interface and the bulk, ${{D}_{f}}$ in the soluble case with $k=0.429$ is nearly the same as that in the insoluble case; but as $k$ increases to 1, $M_{s}^{*}$ is greatly enhanced because of the dominant adsorption of surfactants, which causes the significant increase in ${{D}_{f}}$. In the insoluble case, as $\lambda$ increases, non-uniform effects weaken, leading to a decrease of ${{D}_{f}}$, different from a droplet in the clean case where ${{D}_{f}}$ first increases slightly and then decreases with $\lambda$; in the soluble case, under the combined action of $M_{s}^{*}$ and non-uniform effects, with the increase of $\lambda$, ${{D}_{f}}$ first increases slightly and then decreases for $k=0.429$, but monotonically decreases for $k=1$. By incorporating the effect of $M_{s}^{*}$, a modified MMSH model is developed for the prediction of droplet deformation at high viscosity ratios.

Next, by quantifying the critical capillary number $C{{a}_{cr}}$ of droplet breakup in the clean, insoluble and soluble ($k=0.429$ and 1) cases, we show that the addition of surfactants always promotes the droplet breakup; as $\lambda$ increases, $C{{a}_{cr}}$ first decreases and then increases in each case. To identify the influence of the surfactant type on $C{{a}_{cr}}$ under different viscosity ratios, we track the distributions of the dimensionless interface surfactant concentration along the arc length, and find that a local maximum dimensionless interface surfactant concentration $\psi _{neck}^{*}$ appears at the neck during the necking stage, which promotes the thinning of the neck. In the insoluble case, a severe dilution of the surfactants is observed, leading to a decrease of $\psi _{neck}^{*}$ during the whole stretching and necking stages. In the soluble case with $k=0.429$, the dilution is reduced by the mass transfer of surfactants, enhancing the average interface surfactant concentration and $\psi _{neck}^{*}$, and thus, the droplet breaks up at a lower $C{{a}_{cr}}$; for $k=1$, the average interface surfactant concentration and $\psi _{neck}^{*}$ are further enhanced and $C{{a}_{cr}}$ is further reduced. In addition, it is found that increasing $Re$ not only decreases $C{{a}_{cr}}$ but may also change the mode of droplet breakup.

Finally, we discuss the limitations of the present work and give some suggestions for future work. Although a modified MMSH model is developed to predict droplet deformation in this work, it is only limited to two-phase systems with high viscosity ratio, in which non-uniform effects of surfactants can be neglected. For low and moderate viscosity ratios, non-uniform effects play a non-trivial role and cannot be quantified by $( \psi _{max}^{*}-\psi _{min }^{*} )$ alone. Thus, it is necessary to design some new parameters for the characterization or quantification of non-uniform effects, which we leave for future work. In addition, the effect of many important parameters such as the wall confinement ratio and Reynolds number on the droplet deformation has not been explored, and even though some parameters like viscosity ratio have been investigated, their variation ranges are rather limited. In future work we will conduct comprehensive and in-depth research on various influencing factors within a wider parameter range, making up for the shortcomings of the present work.

Funding

This work is supported by the National Natural Science Foundation of China (grant nos 51906206, 12072257, 51976174), the Natural Science Basic Research Program of Shaanxi (grant nos 2020JQ-191,2022JQ-502) and the Major Special Science and Technology Project of the Inner Mongolia Autonomous Region (grant no. 2020ZD0022).

Declaration of interests

The authors report no conflict of interest.

References

Ba, Y., Liu, H., Li, Q., Kang, Q. & Sun, J. 2016 Multiple-relaxation-time color-gradient lattice Boltzmann model for simulating two-phase flows with high density ratio. Phys. Rev. E 94, 023310.CrossRefGoogle ScholarPubMed
Ba, Y., Liu, H., Li, W. & Yang, W. 2023 A hybrid lattice Boltzmann and finite difference method for two-phase flows with soluble surfactants. Comput. Maths Applics. (submitted). arXiv:2311.15242.Google Scholar
Ba, Y., Liu, H., Sun, J. & Zheng, R. 2015 Three dimensional simulations of droplet formation in symmetric and asymmetric t-junctions using the color-gradient lattice Boltzmann model. Intl J. Heat Mass Transfer 90, 931947.CrossRefGoogle Scholar
Baret, J.-C. 2012 Surfactants in droplet-based microfluidics. Lab on a Chip 12 (3), 422433.CrossRefGoogle ScholarPubMed
Bazhekov, I.B., Anderson, P.D. & Meijer, H.E.H. 2006 Numerical investigation of the effect of insoluble surfactants on drop deformation and breakup in simple shear flow. J. Colloid Interface Sci. 298 (1), 369394.CrossRefGoogle Scholar
Chen, K.-Y. & Lai, M.-C. 2014 A conservative scheme for solving coupled surface-bulk convection-diffusion equations with an application to interfacial flows with soluble surfactant. J. Comput. Phys. 257 (A), 118.CrossRefGoogle Scholar
Etienne, G., Kessler, M. & Amstad, E. 2017 Influence of fluorinated surfactant composition on the stability of emulsion drops. Macromol. Chem. Phys. 218, 1600365.CrossRefGoogle Scholar
Far, E.K., Gorakifard, M. & Fattahi, E. 2021 Multiphase phase-field lattice Boltzmann method for simulation of soluble surfactants. Symmetry 13 (6), 1019.Google Scholar
Feigl, K., Megias-Alguacil, D., Fischer, P. & Windhab, E.J. 2007 Simulation and experiments of droplet deformation and orientation in simple shear flow with surfactants. Chem. Engng Sci. 62 (12), 32423258.CrossRefGoogle Scholar
Grace, H.P. 1982 Dispersion phenomena in high-viscosity immiscible fluid systems and application of static mixers as dispersion devices in such systems. Chem. Engng Commun. 14 (3–6), 225277.CrossRefGoogle Scholar
Guo, Z.L., Zheng, C.G. & Shi, B.C. 2002 Discrete lattice effects on the forcing term in the lattice Boltzmann method. Phys. Rev. E 65, 046308.CrossRefGoogle ScholarPubMed
Halliday, I., Hollis, A.P. & Care, C.M. 2007 Lattice Boltzmann algorithm for continuum multicomponent flow. Phys. Rev. E 76, 026708.CrossRefGoogle ScholarPubMed
Hu, W.-F., Lai, M.-C. & Misbah, C. 2018 A coupled immersed boundary and immersed interface method for interfacial flows with soluble surfactant. Comput. Fluids 168, 201215.CrossRefGoogle Scholar
James, A.J. & Lowengrub, J. 2004 A surfactant-conserving volume-of-fluid method for interfacial flows with insoluble surfactant. J. Comput. Phys. 201 (2), 685722.CrossRefGoogle Scholar
Janssen, P.J.A., Vananroye, A., Van Puyvelde, P., Moldenaers, P. & Anderson, P.D. 2010 Generalized behavior of the breakup of viscous drops in confinements. J. Rheol. 54 (5), 10471060.CrossRefGoogle Scholar
de Jesus, W.C., Roma, A.M., Pivello, M.R., Villar, M.M. & da Silveira-Neto, A. 2015 A 3D front-tracking approach for simulation of a two-phase fluid with insoluble surfactant. J. Comput. Phys. 281, 403420.CrossRefGoogle Scholar
Kalogirou, A. & Blyth, M.G. 2020 Nonlinear dynamics of two-layer channel flow with soluble surfactant below or above the critical micelle concentration. J. Fluid Mech. 900, A7.CrossRefGoogle Scholar
Khatri, S. & Tornberg, A.-K. 2014 An embedded boundary method for soluble surfactants with interface tracking for two-phase flows. J. Comput. Phys. 256, 768790.CrossRefGoogle Scholar
Komrakova, A.E., Shardt, O., Eskin, D. & Derksen, J.J. 2015 Effects of dispersed phase viscosity on drop deformation and breakup in inertial shear flow. Chem. Engng Sci. 126, 150159.CrossRefGoogle Scholar
Kruijt-Stegeman, Y.W., van de Vosse, F.N. & Meijer, H.E.H. 2004 Droplet behavior in the presence of insoluble surfactants. Phys. Fluids 16 (8), 27852796.CrossRefGoogle Scholar
Latva-Kokko, M. & Rothman, D.H. 2005 Diffusion properties of gradient-based lattice Boltzmann models of immiscible fluids. Phys. Rev. E 71, 056702.CrossRefGoogle ScholarPubMed
Li, J., Renardy, Y.Y. & Renardy, M. 2000 Numerical simulation of breakup of a viscous drop in simple shear flow through a volume-of-fluid method. Phys. Fluids 12 (2), 269282.CrossRefGoogle Scholar
Lishchuk, S.V., Care, C.M. & Halliday, I. 2003 Lattice Boltzmann algorithm for surface tension with greatly reduced microcurrents. Phys. Rev. E 67, 036701.CrossRefGoogle ScholarPubMed
Liu, H., Ba, Y., Wu, L., Li, Z., Xi, G. & Zhang, Y. 2018 A hybrid lattice Boltzmann and finite difference method for droplet dynamics with insoluble surfactants. J. Fluid Mech. 837, 381412.CrossRefGoogle Scholar
Liu, H., Valocchi, A.J. & Kang, Q. 2012 Three-dimensional lattice Boltzmann model for immiscible two-phase flow simulations. Phys. Rev. E 85, 046309.Google ScholarPubMed
Liu, H., Zhang, J., Ba, Y., Wang, N. & Wu, L. 2020 Modelling a surfactant-covered droplet on a solid surface in three-dimensional shear flow. J. Fluid Mech. 897, A33.CrossRefGoogle Scholar
Liu, H. & Zhang, Y. 2010 Phase-field modeling droplet dynamics with soluble surfactants. J. Comput. Phys. 229 (24), 91669187.CrossRefGoogle Scholar
Maffettone, P.L. & Minale, M. 1998 Equation of change for ellipsoidal drops in viscous flows. J. Non-Newtonian Fluid Mech. 78 (2–3), 227241.CrossRefGoogle Scholar
McClements, D.J. 2007 Critical review of techniques and methodologies for characterization of emulsion stability. Crit. Rev. Food Sci. Nutr. 47 (7), 611649.CrossRefGoogle ScholarPubMed
Megías-Alguacil, D., Fischer, P. & Windhab, E.J. 2006 Determination of the interfacial tension of low density difference liquid–liquid systems containing surfactants by droplet deformation. Chem. Engng Sci. 61 (5), 13861394.CrossRefGoogle Scholar
Milliken, W.J. & Leal, L.G. 1994 The influence of surfactant on the deformation and breakup of a viscous drop-the effect of surfactant solubility. J. Colloid Interface Sci. 166 (2), 275285.CrossRefGoogle Scholar
Muradoglu, M. & Tryggvason, G. 2008 A front-tracking method for computation of interfacial flows with soluble surfactants. J. Comput. Phys. 227 (4), 22382262.CrossRefGoogle Scholar
Muradoglu, M. & Tryggvason, G. 2014 Simulations of soluble surfactants in 3D multiphase flow. J. Comput. Phys. 274, 737757.CrossRefGoogle Scholar
Nganguia, H., Young, Y.N., Vlahovska, P.M., Blawzdziewicz, J., Zhang, J. & Lin, H. 2013 Equilibrium electro-deformation of a surfactant-laden viscous drop. Phys. Fluids 25, 092106.CrossRefGoogle Scholar
Riechers, B., Maes, F., Akoury, E., Semin, B., Gruner, P. & Baret, J.-C. 2016 Surfactant adsorption kinetics in microfluidics. Proc. Natl Acad. Sci. USA 113 (41), 1146511470.CrossRefGoogle ScholarPubMed
Sackmann, E.K., Fulton, A.L. & Beebe, D.J. 2014 The present and future role of microfluidics in biomedical research. Nature 507 (7491), 181189.CrossRefGoogle ScholarPubMed
Severino, M., Campana, D.M. & Giavedoni, M.D. 2005 Effects of a surfactant on the motion of a confined gas–liquid interface. The influence of the Péclet number. Latin Am. Appl. Res. 35 (3), 225232.Google Scholar
Shang, X., Luo, Z., Bai, B., He, L. & Hu, G. 2024 Front tracking simulation of droplet displacement on solid surfaces by soluble surfactant-driven flows. Phys. Rev. Fluids 9, 014002.CrossRefGoogle Scholar
Shapira, M. & Haber, S. 1990 Low Reynolds number motion of a droplet in shear flow including wall effects. Intl J. Multiphase Flow 16 (2), 305321.CrossRefGoogle Scholar
Sharma, D., Sharma, J., Arya, R.K., Ahuja, S. & Agnihotri, S. 2018 Surfactant enhanced drying of waterbased poly(vinyl alcohol) coatings. Prog. Org. Coat. 125, 443452.CrossRefGoogle Scholar
Shin, S., Chergui, J., Juric, D., Kahouadji, L., Matar, O.K. & Craster, R.V. 2018 A hybrid interface tracking – level set technique for multiphase flow with soluble surfactant. J. Comput. Phys. 359, 409435.CrossRefGoogle Scholar
van der Sman, R.G.M. & Meinders, M.B.J. 2016 Analysis of improved lattice Boltzmann phase field method for soluble surfactants. Comput. Phys. Commun. 199, 1221.CrossRefGoogle Scholar
Soligo, G., Roccon, A. & Soldati, A. 2019 Coalescence of surfactant-laden drops by phase field method. J. Comput. Phys. 376, 12921311.CrossRefGoogle Scholar
Soligo, G., Roccon, A. & Soldati, A. 2020 Deformation of clean and surfactant-laden droplets in shear flow. Meccanica 55 (2, SI), 371386.CrossRefGoogle Scholar
Stone, H.A. 1990 A simple derivation of the time-dependent convective-diffusion equation for surfactant transport along a deforming interface. Phys. Fluids A 2 (1), 111112.CrossRefGoogle Scholar
Taylor, G.I. 1934 The formation of emulsions in definable fields of flow. Proc. R. Soc. Lond. A 146 (A858), 05010523.Google Scholar
Teigen, K.E., Song, P., Lowengrub, J. & Voigt, A. 2011 A diffuse-interface method for two-phase flows with soluble surfactants. J. Comput. Phys. 230 (2), 375393.CrossRefGoogle ScholarPubMed
Van Puyvelde, P., Vananroye, A., Cardinaels, R. & Moldenaers, P. 2008 Review on morphology development of immiscible blends in confined shear flow. Polymer 49 (25), 53635372.CrossRefGoogle Scholar
Vananroye, A., Van Puyvelde, P. & Moldenaers, P. 2006 Effect of confinement on droplet breakup in sheared emulsions. Langmuir 22 (9), 39723974.CrossRefGoogle ScholarPubMed
Vananroye, A., Van Puyvelde, P. & Moldenaers, P. 2007 Effect of confinement on the steady-state behavior of single droplets during shear flow. J. Rheol. 51 (1), 139153.CrossRefGoogle Scholar
Vananroye, A., Van Puyvelde, P. & Moldenaers, P. 2011 Deformation and orientation of single droplets during shear flow: combined effects of confinement and compatibilization. Rheol. Acta 50 (3), 231242.CrossRefGoogle Scholar
Xu, J.J., Li, Z.L., Lowengrub, J. & Zhao, H.K. 2006 A level-set method for interfacial flows with surfactant. J. Comput. Phys. 212 (2), 590616.CrossRefGoogle Scholar
Xu, J.-J., Shi, W. & Lai, M.-C. 2018 A level-set method for two-phase flows with soluble surfactant. J. Comput. Phys. 353, 336355.CrossRefGoogle Scholar
Xu, J.-J., Yang, Y. & Lowengrub, J. 2012 A level-set continuum method for two-phase flows with insoluble surfactant. J. Comput. Phys. 231 (17), 58975909.CrossRefGoogle Scholar
Xu, J.J. & Zhao, H.K. 2003 An Eulerian formulation for solving partial differential equations along a moving interface. J. Sci. Comput. 19 (1–3), 573594.CrossRefGoogle Scholar
Yang, J., Li, Y. & Kim, J. 2022 A correct benchmark problem of a two-dimensional droplet deformation in simple shear flow. Mathematics 10 (21), 4092.CrossRefGoogle Scholar
Zhang, J., Liu, H., Wei, B., Hou, J. & Jiang, F. 2021 a Pore-scale modeling of two-phase flows with soluble surfactants in porous media. Energy Fuels 35 (23), 1937419388.CrossRefGoogle Scholar
Zhang, J., Shu, S., Guan, X. & Yang, N. 2021 b Regime mapping of multiple breakup of droplets in shear flow by phase-field lattice Boltzmann simulation. Chem. Engng Sci. 240 (31), 116673.CrossRefGoogle Scholar
Zhang, Y., Xu, J. & He, X. 2018 Effect of surfactants on the deformation of single droplet in shear flow studied by dissipative particle dynamics. Mol. Phys. 116 (14), 18511861.CrossRefGoogle Scholar
Zhao, Q., Ren, W. & Zhang, Z. 2021 A thermodynamically consistent model and its conservative numerical approximation for moving contact lines with soluble surfactants. Comput. Meth. Appl. Mech. Engng 385, 114033.CrossRefGoogle Scholar
Zhou, W., Xing, Y., Liu, X. & Yan, Y. 2023 Modeling of droplet dynamics with soluble surfactant by multi-relaxation-time phase-field lattice Boltzmann method. Phys. Fluids 35, 012109.Google Scholar
Zhu, G., Kou, J., Sun, S., Yao, J. & Li, A. 2019 Numerical approximation of a phase-field surfactant model with fluid flow. J. Sci. Comput. 80 (1), 223247.CrossRefGoogle Scholar
Zhu, G., Kou, J., Yao, J., Li, A. & Sun, S. 2020 A phase-field moving contact line model with soluble surfactants. J. Comput. Phys. 405 (15), 109170.CrossRefGoogle Scholar
Zong, Y., Zhang, C., Liang, H., Wang, L. & Xu, J. 2020 Modeling surfactant-laden droplet dynamics by lattice Boltzmann method. Phys. Fluids 32, 122105.CrossRefGoogle Scholar
Figure 0

Figure 1. Illustration of (a) a 2-D droplet and (b) a 3-D droplet in a simple shear flow. In (a) the initial circular droplet (represented by red dashed lines) finally evolves to an ellipse-like shape (represented by red solid lines) with semi-major axis $a$ (measured by the longest distance between two points at the interface) and semi-minor axis $b$ (measured by the shortest distance between two points at the interface). Point ‘A’ is the right intersection point between the horizontal centreline of the computational domain ($y=0$) and the droplet interface.

Figure 1

Table 1. Dimensionless parameters characterizing the deformation and breakup of a droplet in simple shear with soluble surfactants.

Figure 2

Figure 2. (a) The deformation parameter $D_f$ and the dimensionless total mass of interface surfactants $M_{s}^{*}$ as functions of $Bi$; the distributions of (b) the dimensionless source term ${{j}^{*}}$ and (c) the dimensionless interface surfactant concentration ${{\psi }^{*}}$ along the arc length $s$ under various $Bi$; (d) the dimensionless bulk surfactant concentration ${{\phi }^{*}}$ at different $Bi$.

Figure 3

Figure 3. (a) The deformation parameter ${{D}_{f}}$ and the dimensionless total mass of interface surfactants $M_{s}^{*}$ as functions of $P{{e}_{b}}$; the distributions of (b) the dimensionless source term ${{j}^{*}}$ and (c) the dimensionless interface surfactant concentration ${{\psi }^{*}}$ along the arc length $s$ under various $P{{e}_{b}}$; (d) the dimensionless bulk concentration ${{\phi }^{*}}$ under various $P{{e}_{b}}$.

Figure 4

Figure 4. (a) The distributions of the dimensionless source term ${{j}^{*}}$ and (b) the dimensionless interface concentration ${{\psi }^{{*}}}$ along the arc length $s$ for various $k$ at different times.

Figure 5

Figure 5. The distributions of the bulk surfactant concentration ${{\phi }^{*}}$ at different times for (a) $k=0.1$, (b) $k=0.428$, (c) $k=0.6$ and (d) $k=1$.

Figure 6

Figure 6. The deformation parameter ${{D}_{f}}$ and the dimensionless total mass of interface surfactants $M_{s}^{*}$ versus the adsorption number $k$.

Figure 7

Figure 7. (a) The deformation parameter ${{D}_{f}}$ and the dimensionless total mass of interface surfactants $M_{s}^{*}$ as functions of $h$; the distributions of (b) the dimensionless source term ${{j}^{*}}$ and (c) the dimensionless interface surfactant concentration ${{\psi }^{*}}$ along the arc length $s$ under various $h$; (d) the dimensionless bulk surfactant concentration ${{\phi }^{*}}$ under various $h$.

Figure 8

Table 2. The minimum and maximum deformation parameters and their relative change for different bulk surfactant parameters.

Figure 9

Figure 8. (a) The evolution of ${{D}_{f}}$ at $Ca=\{ 0.1, 0.2, 0.3 \}$, (b) ${{D}_{f}}$ vs $Ca$ for $\lambda =1$ in the clean, insoluble and soluble ($k=0.429$ and 1) systems. For the evolution of ${{D}_{f}}$ at $Ca=0.3$ in the soluble system with $k=1$, we only show the results before droplet breakup. In (b) the predictions from the MMSH model are also shown for comparison, and an inset is included to show the increment of ${{D}_{f}}$ caused by insoluble surfactants (denoted as ${{\delta }_{1}}$) and the increment caused by solubility (denoted as ${{\delta }_{2}}$) under various $Ca$.

Figure 10

Figure 9. (a) The steady droplet shapes or the droplet shape after the breakup for $Ca=\{ 0.1, 0.2, 0.3 \}$ and $\lambda =1$ in the clean, insoluble and soluble ($k=0.429$ and 1) systems. The droplet surface is coloured by the dimensionless interface surfactant concentration for systems with surfactants. In each graph, the maximum and minimum values of the interface surfactant concentration are labelled. Note that the droplet eventually breaks up into two parts in (l). Results are shown for (a) $Ca = 0.1$, clean; (b) $Ca = 0.2$, clean; (c) $Ca = 0.3$, clean; (d) $Ca = 0.1$, insoluble; (e) $Ca = 0.2$, insoluble; (f) $Ca = 0.3$, insoluble; (g) $Ca = 0.1, k = 0.429$; (h) $Ca = 0.2, k = 0.429$; (i) $Ca = 0.3, k = 0.429$; (j) $Ca = 0.1, k = 1$; (k) $Ca = 0.2, k = 1$; (l) $Ca = 0.3, k = 1$.

Figure 11

Figure 10. (a) The dimensionless total mass of interface surfactants $M_{s}^{*}$, and (b) the minimum and maximum values of interface surfactant concentration ($\psi _{min}^{*}$ and $\psi _{max}^{*}$) for various $Ca$ in the insoluble and soluble ($k=0.429$ and 1) systems at $\lambda =1$.

Figure 12

Figure 11. Plots of ${{D}_{f}}$ vs $Ca$ in the clean, insoluble and soluble ($k=0.429$ and 1) systems for (a) $\lambda =0.3$ and (b) $\lambda =5$, where the predictions from the MMSH model are also shown for comparison. In (a,b) an inset is included to show the increment of ${{D}_{f}}$ caused by the insoluble surfactant (denoted as ${{\delta }_{1}}$) and the increment caused by the solubility (denoted as ${{\delta }_{2}}$) under various $Ca$.

Figure 13

Figure 12. (a) The dimensionless total mass of interface surfactants and (b) the minimum and maximum values of interface surfactant concentration ($\psi _{min }^{*}$ and $\psi _{max}^{*}$) versus $Ca$ in the insoluble and soluble ($k=0.429$ and 1) systems for $\lambda =0.3$; (c) $M_{s}^{*}$ and (d) $\psi _{min }^{*}$ and $\psi _{max}^{*}$ vs $Ca$ in the insoluble and soluble ($k=0.429$ and 1) systems for $\lambda =5$.

Figure 14

Figure 13. The final droplet shapes for $Ca=\{ 0.1, 0.2, 0.3 \}$ in the clean, insoluble and soluble ($k=0.429$ and 1) systems at $\lambda =\{ 0.3, 1, 5 \}$, in which the red solid lines, the blue dashed lines and the green dash-dotted lines represent the droplet interfaces at $\lambda =1$, $\lambda =0.3$ and $\lambda =5$, respectively. Results are shown for (a) $Ca = 0.1$, clean; (b) $Ca = 0.2$, clean; (c) $Ca = 0.3$, clean; (d) $Ca = 0.1$, insoluble; (e) $Ca = 0.2$, insoluble; (f) $Ca = 0.3$, insoluble; (g) $Ca = 0.1, k = 0.429$; (h) $Ca = 0.2, k = 0.429$; (i) $Ca = 0.3, k = 0.429$; (j) $Ca = 0.1, k = 1$; (k) $Ca = 0.2, k = 1$; (l) $Ca = 0.3, k = 1$.

Figure 15

Figure 14. The steady-state deformation parameter as a function of $Ca_e$ in the insoluble and soluble ($k=0.429$ and 1) systems for (a) $\lambda =0.3$, (b) $\lambda =1$ and (c) $\lambda =5$. The filled symbols represent the simulation results ($D_f$) while the hollow symbols represent the predictions from the modified MMSH model ($D_{f,M}$).

Figure 16

Figure 15. Plot of $C{{a}_{cr}}$ for different viscosity ratios in the clean, insoluble and soluble ($k=0.429$ and 1) systems. The insets are included to show the droplet shapes immediately before and after droplet breakup, and the droplet surface is coloured by ${{\psi }^{*}}$ in both insoluble and soluble systems.

Figure 17

Figure 16. The snapshots of droplet breakup for $\lambda =1$ in (a) the clean system with $C{{a}_{cr}}=0.392$, (b) the insoluble system with $C{{a}_{cr}}=0.34$, (c) the soluble system ($k=0.429$) with $C{{a}_{cr}}=0.33$ and (d) the soluble system ($k=1$) with $C{{a}_{cr}}=0.3$. Note that in (bd) the droplet surface is coloured by the dimensionless interface surfactant concentration ${{\psi }^{*}}$.

Figure 18

Figure 17. The distributions of the dimensionless interface surfactant concentration ${{\psi }^{*}}$ along the arc length $s$ in the $x$$z$ mid-plane at different dimensionless time $\tau$ in (a) the insoluble case, (b) the soluble case with $k=0.429$ and (c) the soluble case with $k=1$. The viscosity ratios are all taken as $\lambda =1$, and the critical capillary numbers are exactly the same as those in figure 16(bd). Note that the pink and blue filled circles are to highlight the droplet tips and the necking regions, respectively.

Figure 19

Figure 18. The distributions of the dimensionless interface surfactant concentration ${{\psi }^{*}}$ along the arc length in the $x$$z$ mid-plane at different dimensionless time $\tau$ for (a) $\lambda =0.3$ and (b) $\lambda =5$. Note that the pink and blue filled circles are to highlight the droplet tips and the necking regions, respectively.

Figure 20

Figure 19. (a) Snapshots of the droplet shape and (b) the time evolution of deformation parameter ${{D}_{f}}$ in the soluble case with $k=1$ at $\lambda =5$ and $C{{a}_{cr}}=0.58$.

Figure 21

Figure 20. Critical capillary number of droplet breakup as a function of Reynolds number in the clean, insoluble and soluble ($k=0.429$ and 1) systems for $\lambda =1$. Binary breakup and ternary breakup are represented by the discrete symbols without ‘$+$’ and the discrete symbols with ‘$+$’, respectively. Each inset plots the droplet shapes before and after breakup.