Introduction: the implications of recession and austerity for social policy
The ‘Great Recession’ was the first contraction of the global economy the Second World War (Keeley and Love, Reference Keeley and Love2010). The depth and length of the recession in the UK, which began in 2008, was distinctive compared to previous recessions: unlike the recessions in the early 1980s and early 1990s, output was still below pre-recession levels five years after the start of the recession (Johnson, Reference Johnson2013) (see Figure 1). Gough (Reference Gough, Farnsworth and Irving2011) describes how a combination of factors – including government interventions to shore up financial institutions, fiscal stimuli designed to boost the economy, and non-discretionary factors – transformed the financial and economic crisis into a ‘fiscal crisis’. The subsequent policy response of the 2010 Coalition and the 2015 Conservative UK governments has been to prioritise cutting the fiscal deficit by reducing public expenditure, which has heralded an ‘age of austerity’ (Farnsworth and Irving, Reference Farnsworth and Irving2011).
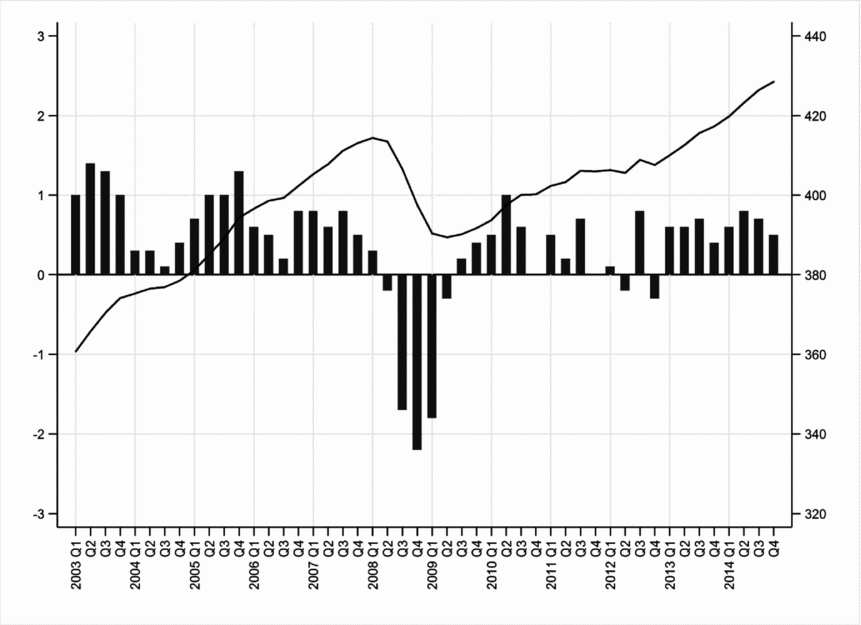
Figure 1. Trends in UK GDP (£ billions; right vertical axis) and quarter-on-quarter GDP growth (per cent; left vertical axis)
There is a pressing need to examine the implications of these interrelated crises for social policy (see Ellison, Reference Ellison, Foster, Brunton, Deeming and Haux2015). Here the priority is to consider the implications of the Great Recession and of public spending austerity for the provision of social welfare and for social wellbeing. An important body of empirical evidence has started to emerge about the scale, speed and composition of changes in public spending (Johnson, Reference Johnson2013; Taylor-Gooby, Reference Taylor-Gooby2012; Hastings et al., Reference Hastings, Bailey, Gannon, Besemer and Bramley2015; Lupton et al., Reference Lupton, Burchardt, Fitzgerald, Hills, McKnight, Obolenskaya, Stewart, Thomson, Tunstall and Vizard2015) and about recent trends in the living standards of individuals and households (Harkness and Evans, Reference Harkness and Evans2011; Jenkins et al., Reference Jenkins, Brandolini, Micklewright and Nolan2012; Gregg et al., Reference Gregg, Machin and Fernández-Salgado2014; Blundell et al., Reference Blundell, Crawford and Jin2014; Lupton et al., Reference Lupton, Burchardt, Fitzgerald, Hills, McKnight, Obolenskaya, Stewart, Thomson, Tunstall and Vizard2015). However, thus far there has been very little empirical evidence about the impact of the recession and of the ‘age of austerity’ on the income of voluntary organisations. Notably the few relevant existing studies suggest that the impact on the voluntary sector may be most significant in more deprived local areas (Clifford et al., Reference Clifford, Geyne-Rahme and Mohan2013; Jones et al., Reference Jones, Meegan, Kennett and Croft2015). The shortage of existing research is a significant omission given the importance of the voluntary sector in the ‘mixed economy of welfare’ and the involvement of voluntary organisations – from formal providers of publicly funded services to small community-based organisations – in a diverse range of activities conducive to the welfare and wellbeing of individuals (see, for example, Alcock and May, Reference Alcock and May2014; Allard, Reference Allard2009; Lewis, Reference Lewis1993; Kendall, Reference Kendall2003). Therefore, for the first time, this paper provides empirical evidence about trends in the income of voluntary organisations during the Great Recession and the subsequent period of public spending austerity.
Context: charitable organisations in England and Wales
According to the ‘structural/operational’ definition, voluntary organisations are formal organisations (with internal structure and meaningful boundaries) which are self-governing, independent of government, not profit-distributing, and benefiting from meaningful contributions of philanthropic donations and/or voluntary work (Salamon and Anheier, Reference Salamon and Anheier1992). In this paper we consider voluntary organisations registered as charities in England and Wales. According to law, charities should work for public benefit and their purposes should be charitable according to the 13 ‘heads’ of charityFootnote 1 . Registered charities have a total aggregate annual income of £39.2bn. This comes from two main sources – individuals (£17.4bn; 44 per cent of the total) and government (£13.7bn; 35 per cent) – with the remaining income from investments, the National Lottery, foundations, and the private sector (Kane et al., Reference Kane, Heywood and Bass2014).
A mismatch: public concern but a lack of empirical information
Theory about the voluntary sector and its capacity to provide social welfare makes a prediction that voluntary organisations’ income from charitable donations declines at the very time that social need is greatest: during periods of economic downturn (Salamon, Reference Salamon1987; Smith and Grønbjerg, Reference Smith, Grønbjerg, Powell and Steinberg2006). Influential work has also suggested that, when periods of recession are accompanied by public spending austerity, there may be serious ramifications for the health of the voluntary sector given that voluntary organisations now play a greater role in public service delivery than ever before and are therefore more reliant on government funding (Allard, Reference Allard2009; Smith and Lipsky, Reference Smith and Lipsky1993). These twin concerns have particular resonance in the recent UK context given the combination of unprecedented declines in real wages (Gregg et al., Reference Gregg, Machin and Fernández-Salgado2014) and distinctively deep and prolonged cuts in public spending (Johnson, Reference Johnson2013; Taylor-Gooby, Reference Taylor-Gooby2012).
Indeed there has been extensive concern about the effect of recession, and the subsequent public spending reductions, on the voluntary sector in England and Wales. There has been anxiety that charities have been facing a ‘perfect storm’ – such that at a time when there may be an increase in demand for their services, they also experience significant declines in income through falls in donations from individuals and through reductions in public funding (Charity Commission, Reference Commission2009; Taylor et al., Reference Taylor, Parry and Alcock2012; Wilding, Reference Wilding2010). This concern has been exacerbated by the distribution of public spending cuts: while the overall reduction between 2009/10 and 2014/15 was 2.6 per cent in real terms, the decision to provide relative protection in certain areas of spending like health and education has led to substantial cuts in unprotected areas (Lupton et al., Reference Lupton, Burchardt, Fitzgerald, Hills, McKnight, Obolenskaya, Stewart, Thomson, Tunstall and Vizard2015). Most significantly, funding for local government – which accounts for the majority of public funding of the voluntary sector (Alcock and May, Reference Alcock and May2014) – fell by an estimated 33 per cent between 2009/10 and 2014/15 (Hastings et al., Reference Hastings, Bailey, Gannon, Besemer and Bramley2015; Lupton et al., Reference Lupton, Burchardt, Fitzgerald, Hills, McKnight, Obolenskaya, Stewart, Thomson, Tunstall and Vizard2015). Indeed particular concern has been expressed about a possible ‘hollowing-out’ of the charitable sector as a result of the potentially serious impact on ‘medium-sized’ charities, seen as most likely to be dependent on grants and contracts from local authorities and therefore especially vulnerable to reductions in funding (Taylor et al., Reference Taylor, Parry and Alcock2012; Harris, Reference Harris2009; Bagwell, Reference Bagwell2015).
However, despite the extent of public concern, there is a lack of empirical research that has been able to examine the implications of the recession and of public spending austerity for voluntary organisations’ income. This lack of research is a particular anomaly given the high profile of voluntary organisations in policy development and political debate. Indeed, while the ‘Big Society’ label may have failed to achieve political traction, voluntary organisations are central to policy which has sought to extend the role of non-government providers in service delivery, to encourage people to take more of an active role in their neighbourhoods, and to decentralise power to communities (Alcock et al., Reference Alcock, Kendall and Parry2012; Alcock, Reference Alcock, Foster, Brunton, Deeming and Haux2015). Macmillan (Reference Macmillan2013a) notes a recent shift in emphasis regarding the relationship between the state and the voluntary sector. This shift involved a ‘partial decoupling’, away from the ‘partnership’ characteristic of New Labour governments, with reduced ‘horizontal’ support for the sector – within the context of a wider programme of public spending austerity which contrasts with the more favourable funding environment in the ‘nice decade’ following 1997 (Wilding, Reference Wilding2010). Important critical perspectives on recent policy have argued that there is an inconsistency between the enhanced role that is envisaged for voluntary organisations and the cuts in funding that many organisations are facing (Ellison, Reference Ellison, Holden, Kilkey and Ramia2011; see Macmillan, Reference Macmillan2013b). However, while longitudinal qualitative research has documented the strategies and tactics that organisations have adopted to face a challenging economic environment (Macmillan et al., Reference Macmillan, Taylor, Arvidson, Soteri-Proctor and Teasdale2013) and illustrated the isomorphic pressures that have accompanied recent change (Milbourne and Cushman, Reference Milbourne and Cushman2015), this has not yet been complemented by any longitudinal quantitative research documenting the extent of recent changes in organisations’ incoming financial resources. Indeed, as Wilding (Reference Wilding2010) emphasises, there is a striking lack of hard empirical data on this theme. Similarly Mohan and Wilding (Reference Mohan and Wilding2009) and Breeze and Morgan (Reference Breeze and Morgan2009) note the lack of high quality quantitative evidence; Taylor et al. (Reference Taylor, Parry and Alcock2012:9) point to the ‘recognised dearth of systematic sector-wide data’.
The only existing source of statistical information is the Civil Society Almanac produced by the National Council for Voluntary Organisations (NCVO). The data indicate that, for the voluntary sector as a whole and after adjusting for inflation, aggregate income fell by £1.6bn between the pre-recession and austerity peak in 2007/08 and 2011/12 (Kane et al., Reference Kane, Heywood and Bass2014). The Almanac is a key reference for the sector and information on cross-sectional aggregate trends is invaluable. However, importantly, the income distribution of charities is extremely skewed, with 60 per cent of total charitable income accounted for by just 1 per cent of charities. Therefore aggregate income is dominated by the income of a small number of very large organisations. This means that cross-sectional aggregate trends in income for the sector as a whole do not provide any insight into longitudinal trends in income at the level of individual organisations. The implications of recession and austerity at the organisational level have not been documented thus far.
Therefore basic questions remain unanswered: what have been the average annual changes in income for voluntary organisations during the years of the Great Recession and public spending austerity? What are the cumulative implications of these year-on-year trends? To what extent are changes pervasive, extending to different kinds of organisations in different ‘vertical’ fields of charitable activity (Kendall, Reference Kendall2003)? To what extent is there evidence of differences in vulnerability to recession and austerity for small, medium and large voluntary organisations? This paper answers these questions for the first time.
Data and approach
This paper makes use of a unique panel dataset which follows through time voluntary organisations in England and Wales. The dataset provides, for the population of registered charities, longitudinal financial information: charities’ annual headline income for the period 1999 to 2014 inclusive. The construction of the dataset is described in section 2 of the online supplementary material.
The paper describes trends in voluntary organisations’ income, placing the years of recession and austerity within the context of longer term trends. It considers both trends in organisations’ annual growth rates and the cumulative implications of these annual trends.
Annual relative growth y in headline income x for organisation i between years t − 1 and t is given by
where t = 2000, . . . . . ., 2014Footnote
2
. Thus, if there is no change in income between t − 1 and t, y = 1; for an increase in income, y > 1; for a decrease in income, y < 1. We consider both nominal annual relative growth, before adjusting for inflation, and real annual relative growth, after adjusting for inflation using the Retail Price Index-Jevons (RPIJ) measure. We use the median
![]() $\widetilde {{y_t}}$
of the annual relative growth distributionFootnote
3
to summarise growth of voluntary organisations in a particular year. This is considered a more helpful measure of average growth than the mean, because of the positively skewed nature of the relative growth distribution, and represents the annual relative growth of the ‘typical’ (middle performing) organisation. Note that the composition of the charitable population changes over time as some organisations ‘enter’ the data when they are newly registered with the Charity Commission and some ‘exit’ the data when they dissolve. Annual growth in a particular year is calculated for all organisations that existed at t − 1 and tFootnote
4
. Therefore, for each year t, annual growth is considered for an average of c.109,000 organisations across the charitable population as a whole, representing c.1.6m charity years across the analysis period.
$\widetilde {{y_t}}$
of the annual relative growth distributionFootnote
3
to summarise growth of voluntary organisations in a particular year. This is considered a more helpful measure of average growth than the mean, because of the positively skewed nature of the relative growth distribution, and represents the annual relative growth of the ‘typical’ (middle performing) organisation. Note that the composition of the charitable population changes over time as some organisations ‘enter’ the data when they are newly registered with the Charity Commission and some ‘exit’ the data when they dissolve. Annual growth in a particular year is calculated for all organisations that existed at t − 1 and tFootnote
4
. Therefore, for each year t, annual growth is considered for an average of c.109,000 organisations across the charitable population as a whole, representing c.1.6m charity years across the analysis period.
The cumulative implications of economic downturns may be more important for organisations than year-on-year changes – particularly given the extended duration of the period of the recession and subsequent public spending austerity in the UK. Therefore we develop a cumulative growth index c to consider the cumulative implications of the annual changes in income described in equation (1). The index is the product (the result of the multiplication) of the sequence of median annual relative real growth rates
![]() ${\tilde y_t}$
:
${\tilde y_t}$
:
 $$\begin{equation}
{c_n} = 100 \cdot \mathop \prod \limits_{t = 2000}^n {\tilde y_t} = {\rm{\ }}100 \cdot {\tilde y_{2000}} \cdot {\tilde y_{2001}} \cdot {\tilde y_{2002}} \cdot \ \cdots \ \cdot {\tilde y_{n - 1}} \cdot {\tilde y_n}
\end{equation}$$
where cn describes cumulative growth between 1999 and year n. The index therefore considers the growth of a hypothetical organisation which experiences the median (‘typical’) annual relative real growth rate for every year of the analysis period. Cumulative growth is compared to an index value of 100 in the reference year at the beginning of the period (1999). If there is no change in income between 1999 and n, c = 100; for an increase in income, c > 100; for a decrease in income, c < 100. Further details about the cumulative growth index, including a worked example of its calculation, are provided in section 3 of the online supplementary material.
The variety of voluntary organisations is such that the sector has been described as a ‘loose and baggy monster’ (Kendall, Reference Kendall2003). Therefore, using the International Classification of Nonprofit Organizations (ICNPO) as a basis for categorisation, we disaggregate our results to provide insight into the importance of recession and austerity for subpopulations of organisations that operate in particular ‘vertical fields’ of charitable activity (Salamon and Anheier, Reference Salamon and Anheier1992; Kendall, Reference Kendall2003). Table 1 lists each of the ICNPO groups/subgroups–and the associated categories used in NCVO's Civil Society Almanac (Kane et al., Reference Kane, Heywood and Bass2014)–and shows how the disaggregated results presented in this paper relate to these classifications. Further details about the ICNPO system are provided in Section 4 of the online supplementary material.
TABLE 1. Charitable fields: relating Figures to ICNPO and NCVO classifications
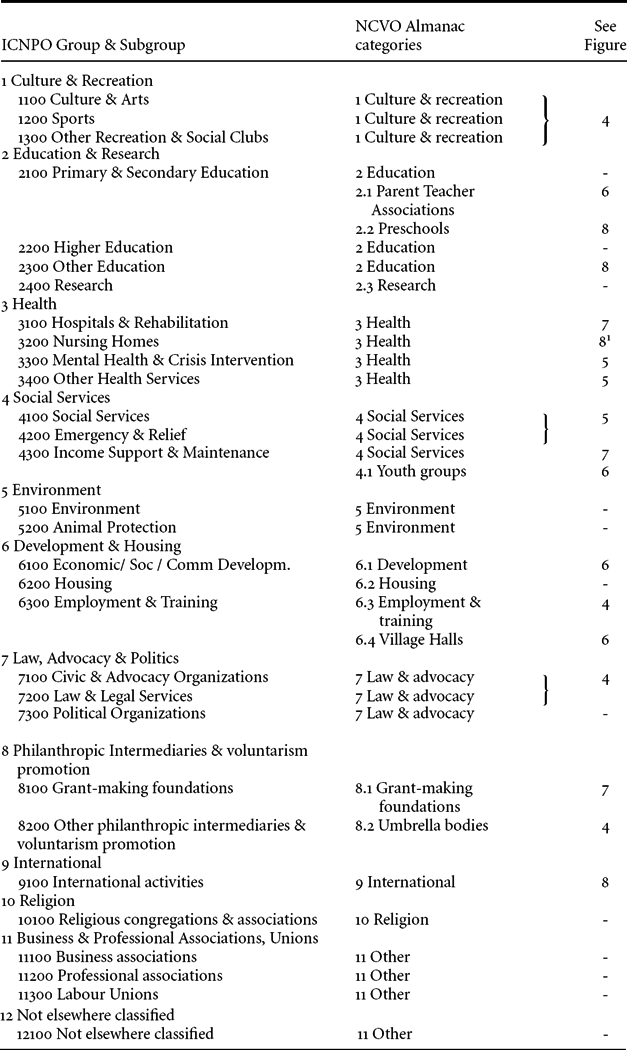
Notes: ICNPO: International Classification of Nonprofit Organisations; NCVO: National Council for Voluntary Organisations. A dash, instead of a Figure number, is provided for those ICNPO categories not considered in this analysis. Further details about the classification process, and the categories listed here, are provided in section 4 of the online supplementary material.
1: In this paper we include hospices in ICNPO category 3200.
Source: This table draws partly on Kane et al.’s (2014) description of the relationship between ICNPO and NCVO categories.
The analysis in this paper is constrained by the data available. Data are available on headline income, but it is not possible to disaggregate trends according to different income sources. While it would be interesting to examine trends in the dissolution of organisations during the years of recession and austerity, the dates of dissolution are not meaningful since they reflect administrative practice as the Charity Commission periodically ‘purge’ the Register of inactive organisations to update their records. The data relate to charities specifically. This includes charities that take a variety of legal forms: unincorporated trusts and associations; and those that are incorporated as a Company Limited by Guarantee or as a Charitable Incorporated Organisation. However, since we do not examine non-charitable third sector organisations (including, for example, Community Interest Companies, a legal form available for noncharitable social enterprises; see section 1 of the supplementary material), the trends that we present do not necessarily reflect those of the wider third sector.
The trends in annual growth and cumulative growth are presented graphically (Figures 2–9; note the differences between figures in the scale of the vertical axis). The results are also presented in Table 2.
TABLE 2(a). Annual real growth rates, for all charities and for specific charitable subpopulations
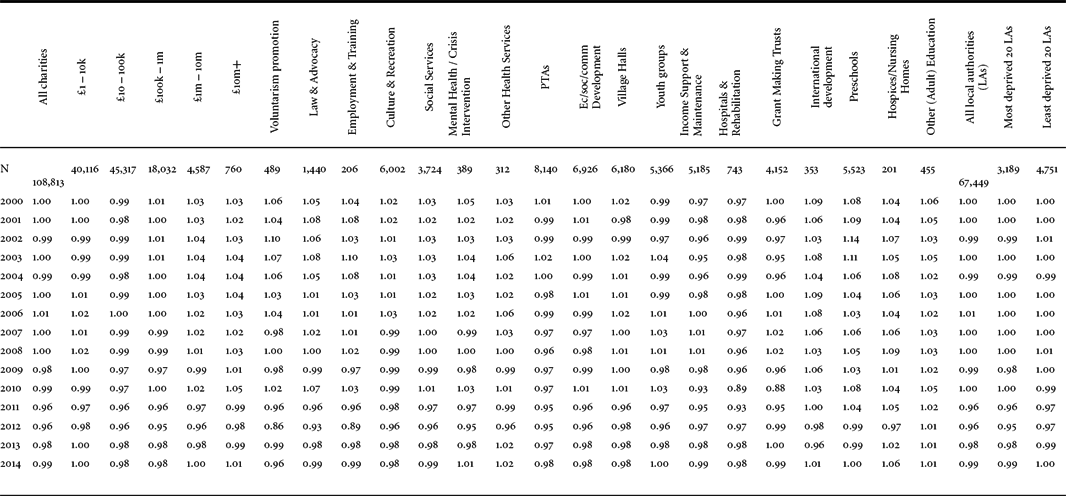
Notes: Annual real growth rate: median relative growth (previous year: 1.00). N- Number of organisations (annual average across the analysis period). See endnote 2 for definition of annual periods. Local authority analysis only considers those charities whose area of operation is restricted to one local authority. Figures 2–9 illustrate these trends graphically.
TABLE 2(b). Cumulative growth index, for all charities and for specific charitable subpopulations
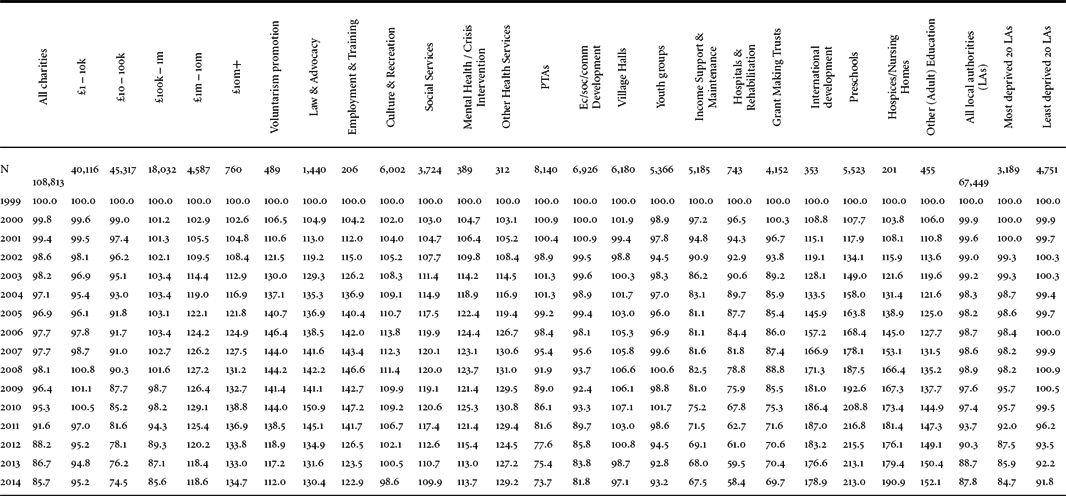
Notes: Cumulative growth index: hypothetical charity experiencing median annual real growth rates throughout the analysis period (1999:100). N- Number of organisations (annual average across the analysis period). See endnote 2 for definition of annual periods. Local authority analysis only considers those charities whose area of operation is restricted to one local authority. Figures 2–9 illustrate these trends graphically.
Results
Overall Trends
Figure 2 presents trends in income across our analysis period for the population of charities as a whole. The top panel examines trends in annual growth. The median nominal growth rates towards the end of our analysis period are notable: the five consecutive annual periods from 2010 to 2014 saw median growth rates which are low in the context of previous annual change. The decline in 2010 is particularly distinctive: with a median nominal relative growth rate of 0.98, the typical charity saw a decrease of 2 per cent in their headline income. When we also consider inflation these declines are even more pronounced, with consecutive annual periods from 2009 to 2014 where the median charity saw a sizeable decline in real income from year to year. The second panel in Figure 2 considers the cumulative implications of these annual trends for the level of voluntary organisations’ income. This illustrates the scale of the impact of the period of recession and austerity across the voluntary sector as a whole: the cumulative growth index, which changes little for the majority of the analysis period, shows a distinctive decline from 98.1 to 85.7 in the six years since 2008: an organisation which experienced the median annual relative real growth rate for every year of the analysis period would have seen a 13 per cent decline in real income ((85.7-98.1)/98.1) between 2008 and 2014.
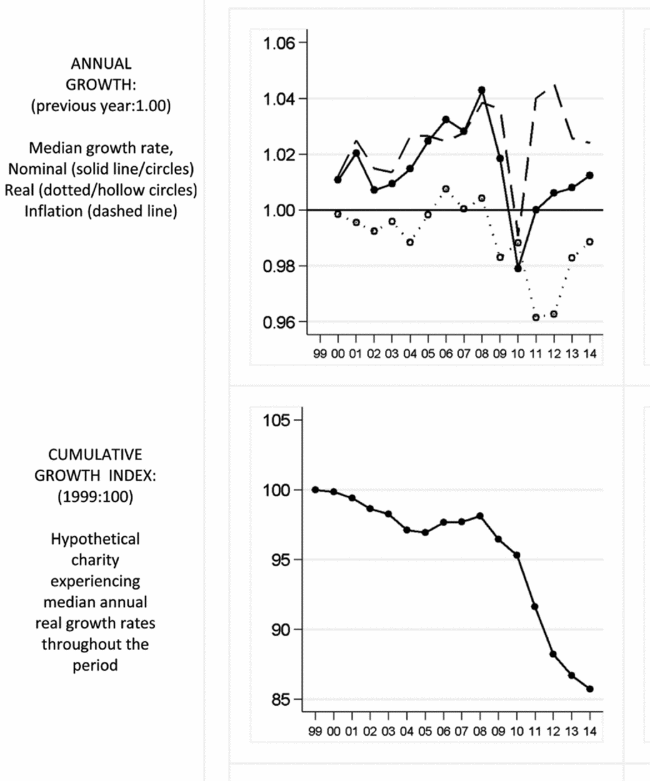
Figure 2. Annual and cumulative growth: all charities
Patterns by organisation size
Figure 3 presents the results disaggregated for organisations of different size, defined by headline incomeFootnote 5 . The period of recession and austerity affected charities of all sizes, with distinctive declines in nominal and real median annual growth rates at the end of the analysis period. However, the results show that medium sized charities have been the most significantly affected: the cumulative growth index shows declines in real income between 2008 and 2014 of 17 per cent ((74.5.-90.3)/90.3) and 16 per cent ((85.6.-101.6)/101.6) for charities of size £10k–100k and £100k–£1m respectively, compared with a decline of 7 per cent for those of size £1m-10m and an increase of 3 per cent for those of size £10m+. The smallest charities of all (£1k–10k) showed declines of 6 per cent between 2008 and 2014. The considerable cumulative declines for charities of size £10k–100k and £100k–£1m reflect a combination of sizeable real median annual declines in income and a longer period of consecutive annual declines: compared to larger charities, declines in income started sooner, were deeper and persisted longer.
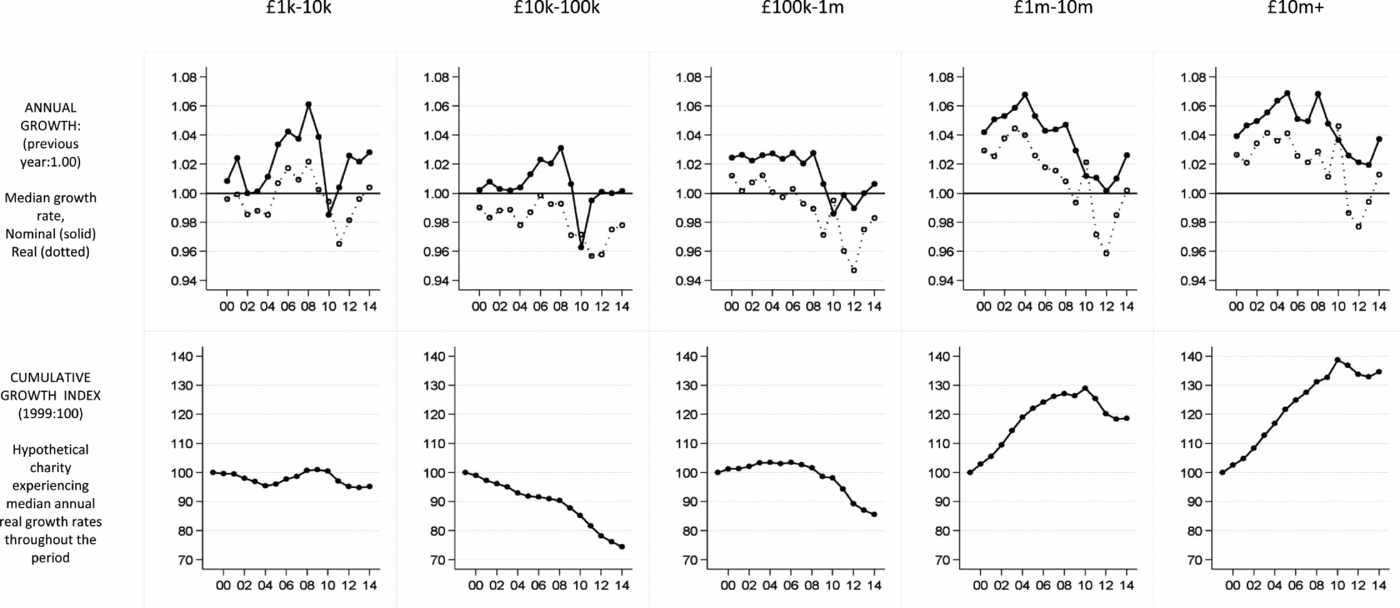
Figure 3. Annual and cumulative growth: patterns by organisation size
Organisations experiencing distinctive decreases in income
The results show that certain kinds of charitable organisations have experienced particularly sizeable declines in income in recent years (Figure 4). This includes infrastructure organisations, including volunteer centres and councils for voluntary services, that provide volunteering brokerage and support and advice to other voluntary organisations (ICNPO category ‘philanthropic intermediaries and voluntarism promotion’). Recent years have seen reduced ‘horizontal’ support for the sector, reflecting a shift in emphasis in the relationship between government and the voluntary sector (Macmillan, Reference Macmillan2013a). Indeed cuts in funding from local and central government are reflected in distinctive recent income trends: in just one year – 2012 – the median organisation saw a nominal decline in income of 10 per cent and a real decline of 14 per cent. Income trends for charities within the ICNPO Law and Advocacy category follow a similar pattern, with the median organisation experiencing a real term decline in income of 7 per cent in 2012. Organisations seeking to help people into employmentFootnote 6 , and organisations involved in culture and recreationFootnote 7 , have also been affected by the period of recession and austerity: the median annual growth rates illustrate recent declines in income that are distinctive compared to earlier years, with the change between 2008 and 2014 in the cumulative growth index showing respective declines of 16 per cent and 11 per cent in real income over the period. While the recent trends in income for infrastructure, law and advocacy, and employment charities largely reflect declines in public funding, the trends for organisations involved in culture and recreation may reflect the combination of a decline in public funding with reduced income from individuals in the form of fees and donations.

Figure 4. Annual and cumulative growth by ICNPO category: organisations experiencing distinctive decreases in income
Health and social care
Figure 5 illustrates trends in headline income for charities involved in health and social careFootnote 8 . The median nominal annual growth rate for charities providing social services – including those working with children and families, with the elderly, and with people with physical, sensory or learning disabilities – was distinctively low towards the end of the analysis period. This led to successive years of median annual declines in income in real terms from 2011 to 2014: a period in which cuts in funding for local government, important purchasers of social care, were feeding through to the voluntary sector. Charities involved in mental health / crisis intervention experienced similar trends in income, with sizeable median annual real declines in income at the end of the analysis period. Therefore a charity involved in social services, and a charity involved in mental health/crisis intervention, would each have seen cumulative declines in real income of 8 per cent between 2008 and 2014 if they had experienced the respective median annual relative real growth rates for each year of the analysis period. While trends for charities within the ‘other health services’ category – which includes those providing support for long-term health conditions, those involved in public health and wellness education, and those involved in emergency medical services – have been relatively resilient, annual growth rates since 2008 are distinctively low in the context of previous years. Therefore health charities, as well as those working in social care, have been affected by the period of economic downturn and austerity. Indeed while the NHS budget has been relatively protected overall, certain areas like mental health have experienced particular funding pressures (Gilbert, Reference Gilbert2015). Recent years have also seen considerable reorganisation, with Clinical Commissioning Groups replacing Primary Care Trusts as commissioners of local healthcare services and the transfer of accountability for public health from the NHS to local government, which may have disrupted established relationships between charities and commissioners.
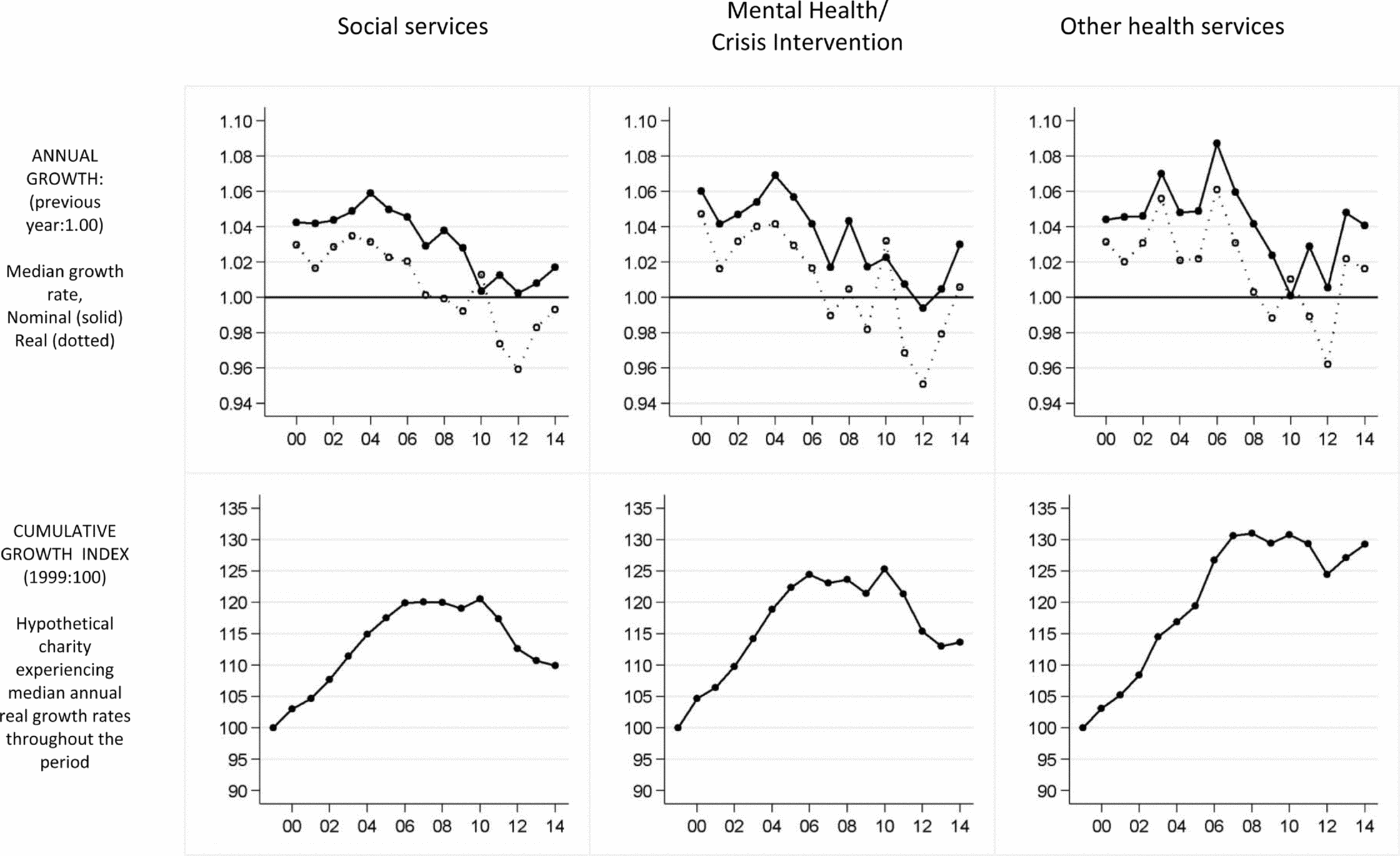
Figure 5. Annual and cumulative growth by ICNPO category: charities in health and social care
Community organisations
Figure 6 illustrates trends in headline income for different kinds of community organisations: Parent Teacher Associations (PTAs), neighbourhood organisations involved in economic/social/community developmentFootnote 9 , village halls, and youth groups. The end of the analysis period has seen consecutive years of negative median real growth for PTAs and neighbourhood development organisations that are distinctive in comparison to previous years, reflecting a combination of low median nominal growth and high inflation. This has implications for cumulative growth: a PTA or neighbourhood development organisation which experienced the respective median annual relative real growth rates for each year of the analysis period would have seen respective declines in real income of 20 per cent and 13 per cent between 2008 and 2014. While the income trends of village halls and youth groups at the end of the analysis period are less distinctive, for these organisations there is also evidence of a decline in real income – with respective declines in the cumulative growth index of 9 per cent and 7 per cent since 2008.
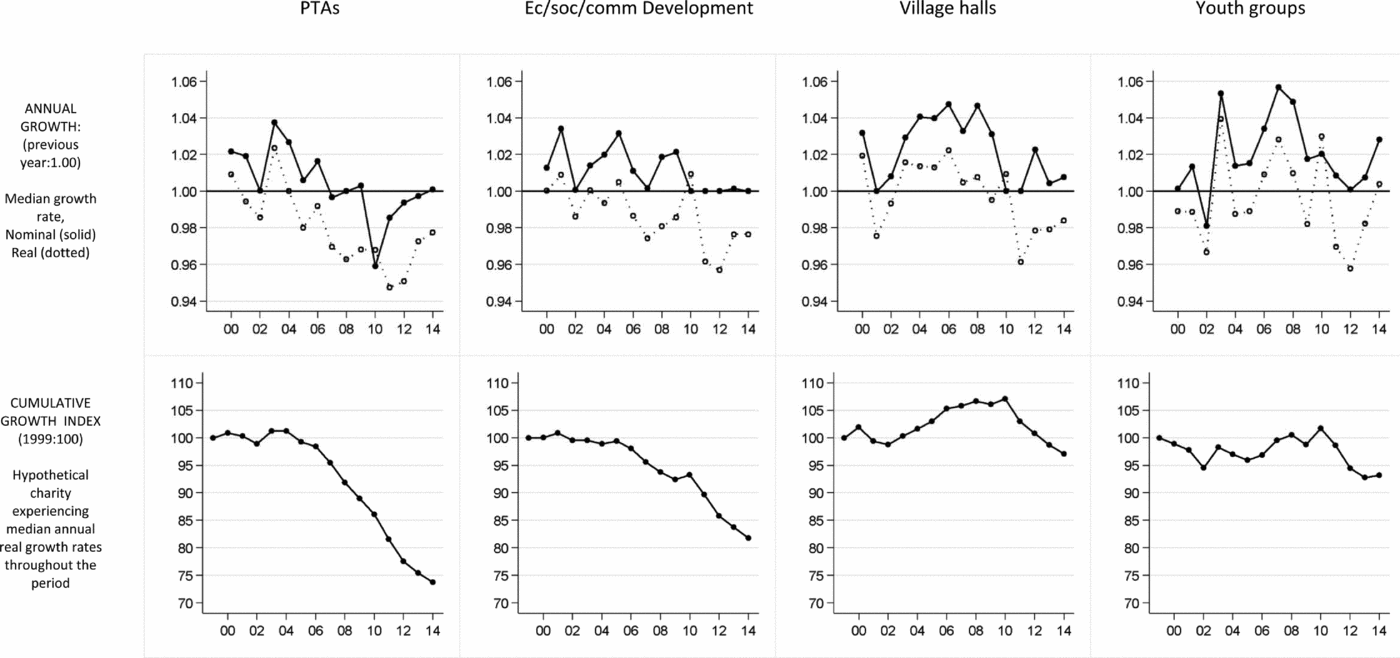
Figure 6. Annual and cumulative growth by ICNPO category: community organisations
Organisations experiencing longer-term decreases in income
Some organisations were experiencing median real annual declines in income even before the period of recession and austerity. This applies to those providing ‘Income Support & Maintenance’ – a category which includes fraternal benevolent funds and small historic local funds providing cash assistance. It also applies to charitable funds providing support to NHS trusts or hospitals (ICNPO category ‘Hospitals & Rehabilitation’Footnote 10 ) – a category which includes hospital leagues of friends. Real median growth rates for organisations in these categories show sizeable and consecutive annual declines for much of the analysis period, with clear implications for cumulative growth (Figure 7). Therefore, while there is also some evidence of distinctive declines in income during the period of recession and austerity – the median charity in the ‘Hospitals & Rehabilitation’ category experienced an annual decline in real income of 11 per cent in 2010 – it is important to place this within the context of longer-term income decline.
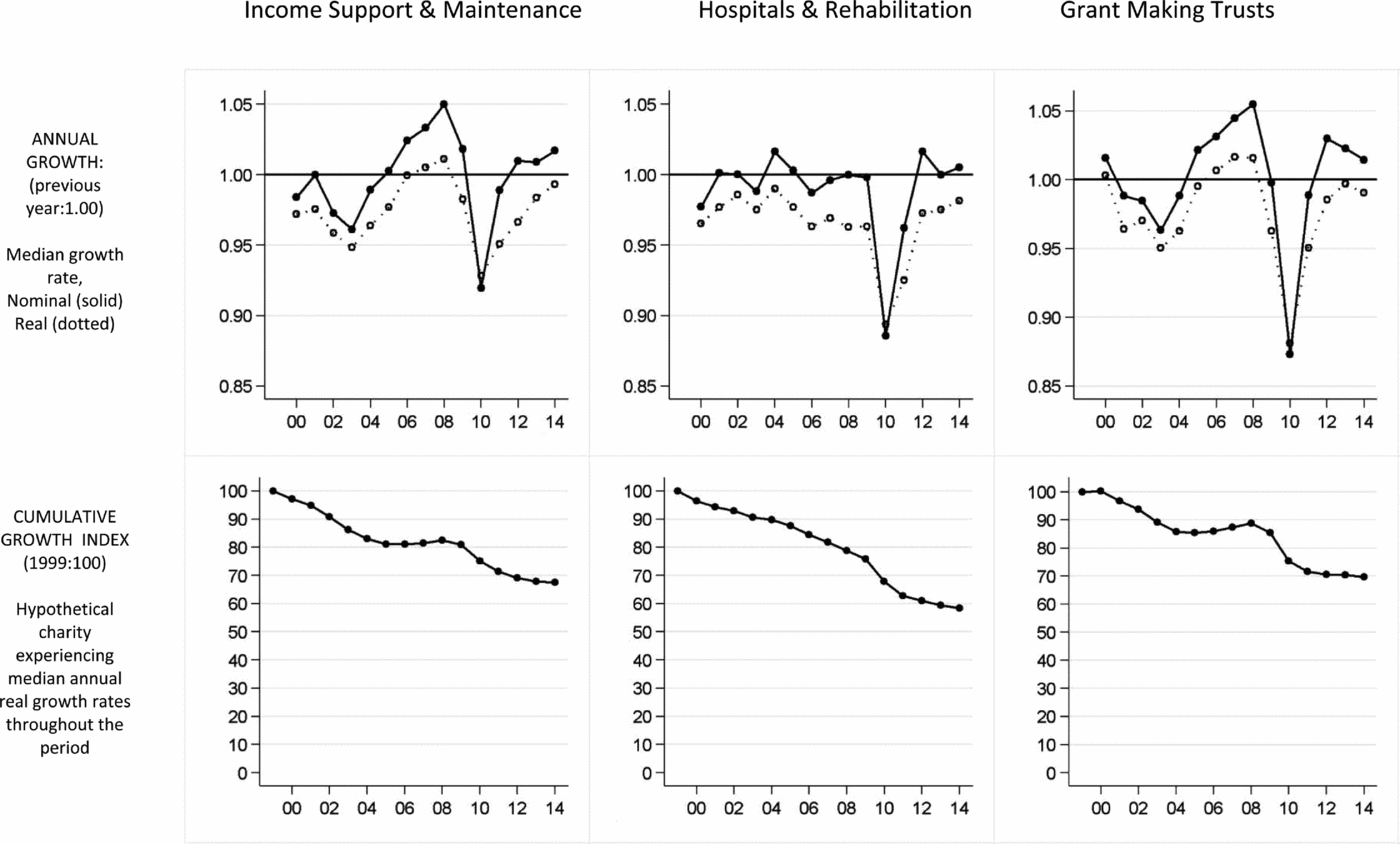
Figure 7. Annual and cumulative growth by ICNPO category: organisations experiencing longer-term decreases in income
Organisations experiencing longer-term increases in income
For some fields of charitable activity, organisations’ income has been increasing since 1999 and has been relatively resilient during the period of recession and austerity. This includes organisations working in international development, preschools (playgroups and nurseries), and hospices/nursing homes. It also includes charities engaged in adult / continuing education (ICNPO category ‘other education’), with the overall increase in this category strongly influenced by the growth in income of local groups of the University of the Third Age (U3A)Footnote 11 . Real median growth rates show sizeable annual increases in income for organisations in these categories over much of the analysis period (Figure 8). This is reflected in cumulative growth: a preschool which experienced the respective median annual relative real growth rates for each year of the analysis period would have more than doubled in size between 1999 and 2014; an international developmentFootnote 12 charity or hospice/nursing home would each have grown by more than 75 per cent; and a charity engaged in adult/continuing education would have grown by more than 50 per cent. Recent years show evidence of a decrease in median real annual growth, and a stalling in cumulative growth, for international development charities and preschools. However it is the sizeable increases in income across the analysis period, rather than the impact of the period of recession and austerity, that is the most salient feature of trends for these organisations.
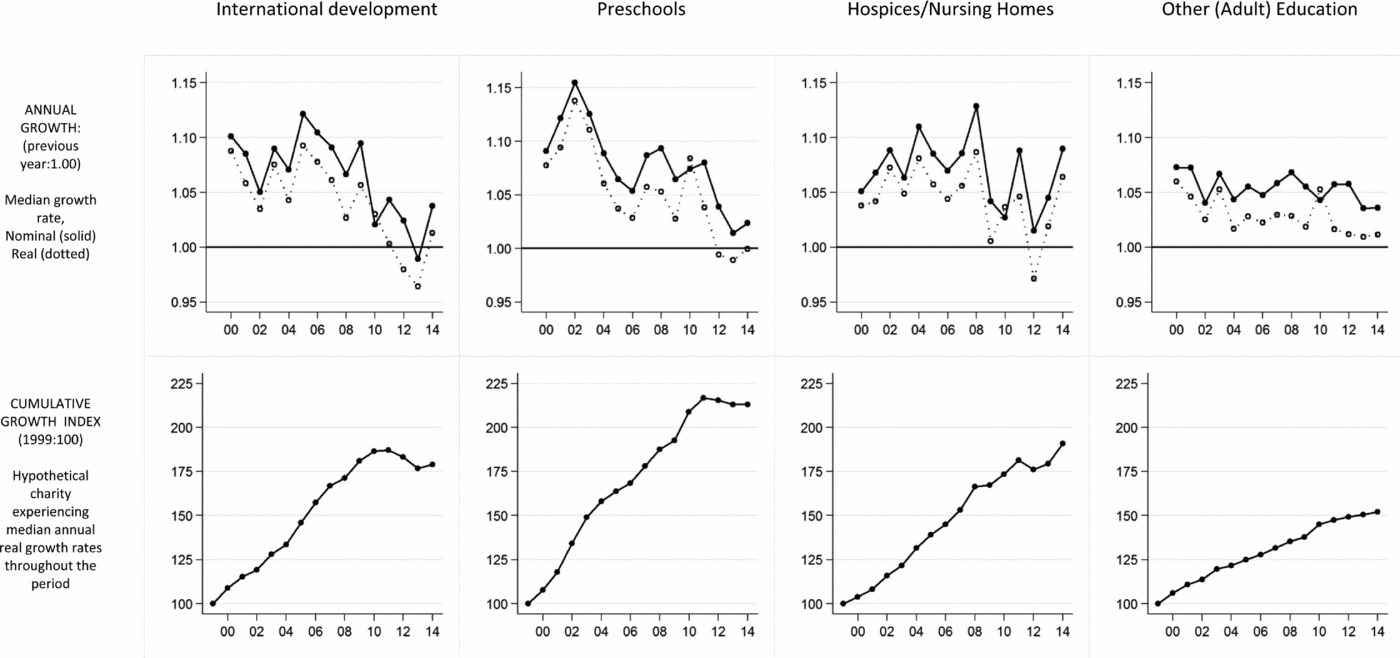
Figure 8. Annual and cumulative growth by ICNPO category: organisations experiencing longer-term increases in income
Patterns by local authority context
Figure 9 examines the differences in the income trends of charities according to local authority contextFootnote 13 . Compared to charities in the 20 least deprived local authorities (LAs), charities in the most deprived 20 LAs experienced a more sizeable median real annual income decline in five of the six annual periods after 2008. Therefore, in the period since 2008, a charity which experienced the respective median annual relative real growth rates each year would have experienced a 9 per cent decline in income in the least deprived LAs – compared to a 14 per cent decline in the most deprived LAs.
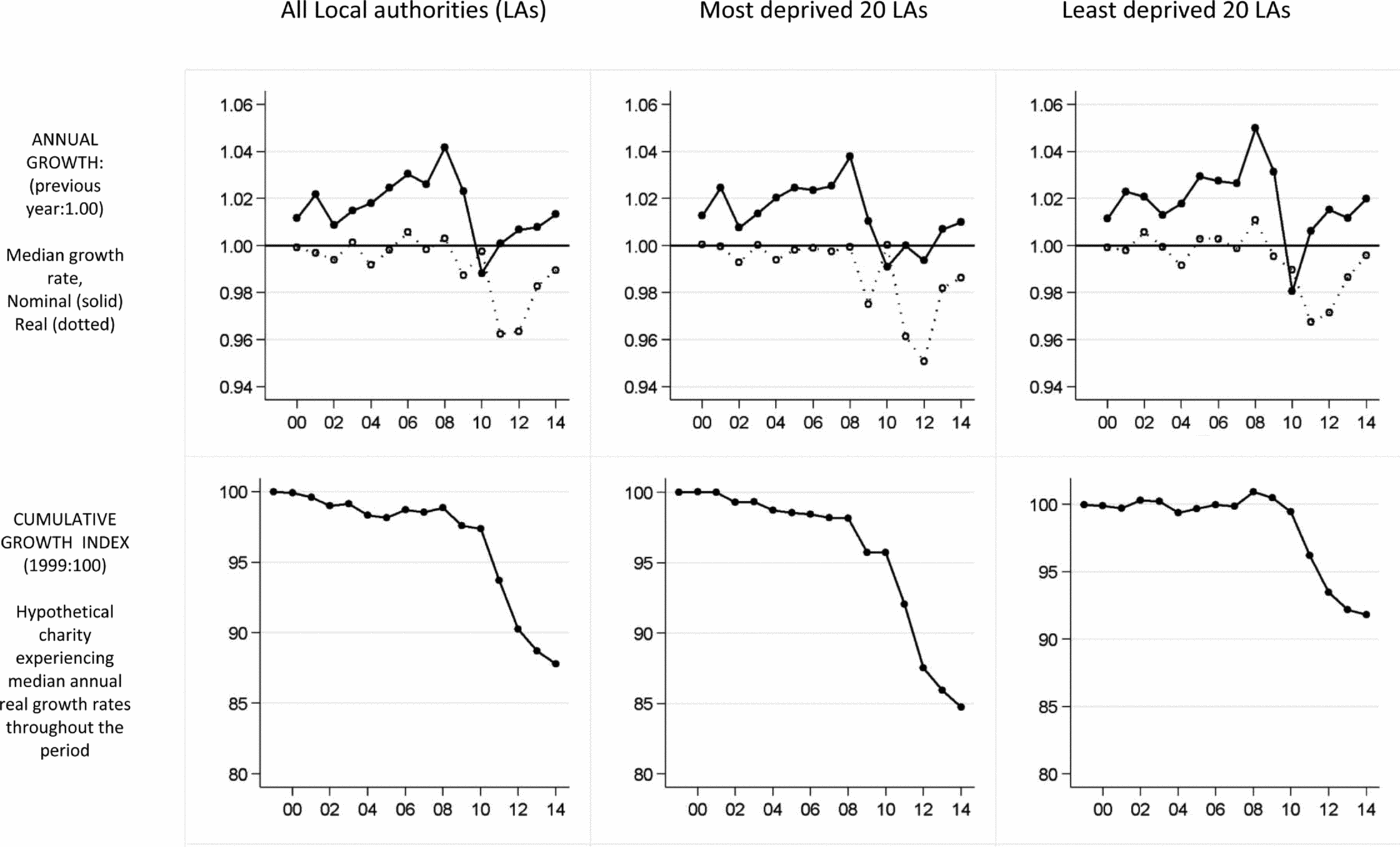
Figure 9. Annual and cumulative growth by local authority context: differences according to area deprivation
Placing results within the context of GDP trends
There were quarterly declines in GDP in the last three quarters of 2008 and in the first two quarters of 2009 (Figure 1). This paper's results suggest that the timing of decline in the income of charities is closely aligned to the timing of declines in GDP. Given the definition of annual periods used in this paperFootnote 2 , the relevant periods in which charities were exposed to negative growth in the economy for at least part of their financial year are 2009 (relating to charities’ financial years that ended sometime between May 2008 and April 2009) and 2010 (relating to charities’ financial years that ended sometime between May 2009 and April 2010). Looking at the population of charities as a whole (Figure 2), these periods saw a median real term decline in charities’ income in 2009 and, more strikingly, the only median nominal income decline in the analysis period in 2010. The subsequent years of slow recovery in output that was a distinctive feature of the economic downturn (Figure 1) saw annual periods of negligible median nominal growth in charities’ annual income and sizeable real term declines (Figure 2). However there are also differences between charities in the timing of decline: charities in certain ICNPO categories (voluntarism promotion (infrastructure); law and advocacy; employment; mental health/crisis intervention) experienced median nominal declines in income in 2012, rather than 2010, reflecting the timing of reductions in public funding. Similarly the median nominal income decline in 2012 in the most deprived local authorities (Figure 9) reflects the timing of cuts in public funding – and, compared to a corresponding nominal increase in the least deprived areas in 2012, is consistent with the reliance of charities on public funding in more deprived areas (Clifford et al., Reference Clifford, Geyne-Rahme and Mohan2013).
Discussion
This paper provides, for the first time, authoritative empirical evidence about trends in the income of English and Welsh charities during the ‘Great Recession’ and subsequent period of public spending austerity. The analysis is based on a unique longitudinal dataset, which has been constructed from administrative records, providing a basis for assessing the impact of recession and austerity by placing organisations’ recent income within the context of longer-term trends. The results should be of widespread interest, not only to researchers, but also to policy makers, charities, grantmaking organisations and members of the public. Indeed while there has been extensive public concern about the effect of recession and public spending reductions on the voluntary sector, this has not been accompanied by empirical information about the nature and scale of recent changes in charities’ income, or about the kinds of organisations that have been most significantly affected. This lack of evidence has implications: it is harder for policy makers to develop appropriately focused and targeted support without clear information about the scale of the challenges that the voluntary sector is facing. In this context, this paper extends our understanding about the impact of the Great Recession and the age of austerity on charitable organisations in several ways.
First, the analysis illustrates the scale of the impact on the charitable sector for the first time. The declines in income since 2008 are distinctive in the context of longer-term trends. Particularly distinctive is the number of consecutive years where the median charity has experienced a sizeable real term annual decline in income: the latest financial figures, from 2014, show that the median real annual growth rate was negative for the sixth consecutive year. Therefore annual declines in income have been compounded by further annual declines, leading to substantial cumulative declines in income – with a 13 per cent change in the cumulative growth index between 2008 and 2014 across the population of charities as a whole.
Second, the results show that the impact of the challenging economic conditions has been very different for different sizes of organisations. The smallest relative declines in income have been for the largest charities. This is consistent with predictions from organisational sociology that large organisations, since they more able to adopt a variety of adaptive strategies to respond to changes in their environment (Mosley et al., Reference Mosley, Maronick and Katz2012), are better equipped to be resilient in times of economic uncertainty. In contrast, there have been particularly significant declines in income – of 16 per cent and 17 per cent respectively between 2008 and 2014 – for small to medium sized charitable organisations with annual incomes of between £10k and £100k and between £100k and £1m. These results are important. In particular, they are consistent with predictions made by commentators about a possible ‘hollowing out’ of the charitable sector – reflecting the particular vulnerability of mid-sized charities, more likely to be involved in service delivery and to be dependent on local authority funding, in an era of public spending austerity which has seen particularly sizeable declines in local government funds (Taylor et al., Reference Taylor, Parry and Alcock2012; Harris, Reference Harris2009; Bagwell, Reference Bagwell2015; Hastings et al., Reference Hastings, Bailey, Gannon, Besemer and Bramley2015; Lupton et al., Reference Lupton, Burchardt, Fitzgerald, Hills, McKnight, Obolenskaya, Stewart, Thomson, Tunstall and Vizard2015).
Third, the results show that, despite substantial cumulative declines in income across the population of charities as a whole, there has also been considerable variation in the impact of the Great Recession and the ‘age of austerity’ according to the ‘vertical policy field’ within which organisations are embedded (Kendall, Reference Kendall2003). Thus local government departments have been faced with very significant cuts in expenditure (Hastings et al., Reference Hastings, Bailey, Gannon, Besemer and Bramley2015; Lupton et al., Reference Lupton, Burchardt, Fitzgerald, Hills, McKnight, Obolenskaya, Stewart, Thomson, Tunstall and Vizard2015) – and this is reflected in the distinctive declines in income of, for example, infrastructure, employment and social services charities. In contrast, government spending on international development was one of the few areas of public spending protected from cuts in expenditure. Since a significant fraction of Official Development Assistance (ODA) is channelled through voluntary organisations, this provided a measure of resilience to international development charities even in a climate where it is difficult to raise money from individuals. The wider lesson is that, since the growth of government funding of voluntary organisations over recent years has been driven by independent dynamics within particular policy fields (Kendall, Reference Kendall2003), we should not expect uniform trends in voluntary organisations’ statutory income during periods of recession and austerity.
The differences between ‘vertical fields’ of charitable activity also illustrate the value of a longer-term empirical perspective, which situates the importance of the period of recession and austerity to voluntary organisations within the context of wider social and economic change. For example, the results show that some kinds of voluntary organisations were in decline even before the recession – including fraternal benevolent funds / local funds providing cash assistance (ICNPO category ‘Income Support & Maintenance’), and charitable funds providing support to NHS trusts or hospitals (ICNPO category ‘Hospitals & Rehabilitation’) (Figure 7). This is consistent with, for example, narrative accounts of the difficulty of recruiting new volunteers to sustain the work of local leagues of friends (Powis, Reference Powis2012). Similarly, we can better understand the relative resilience in the income of certain kinds of voluntary organisations during the recent challenging economic period – including U3As, (strongly influencing overall trends in the ICNPO category ‘other education’), hospices/nursing homes, preschools and charities working in international development (Figure 8) – by considering the social, demographic, and policy context which explains their longer-term growth. Thus the growth of U3As should be understood within the context of population trends that show not only, in terms of chronological age, increasing numbers of older people but also, in terms of remaining life expectancy, older people who are ‘younger’ and healthier than peers in earlier cohorts (Spijker and MacInnes, Reference Spijker and MacInnes2013) and who have the accumulated resources conducive to lifelong learning. The growth of hospices reflects an increase in the number of people with complex health and social care needs (Commission into the Future of Hospice Care, 2013); the strong growth of international development charities reflects in part the growth in government funding from ODA, which as a proportion of UK Gross National Income increased from 0.26 per cent in 1997 to a landmark 0.72 per cent in 2013 (DFID, 2014). The growth in income of preschools reflects the major policy focus in the UK since the 1990s on providing early childhood education and care and the associated significant increases in government funding that have seen voluntary organisations play an important role in the expansion of service provision alongside schools and for-profit providers (Brewer et al., Reference Brewer, Cattan, Crawford, Emmerson, Johnson and Miller2014).
Fourth, the results illustrate differences in the impact of the economic downturn and austerity on charitable organisations in different parts of the country. Jones et al. (Reference Jones, Meegan, Kennett and Croft2015) and Clifford et al. (Reference Clifford, Geyne-Rahme and Mohan2013) argue that it is in the more deprived areas, where need is greatest, that the implications of recession and austerity are likely to be most severe. They point to a compound effect: in more deprived local authorities, voluntary organisations are more reliant on public funding; in more deprived local authorities, cuts to local authorities’ budgets from central government have been more significant. This paper, showing declines in charities’ income since 2008 that are much more sizeable in more deprived local authorities than in less deprived local authorities, provides important empirical evidence which is consistent with these concerns about the uneven impact of austerity.
This paper's analysis provides a basis for a political challenge which contests the narrative and policy of austerity. First, the scale in decline in income across the charitable population as a whole, and particularly of mid-sized charities most likely to be funded by local government, challenges the efficacy of a policy narrative which envisages an enhanced role for voluntary organisations even as cuts in public expenditure proceed. Second, the larger decline in income that charities have experienced in more deprived parts of the country challenges the discourse of a ‘shared burden’ and emphasises the social costs that accompany austerity in the context of spatial unevenness in the voluntary sector's reliance on public funding.
We are not aware of any other studies, from any country, that have been able to provide such detail about trends in the income of charitable organisations during an economic downturn. Therefore, while these results relate specifically to English and Welsh charities during the Great Recession and subsequent public spending austerity, they also have a wider international relevance. They represent rare empirical evidence relevant to theoretical discussions about the nature of the voluntary sector and its capacity to respond to social need. According to the theory of voluntary sector failure, the voluntary sector has important strengths as a provider of social welfare but an important ‘failure’ is resource insufficiency, ‘the inability to generate [financial] resources on a scale that is adequate and reliable enough to cope with the human services problems of an advanced industrial society’ (Salamon, Reference Salamon1987:39). Importantly, while ‘philanthropic insufficiency’ is a challenge for the sector in general, it is expected to be most severe during economic downturns (Salamon, Reference Salamon1987; Smith and Grønbjerg, Reference Smith, Grønbjerg, Powell and Steinberg2006), such that income from individuals’ charitable donations declines at the time of most pressing social need (Allard, Reference Allard2009). Smith and Lipsky (Reference Smith and Lipsky1993) further argue that one implication of the significant restructuring of the way in which public services are delivered, which has seen an increased role for voluntary organisations and associated significant increases in public funding (Lewis, Reference Lewis1993; Wilding, Reference Wilding2010; Kane et al., Reference Kane, Heywood and Bass2014), is the potentially serious ramifications for the voluntary sector where an economic downturn is accompanied not by counter-cyclical policies but by fiscal austerity. Therefore the temporal manifestations of ‘philanthropic insufficiency’ – the potential for reduced income from charitable giving at the very time of increased need – may be compounded by significant cuts in funding of charitable organisations from central and local government. In general, the results in this paper are consistent with these theoretical predictions, showing distinctive declines in income for the charitable population as a whole during the Great Recession and years of public spending austerity. However they also illustrate the potential for considerable diversity in the implications of economic downturns for different fields of charitable activity.
When considering the implications of the economic crisis for voluntary organisations in other countries outside of the UK, it will be important to integrate the insights from this paper with an understanding of the particular national context. Indeed, while the recent economic downturn was global in scope (Keeley and Love, Reference Keeley and Love2010), the implications for social policy have varied between countries (Farnsworth and Irving, Reference Farnsworth and Irving2011). There have been differences between countries both in the nature and severity of the economic crisis, and in the policy response in terms of the speed, extent and distribution of cuts in public expenditure (Gough, Reference Gough, Farnsworth and Irving2011). This points to the value of future cross-country comparative research which compares the experience of charities in England and Wales with the experience of voluntary organisations in other countries.
Conclusion: widening our perspective on the implications of recession and austerity
The analysis in this paper helps to widen our perspective on the implications of the Great Recession and of public spending austerity for social policy. The important body of existing research includes information on the scale and composition of recent changes in aggregate public spending (Johnson, Reference Johnson2013; Taylor-Gooby, Reference Taylor-Gooby2012; Hastings et al., Reference Hastings, Bailey, Gannon, Besemer and Bramley2015; Lupton et al., Reference Lupton, Burchardt, Fitzgerald, Hills, McKnight, Obolenskaya, Stewart, Thomson, Tunstall and Vizard2015) and considers recent trends in the living standards of individuals and households (Jenkins et al., Reference Jenkins, Brandolini, Micklewright and Nolan2012; Johnson, Reference Johnson2013; Gregg et al., Reference Gregg, Machin and Fernández-Salgado2014; Blundell et al., Reference Blundell, Crawford and Jin2014; Lupton et al., Reference Lupton, Burchardt, Fitzgerald, Hills, McKnight, Obolenskaya, Stewart, Thomson, Tunstall and Vizard2015). However an empirical focus on individual outcomes alone is not sufficient: research within social policy should also examine the implications of recession and austerity for voluntary organisations, which provide a variety of services, resources and activities conducive to social welfare and wellbeing. For the first time, this paper's empirical evidence reveals not only the scale of the decline in income across the population of charities as a whole but also the kinds of charities that have seen the most sizeable declines. From a public policy perspective these results suggest that, in line with Jones et al.’s (2015) analysis, small- and medium-sized charities in deprived local authorities would be appropriate priorities if targeted support were to be made available. More generally this paper's empirical evidence is consistent with Ellison's (Reference Ellison, Foster, Brunton, Deeming and Haux2015) call for a political challenge which contests the narrative of austerity – and its overwhelming focus on reducing the ‘economic deficit’ through cuts in public spending as a means of economic recovery – by paying greater attention to the ‘social deficit’ and to the far-reaching social consequences of austerity policy.
Acknowledgements
This work was supported by the Economic and Social Research Council [grant number ES/K00137X/1]. Many thanks to John Mohan, Director of the Third Sector Research Centre (TSRC), for his continued support and to the Charity Commission for use of their Register data (http://data.charitycommission.gov.uk/). Many thanks to David Kane, and the National Council of Voluntary Organisations (NCVO), for making available their classification of English and Welsh charities according to the ICNPO. Many thanks to the editors and referees for their thoughtful and constructive comments and suggestions. Any errors, omissions or opinions are the responsibility of the author alone. The Charity Commission data are subject to Crown database copyright or Crown Copyright and contain public sector information licensed under the terms of the Open Government licence v2.0. All necessary legal requirements relating to its use and reuse have been complied with.
Supplementary material
To view supplementary material for this article, please visit http://dx.doi.org/10.1017/S0047279416000325


