Self-assessed intelligence has been found to have moderate correlations (0.30–0.40) with objectively assessed intelligence (Chamorro-Premuzic et al., Reference Chamorro-Premuzic, Furnham and Moutafi2004; Furnham & Chamorro-Premuzic, Reference Furnham and Chamorro-Premuzic2004). In a sample of 3,785 pairs of young twins, self-assessed intelligence was demonstrated to be significantly heritable (51%), and was also shown to have substantial genetic correlations with both objectively assessed intelligence (0.53) and school achievement (0.65–0.79; Greven et al., Reference Greven, Harlaar, Kovas, Chamorro-Premuzic and Plomin2009). Lykken et al. (Reference Lykken, Bouchard, McGue and Tellegen1993) conducted a study with 903 twin pairs, in which they factor analyzed 291 items (across measures assessing vocational interests, leisure time interests, and talents) and found 39 factors (e.g., industrial arts, medical and dental, personal appearance) which were then reduced to 11 higher-order (super) factors (e.g., intellectual and educated, personal attractiveness and charm, artificer vs. athlete). Genetic analysis of these reduced dimensions suggested a heritability of approximately 50%, averaged across the factors. These results suggest that there is meaningful variance in self-assessments of intelligence, interests, and abilities.
In a behavior genetic investigation of the ability or talent items from the Lykken et al. (Reference Lykken, Bouchard, McGue and Tellegen1993) study, Schermer et al. (Reference Schermer, Johnson, Vernon and Jang2011) found that the 40 ability items could be reduced to 10 factors, including: academic (e.g., writing abilities, memory), creative (e.g., artistic), domestic (e.g., gardening, sewing), entrepreneur (e.g., buying and selling), intellectual (e.g., good at intellectual games), interpersonal (e.g., good listener), physical (athletic), political (e.g., holding office, public speaking), practical (e.g., carpentry), and vocal (e.g., languages, singing) abilities. All of the ability factors were found to have a heritable component, ranging from 42% for the intellectual factor to 68% for both the practical and vocal factors. Unique environment effects accounted for the remaining variance as common environment influences were found to be non-significant. Many of the ability factors were then found to have significant phenotypic, genetic, and environmental correlations with personality factors. The present study expands on the analyses of the ability factors found by Schermer et al. (Reference Schermer, Johnson, Vernon and Jang2011) by examining the relationships at the phenotypic, genetic, and environmental levels with measured intelligence. By examining these correlations, a better understanding may be found of the relationship between which abilities individuals report they have and how they perform on a standardized intelligence measure.
Method
Participants
Participants were 516 adult individuals (381 women and 135 men) with an average age of 23.68 years (SD = 6.17, range 13–45) from the Western Ontario Twin Project, who were recruited through newspaper advertisements and were the same participants described in the study by Schermer et al. (Reference Schermer, Johnson, Vernon and Jang2011). The sample consisted of 148 monozygotic (MZ) female twins, 38 MZ male twins, 82 dizygotic (DZ) female twins, 18 DZ male twins, 30 DZ opposite sex twins, 104 non-twin sisters, 32 brothers, and 64 opposite sex non-twin siblings. Age was not found to differ across the subgroups, F (7,499) = 1.23, p > .28). All participants were included and were treated as individuals for the phenotypic analyses; for the analyses involving heritability and environmental estimates, MZ and same-sex DZ twins only were included in the analyses because of the lower within sibling correlations for the opposite-sex DZ twins and non-twin siblings, which may artificially inflate the heritability estimates.
Materials and Test Session
Each participant completed a 40-item self-report talent scale adapted from Lykken et al. (Reference Lykken, Bouchard, McGue and Tellegen1993) measuring a wide variety of areas, such as mechanical ability, sewing, memory, buying, and selling. Each item is responded to with a 1–4 response key representing behavioral anchors. For example, the anchors for the judgment item range from ‘You often regret your decisions, don't really trust your own judgment’ to ‘Other people ask your advice because you have good judgment, seldom make a decision that you later regret’. These self-report measures were part of a larger battery of scales (see Vernon et al., Reference Vernon, Jang, Harris and McCarthy1997). The factor structure of the talent items has been previously published (see Schermer et al., Reference Schermer, Johnson, Vernon and Jang2011) and was found to produce 10 factors. Talent factor scores were calculated by aggregating the highest absolute loadings for each factor. Scales ranged from two items (for the Creative scale) with an internal consistency (reliability) value of 0.32 to the six-item Political scale, with an internal consistency estimate of 0.78.
Participants also completed the multidimensional aptitude battery (MAB; Jackson, Reference Jackson1984; see Harris et al. (Reference Harris, Vernon and Jang1998) for a description of the test sessions), a timed, group-administered intelligence test consisting of 10 scales, of which 5 are verbal subtests (information, comprehension, arithmetic, similarities, and vocabulary) and 5 are performance subtests (digit symbol, picture completion, spatial, picture arrangement, and object assembly). Scoring of the MAB results in 10 subtest scores (5 verbal and 5 performance), a verbal intelligence score, a performance intelligence score, and a full-scale intelligence score. The scale scores have been found to have high internal consistency values and to correlate highly with other measures of intelligence, such as the Wechsler adult intelligence scales — revised (Carless, Reference Carless2000) and Ravens advanced progressive matrices (Kranzler & Jensen, Reference Kranzler and Jensen1991).
Results
Genetic Analyses of the Measures
The univariate genetic analyses for the 10 ability scores have been previously reported (see Schermer et al., Reference Schermer, Johnson, Vernon and Jang2011). All of the ability scores were found to have a genetic component, with heritability estimates ranging from 42% for intellectual abilities to 68% for both the practical and vocal abilities. No common environmental effects were found in the genetic analyses of the ability scores.
Within twin pair correlations were computed for the 10 intelligence subtests and the three composite scores for the MZ and same-sex DZ twin pairs. These correlations are reported in Table 1 and demonstrate that there was greater similarity in scale scores for the MZ twins compared to the DZ twins. Univariate genetic analyses were conducted on the within twin pair variance-covariance matrices using the program Mx (Neale et al., Reference Neale, Boker, Xie and Maes2006). In these analyses, the phenotypic score is expressed as a linear function of three factors: genetic (A), common environment (C), and specific environment (E). In conducting univariate genetic analyses, four models are tested (a full ACE model, an AE model, a CE model, and an E only model) and the model which has the best fit to the data, and which is the most parsimonious, is the model chosen as the best-fitting model (Neale & Cardon, Reference Neale and Cardon1992). Once the best-fitting model is decided, heritability (a2), common environment (c2), and specific environment (e2) values are computed from the standardized parameter estimates. These weights are standardized such that the total aggregate phenotypic variance is equal to one. The results of the univariate genetic analyses are listed in Table 1. For seven of the ten subscales and for the performance intelligence composite score, the best-fitting model was an AE model. For two of the subscales (comprehension and vocabulary) and for the verbal and full-scale composite scores, the full ACE model was found to be the best-fitting model, but for both of the two subscales and for the full-scale composite, the common environment 95% confidence interval contains zero, suggesting non-significant c2 effects. Only the verbal subscale, information, was found to be best fit by a CE model. For the results with a genetic component, heritability estimates were found to range from 27% for the verbal composite intelligence score to 83% for the performance composite intelligence score.
TABLE 1 MZ and DZ Correlations and Univariate Genetic Analyses for the 10 MAB Scale Scores and Three Intelligence Composite Scores

Note: Estimates are based on the best-fitting model. MZr = monozygotic correlation; DZr = dizygotic correlation; a2 = additive genetic effects; c2 = common environment effects; e2 = unique environment effects; 95% CI = 95% confidence interval.
Phenotypic Correlations between Ability Factors and Intelligence
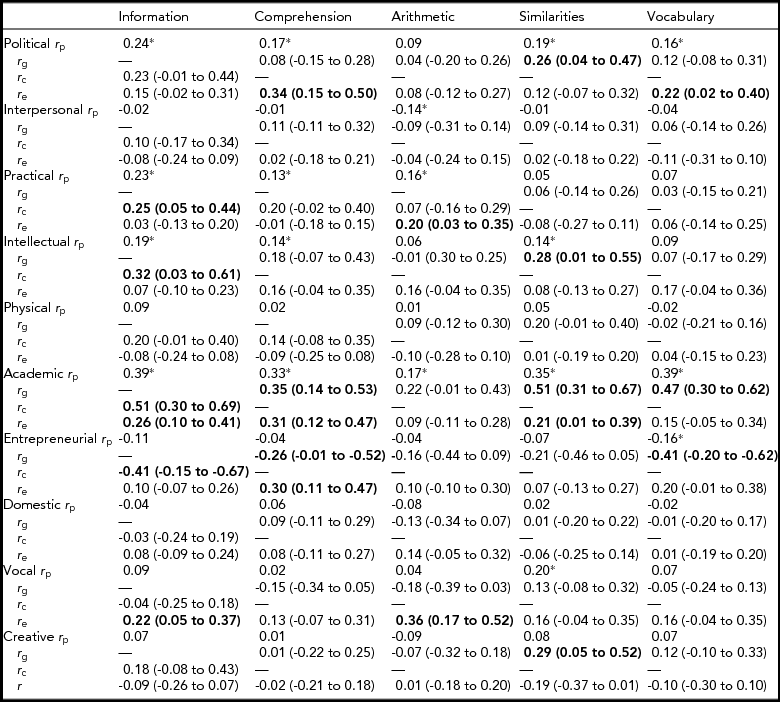
Tables 2, 3, and 4 list the phenotypic (observed) correlations between the 10 ability scores and the verbal intelligence subscales, the performance intelligence subscales, and the three intelligence composite scales, respectively. For the verbal subscales information and comprehension, positive relationships were found with the political, practical, intellectual, and academic ability scores. For the verbal subscale Arithmetic, positive correlations were found with the practical and academic ability scales and a negative correlation was found with the interpersonal ability scale. For the verbal subscale Similarities, positive correlations were found with the political, intellectual, academic, and vocal ability scales. For the verbal subscale Vocabulary, positive correlations were found with the political and academic ability factors and a negative correlation was found with the entrepreneurial scale.
TABLE 2 Phenotypic (r p), Genetic (r g), and Environmental (Common r c and Unique r e) Correlations Between the MAB Verbal Scales and the Ability Factors

Note: *p < .01 (two-tailed); values in brackets represent the 95% confidence intervals. Interval values in bold do not pass through zero.
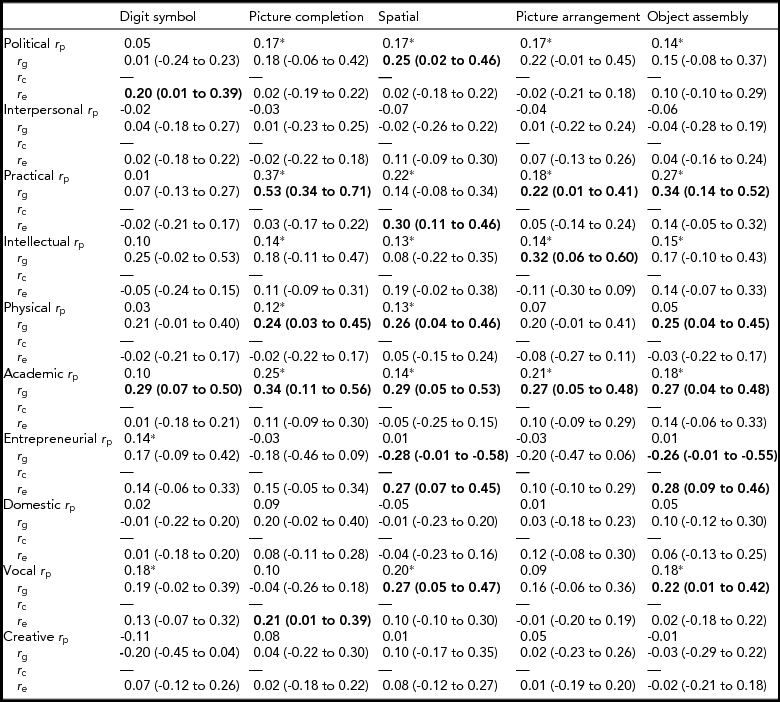
TABLE 3 Phenotypic (r p), Genetic (r g), and Environmental (Common r c and Unique r e) Correlations Between the MAB Performance Scales and the Ability Factors

Note: *p < .01 (two-tailed); values in brackets represent the 95% confidence intervals. Interval values in bold do not pass through zero.
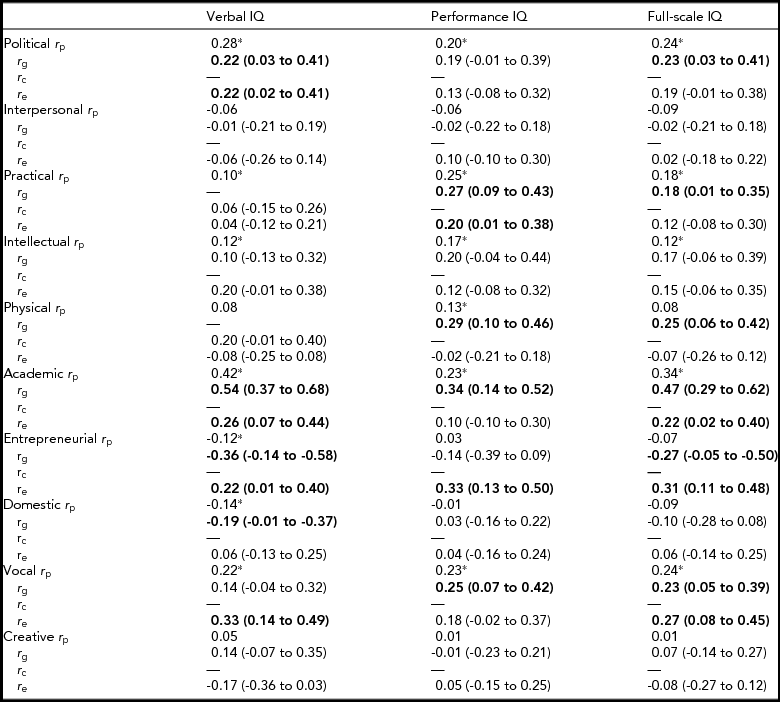
TABLE 4 Phenotypic (r p), Genetic (r g), and Environmental (Common r c and Unique r e) Correlations Between the MAB Intelligence Composite Scores and the Ability Factors

Note: *p < .01 (two-tailed); values in brackets represent the 95% confidence intervals. Interval values in bold do not pass through zero.
For the performance subscale Digit Symbol, positive correlations were found with the entrepreneurial and vocal ability scales. For the performance subscales Picture Completion and Spatial, positive correlations were found with the political, practical, intellectual, physical, and academic ability scores. Spatial scores were also found to correlate positively with the vocal ability scores. For the performance subscales Picture Arrangement and Object Assembly, positive correlations were found with the political, practical, and intellectual ability scores. Object Assembly was also found to correlate positively with the vocal ability score.
For the composite intelligence scores, verbal, performance, and full-scale intelligence was found to correlate positively with the political, practical, intellectual, academic, and vocal ability scores. Verbal intelligence was found to correlate negatively with the entrepreneurial and domestic ability scores. Performance intelligence was found to have a positive correlation with the physical ability score.
Genetic and Environmental Correlations between Ability Scores and Intelligence
Bivariate genetic analyses were performed using Mx (Neale et al., Reference Neale, Boker, Xie and Maes2006) to further examine the covariance between each of the ability and intelligence scores. Cholesky or triangular decomposition (see Neale & Cardon, Reference Neale and Cardon1992) was applied to the MZ and DZ mean square between- and within-pair covariance matrices to calculate genetic and environmental correlations. For these analyses, a twin's score on an ability scale is correlated with their co-twin's score on an intelligence scale. If these cross-correlations are higher for MZ twins than for DZ twins, this suggests that the phenotypic correlation between the ability score and the intelligence score is possibly due to some common genetic factor(s).
In conducting the bivariate genetic analyses, three models were computed and the fit estimates were then assessed (Neale & Cardon, Reference Neale and Cardon1992). In particular, an AE model (genetic and unique environmental covariation, which includes measurement error) was computed as well as a CE (common and unique environment), and an environmental (E) covariation-only model. The results of the best-fitting model are presented in Tables 2, 3, and 4 for the verbal intelligence subtests, the performance intelligence subtests, and intelligence composite scores, respectively. One cautionary note in reading the genetic and environmental correlations is that the confidence intervals should be considered. Given the relatively small sample size in the present study, the valence (but not the magnitude) of the genetic correlations is interpretable for those in which the 95% confidence interval does not include zero.
As stated above, the only intelligence subscale to be best fitted by a CE model was the Information verbal subtest. As presented in Table 2, many of the significant phenotypic correlations between Information and the ability scores had common and/or unique environmental correlations. In contrast, many of the other verbal subscale correlations with the ability scales had genetic and/or unique environmental correlations. In Table 3, the results demonstrate that most of the phenotypic correlations between performance intelligence subtests and the ability scores had genetic and/or unique environmental correlations. Similar results (such that the observed phenotypic correlations had genetic and/or unique environmental correlations) were also found with the intelligence composite scores (verbal, performance and full-scale intelligence) presented in Table 4.
Discussion
The present study expands on the self-assessed ability literature by examining how self-assessed abilities correlate with measured intelligence at the phenotypic, genetic, and environmental levels. All of the intelligence dimensions and composite scores were found to have a significant genetic component except for the verbal subscale of Information, which was found to be best fit by an environmental effects model. Although these results require replication, they suggest that the information content is culturally influenced and thus showed more environmental influences. The remaining intelligence subscales and composite scores were found to have some significant phenotypic correlations with scores on the self-report ability factors, and for many of these correlations, the bivariate genetic analyses resulted in genetic and/or environmental correlations (common environmental correlations were found for many of the correlations with abilities for the Information subscale).
For many of the correlations found between self-assessed abilities and measured intelligence, the magnitude was found to be similar to the values reported between self-assessed intelligence and measured intelligence (Chamorro-Premuzic et al., Reference Chamorro-Premuzic, Furnham and Moutafi2004), and may be considered to be fairly robust as there is no substantial overlapping method variance (abilities were assessed using behaviorally anchored rating scales with no time limitations on scale completion and intelligence was assessed using maximal performance in a timed situation with correct/incorrect response decisions; the only overlapping method variance could be due to the paper and pencil response format for both measures). Future research may want to expand even further in this area by examining the correlations between self-assessed ability (and intelligence) with actual behavioral performance, such as a work sample, which could be rated by judges.
Although the present study found interesting and meaningful relationships between self-assessed abilities and measured intelligence, the sample size was quite small and was predominately female. Future research is needed with larger samples and with greater male representation. In addition to these issues, future research may want to expand on the self-assessment areas. For example, Visser et al. (Reference Visser, Ashton and Vernon2008) examined the relationships between self-report personality and Gardner's eight multiple intelligence dimensions and reported interesting relationships such as positive correlations between extraversion and interpersonal and bodily-kinesthetic abilities, conscientiousness and spatial, logical-mathematical, interpersonal, and intrapersonal abilities, openness to experience and self-estimates of linguistic, spatial, and interpersonal abilities, and negative correlations between emotionality and self-estimates of logical-mathematical and bodily-kinesthetic abilities (Visser et al., Reference Visser, Ashton and Vernon2008). In general, the present study does demonstrate that for some dimensions of intelligence, there are correlated self-reported talents.


