The first Hungarian summary of twin statistics, published in the Hungarian Statistical Review in 1928, began with the observation that ‘The multiple birth is an interesting natural phenomenon and has a great importance in respect of the society, medicine and statistics alike’ (Saile, Reference Saile1928, p. 33). The study investigated demographic and sociological factors regarding the Hungarian twin births’ data, which showed a high twinning rate during the 1915–1919 period. Its importance is that data about nationality and religion were also available, which are no longer specified.
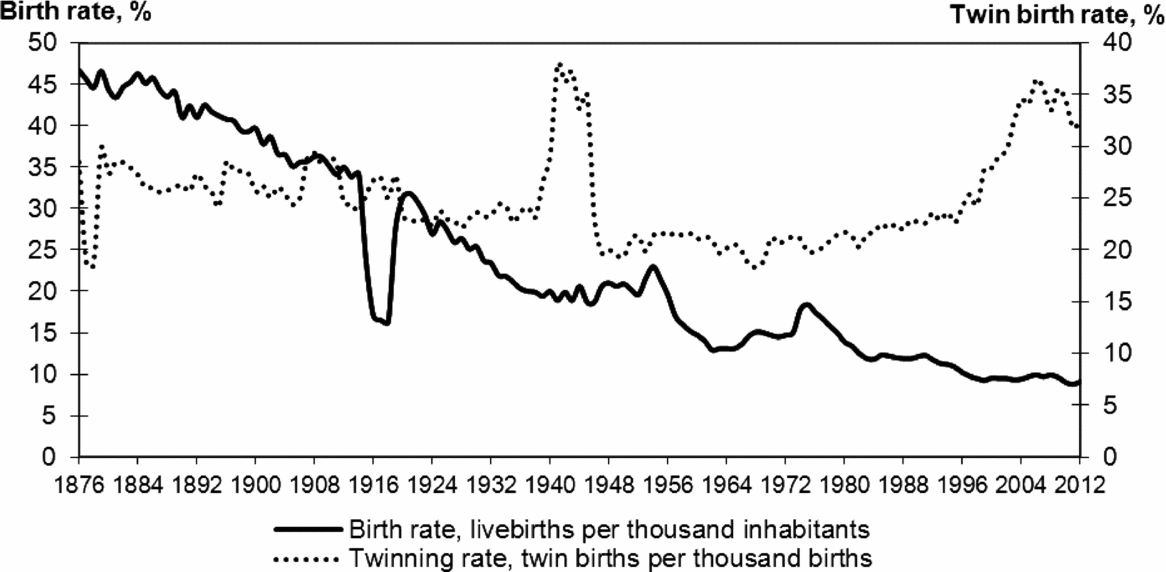
In 2012, out of 88,819 deliveries there were 1,455 twin and multiple (TAM) deliveries, namely 1,424 twin and 31 triple deliveries. In that year, there were no quadruplets or other multiple deliveries. The total number of neonates was 90,269, and among them 2,848 had a twin brother or sister. The TAM birth rate, which means the number of TAM neonates per thousand neonates, was 32.6% and the twinning rate was 32.2% in 2012 (Figure 1).

FIGURE 1 Birth rate and twinning rate per 1,000 deliveries. Note: Data on twin and multiple live births before 1970 are estimated from twin and multiple deliveries’ data. Data on twin and multiple live births in 1890, 1941–45, 1949–50 and 1953 are estimated from the total number of live births. Data sourced from the Hungarian Central Statistical Office (HCSO) and HCSO Demographic Yearbooks.
Prenatal vitamins, assisted reproductive treatments (ART), medication treatments, and mothers’ older age at childbearing have all had a significant effect on the increased twinning rate since the late 1980s and early 1990s.
Frequency of Twin Births in Hungary
We can substitute n = 62.4 to the Hellin formula (Hellin, Reference Hellin1895), according to the 2012 Hungarian data. However, since 1989, n has been lower than the original average of the formula, and a spectacular rise can be seen for twin data since 1998. The explanation is that on the one hand, the Act CLIV of 1997 on Health, which supported women planning to take part in ART, was adopted by the Hungarian Parliament; and on the other hand, the fact that the average age of mothers at childbirth is increasing year by year.
With ART, the chance of having twins and multiples, compared to natural conception, is higher because during the treatment multiple embryos are inseminated into the uterus. In the past two decades, ART has had a notable effect on the high twinning rate in Hungary. While in the 1990s usually 2–3% of natural conceptions resulted in twin children, this rate was 30% in the case of ART, according to (non-official) medical statistics (De Mouzon et al., Reference De Mouzon, Goossens, Bhattacharya, Castilla, Ferraretti and Korsak2010). However, in recent years, due to advances in medical science and the reduced number of embryos implanted during insemination, as well as the negative impact of economic recession (which means that fewer families can participate in expensive ART), the number of twin births in Hungary has decreased.
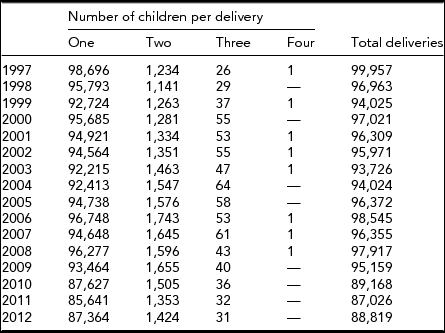
Based on the number of twins estimated by the Hellin principle (n = 89) and the actual number of twins and multiples, the following can be said: there is a significant difference between the expected (conceived naturally) number of twins and the actual number of twins (Table 1); and focusing on the past 15 years’ data for the rare number of triplets, the variance is almost four times. Among the reasons are ART and the increasing age of mothers at childbearing, which also has a supporting effect on the high twinning rate.
TABLE 1 Number of Single and Twin Deliveries in Hungary, 1997–2012

Data sourced from the Hungarian Central Statistical Office (HCSO) and HCSO Demographic Yearbooks.
Since 1970, 97–98% of deliveries have been single deliveries, and the rest have been TAM deliveries in Hungary. Regarding twin pregnancies, the distribution of twins and triplets shows the same rate as the distribution of single deliveries and total twin deliveries (Hellin's law), but the rate of triplets rose significantly between 1998 and 2007.
Main Characteristics of Twin Births
From official natal statistics, we have information on twin deliveries, the number of twin births, the age of both parents, the number of previously born children, the sex of the neonatal baby, the length of gestation, the weight and length of the baby the number of previous pregnancies, and the educational attainment of the mother.
Mother's Age at Childbearing
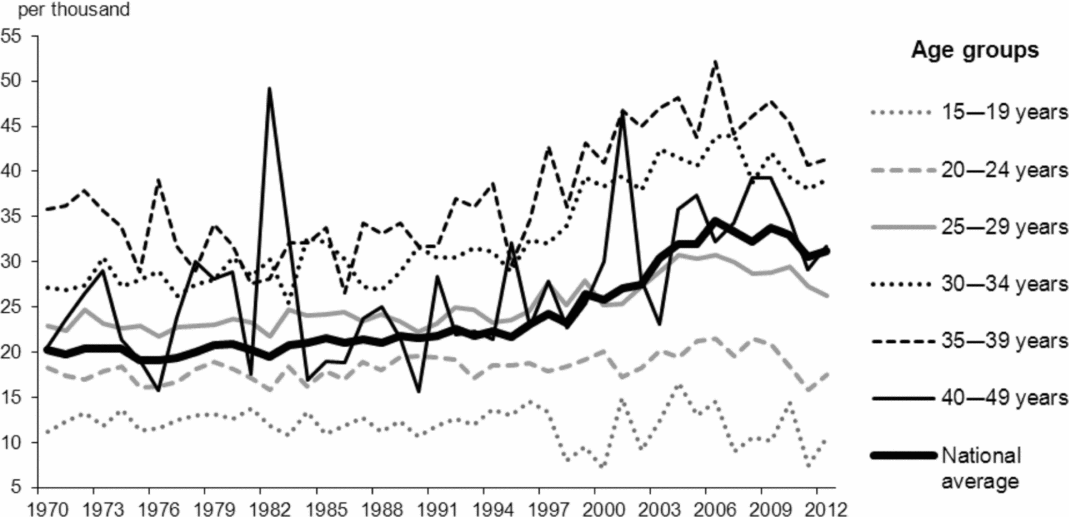
As the average childbearing age of mothers has increased, so too has the chance of twin births. Mothers older than 30 years are more likely to have twin children. Between 1970 and 2012, among mothers older than 30 years, twin birth rate was above average. The highest rate was among 35- to 39-year-olds (Figure 2), while for those aged over 40 years, the natural twinning rates decreased markedly (Fellman & Eriksson, Reference Fellman and Eriksson1990; Reference Fellman and Eriksson2002). Those mothers who had twins were 1.7–2 years older than the average age of all mothers at childbearing (Pári, Reference Pári2011). Unfortunately, we don't have official data for whether the children were born by ART or from natural conception, nor do we have data on the zygosity.

FIGURE 2 Twinning rates among 15- to 49-year-old mothers by age groups, 1970–2012. Note: Data sourced from the Hungarian Central Statistical Office (HCSO) and HCSO Demographic Yearbooks.
Sex Ratio Among Neonatal Children
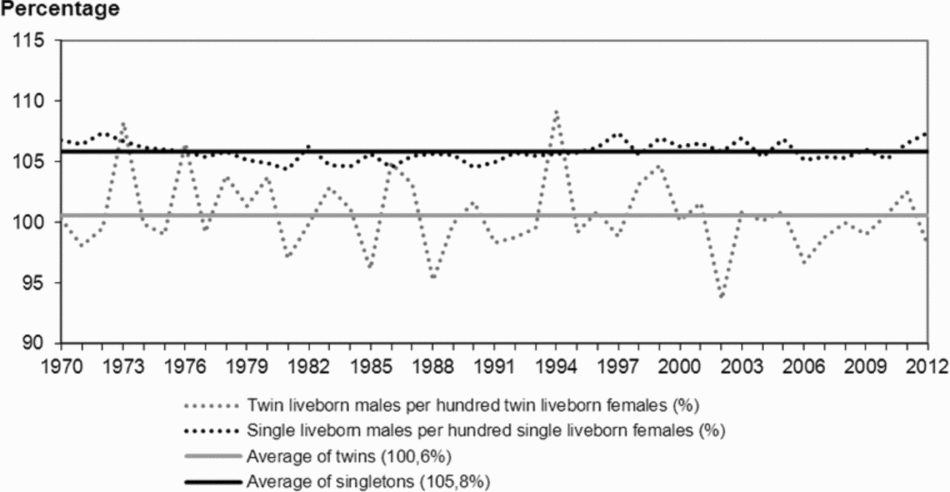
There are more boys (males) born than girls (females) in most of the world's countries; the average rate of male births is around 51–52% (UNdata). Hungary is typical in this regard. In 2012, 51.7% of neonatal babies were boys, a rate slightly higher than the average between 1970 and 2012 (51.4%). There was greater parity among neonatal twins (50.1%) in the mentioned period, and in the last year even fewer twin boys were born than twin girls (49.5%), as seen in Figure 3, and excluding triplets and quadruplets.

FIGURE 3 Liveborn males per 100 liveborn females (singletons and twins), 1970–2012. Note: Data sourced from the Hungarian Central Statistical Office (HCSO) and HCSO Demographic Yearbooks.
The worldwide average sex ratio is 107 males per 100 females. The Hungarian ratio was almost the same (107.1) as the international average ratio, although among twins — including triplets and quadruplets — there is an opposite tendency: 98.2 twin males per 100 twin females in 2012. Separating twins and triplets, the low sex ratio among triplets is even more marked (twins 99.2; triplets 72.2). Based on the average of the past four decades’ live-birth statistics, the number of newborn boys was higher than that of newborn girls (105.8 males per 100 females) among singletons, while the twins’ sex ratio was more or less even (100.6 twin males per 100 twin females). Among triplets, the four decades’ average was 98.7. The conclusion is that there was a greater proportion of girls among twin neonates compared with singletons, and even more among triplet neonates (Fellman & Eriksson, Reference Fellman and Eriksson2010).
Length and Weight of Live Born Children at Birth
In Hungary in 2012, 90.9% of mothers gave birth to their child(ren) between the 37th and 41st week of gestation. Due to improving healthcare and better perinatal conditions, among mothers with singletons the ratio is even higher (92.5%), but mothers with twin children have an extremely low rate (44%). One in every 19 neonates (5.3%) was a premature baby who was born before the 36th week of gestation — 4.1% of the singletons and (!) almost 40% of the twins and multiples.
If we take a look at the statistics from the previous 40 years, we find that 89% of mothers gave birth to their child between the 37th and 41st week of gestation, while only half of twin pregnancies lasted until the 37th week of gestation. Based on the statistics between 1973 and 2012, 5.6% of neonates were premature. Singletons are in a better situation because while 4.9% of them were born earlier than expected, among twins 34.8% were premature. Over the past 40 years, generally one in every six or seven premature babies was a twin or multiple. Since 2003, every fourth premature neonatal has a twin sibling.
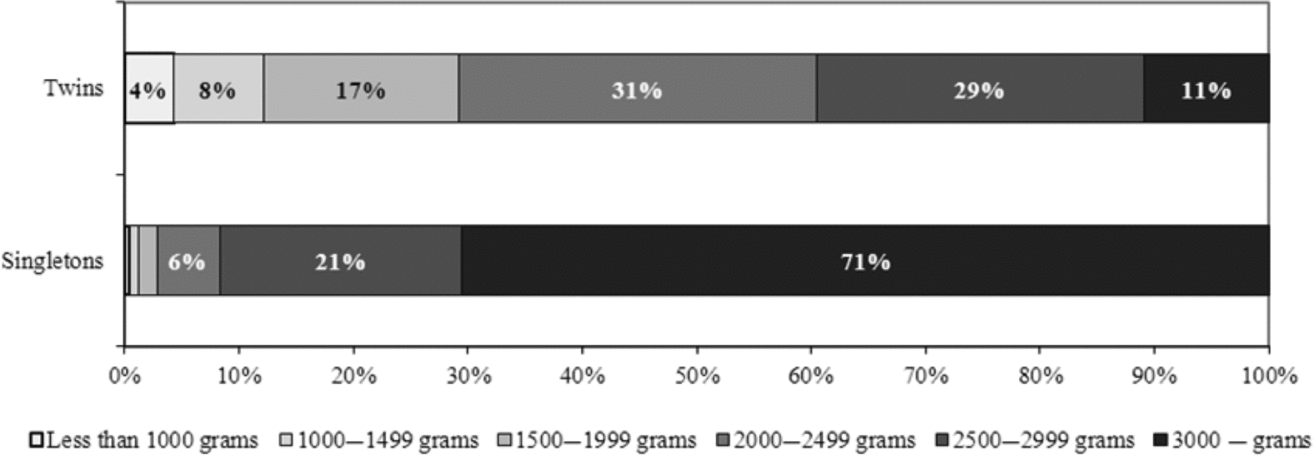
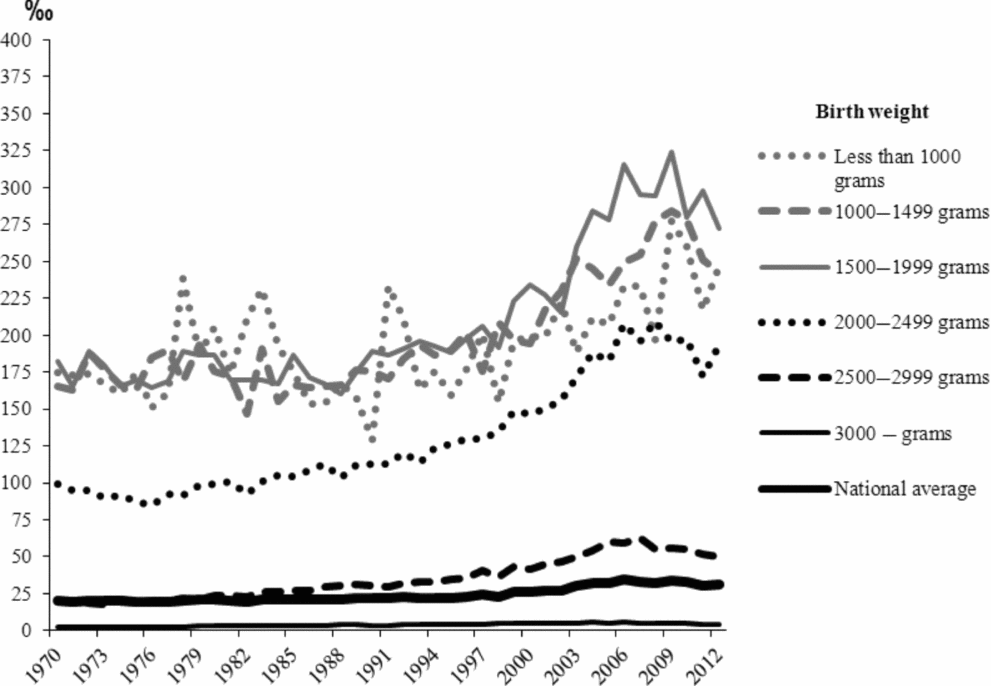
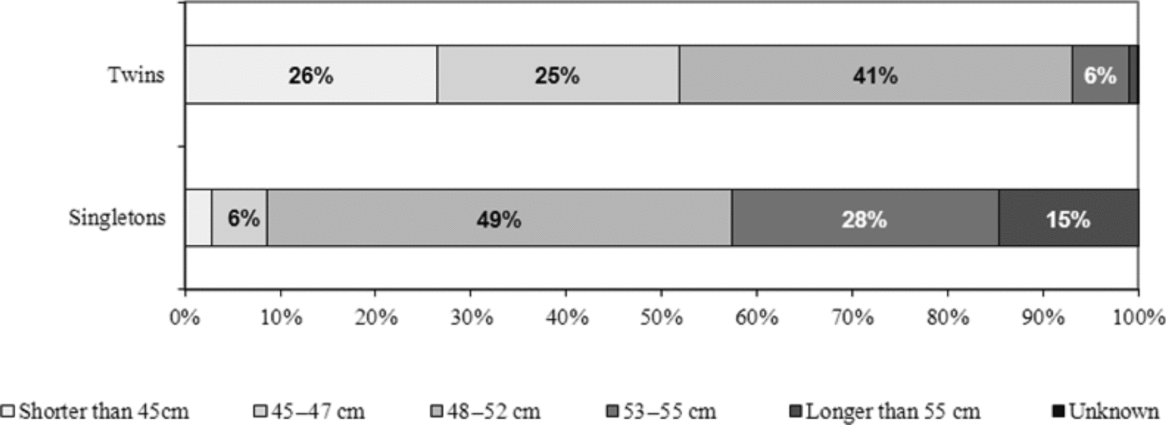
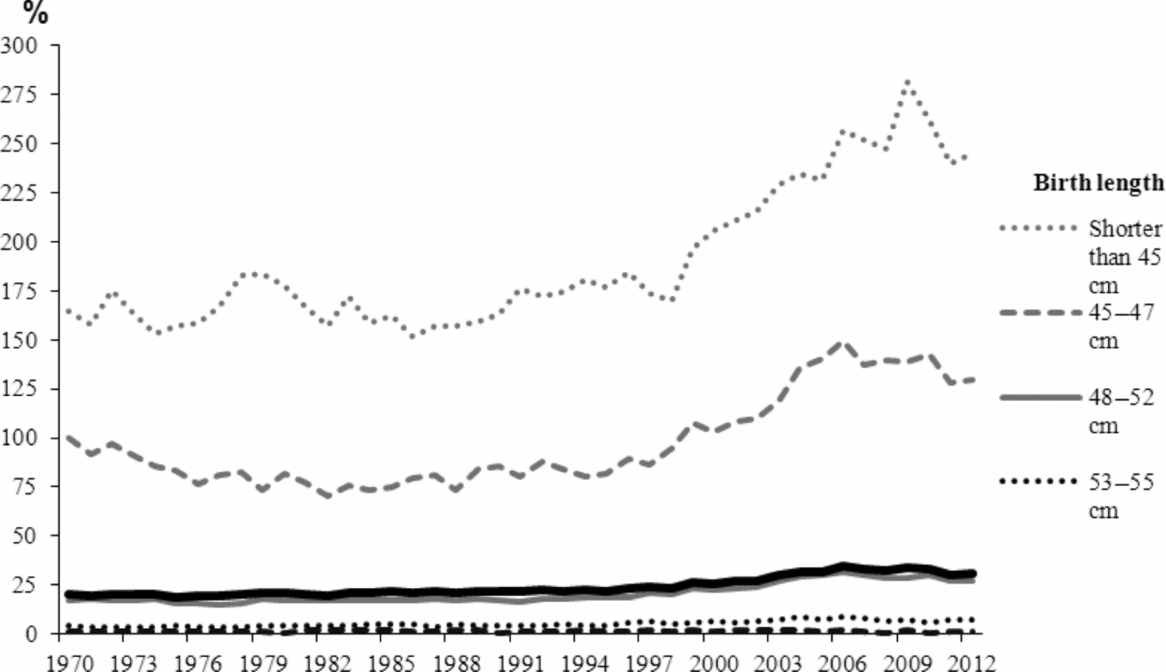
As twin neonates are generally born earlier (premature), their birth weight and length are often remarkably lower than those of singletons. The difference in the twinning rate can be seen clearly in a breakdown by birth weight and length (Figures 4–7). However, this biological disadvantage at birth does not necessarily remain so further on.

FIGURE 4 Average birth weight based on 1970–2012 data. Note: Data sourced from the Hungarian Central Statistical Office (HCSO) and HCSO Demographic Yearbooks.

FIGURE 5 Twinning rates by birth weight categories, 1970–2012. Note: Data sourced from the Hungarian Central Statistical Office (HCSO) and HCSO Demographic Yearbooks.

FIGURE 6 Average birth length based on 1970–2012 data. Note: Data sourced from the Hungarian Central Statistical Office (HCSO) and HCSO Demographic Yearbooks.

FIGURE 7 Twinning rates by birth length categories, 1970–2012. Note: Data sourced from the Hungarian Central Statistical Office (HCSO) and HCSO Demographic Yearbooks.
Regarding birth weight, twin neonates are smaller than singletons: almost one-third have birth weight between 2 and 2.5 kg (Figures 4 and 5). The increased twinning rate over the past decade is highest among neonates with a birth weight below 2.5 kg. It is interesting that the twinning rate has been continuously and slowly increasing in the birth weight category of 2,000–2,999 gram since the late 1970s and early 1980s. The average birth weight of twins is 1 kg less than singletons’ birth weight; of these, 38.5% belong to the 3- to 3.5-kg group.
One in every four twins and one in every 36 singletons have a birth length smaller than 45 cm (Figures 6 and 7). The distribution of the lengths of neonates shows a normal distribution. The difference is even higher among neonates longer than 55 cm: less than 1% of twins and 14.6% of singletons were born with this birth length. The shorter the period of gestation (i.e., the earlier children are born), the greater the difference between singletons’ and twins’ birth length. The differences are even stronger among triplets, and especially quadruplets.
Number of Previous Pregnancies
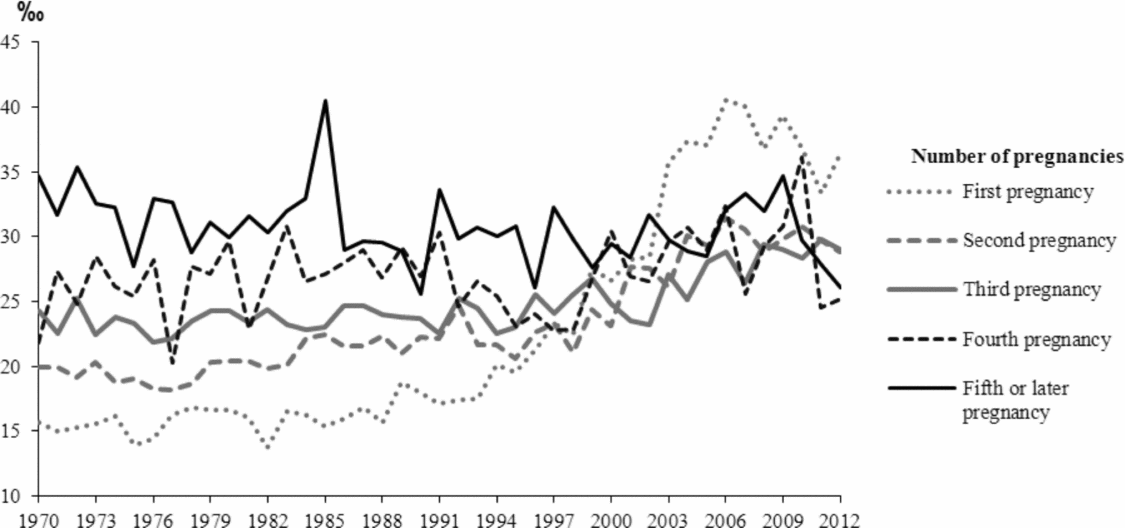
Until the end of the 1980s, the number of a mother's previous pregnancies was associated with a higher chance of twin delivery (Figure 8). Since the early 1990s, however, there have been more twin pregnancies among Hungarian mothers’ first and second deliveries. Over the course of a decade, this trend continued to such an extent that the twin rate from first pregnancies became even higher than the twin rate from third or fourth or fifth pregnancy. The effect of the number of previous pregnancies did not disappear, but having twins from the first or second delivery became dominant.

FIGURE 8 Twinning rates by number of previous pregnancies, 1970–2012. Note: Data sourced from the Hungarian Central Statistical Office (HCSO) and HCSO Demographic Yearbooks.
Since ART has gained ground, the number of twin deliveries has grown sharply, and the number of triplet deliveries even more so. The effect of ART was strengthened by another factor already noted — the older age of mothers’ first childbearing. This also enhanced the chance of twin pregnancy. The rising number of a mother's natural deliveries improves the chance of twin deliveries. However, Act CLIV of 1997 on Health changed the previous trends by permitting more than one embryo to be implanted during ART to improve the chances of successful delivery.
Educational Attainment of the Mother: Number of Grades Completed
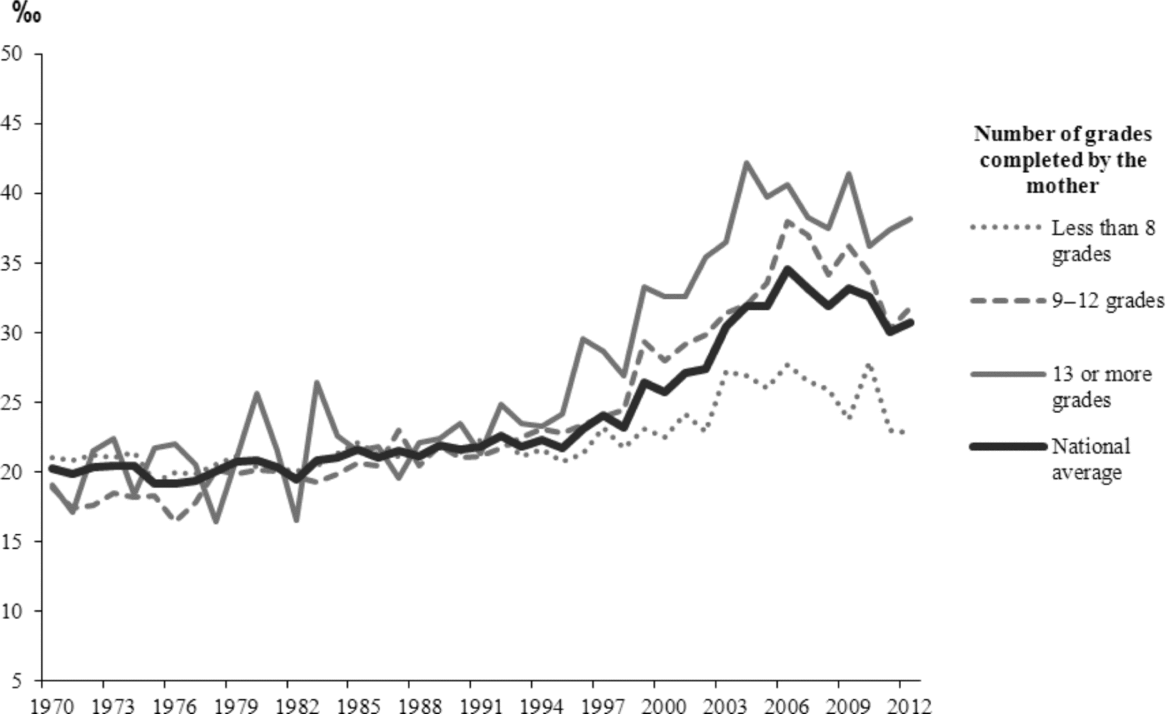
As a result of the expansion of higher education that began in the early 1990s in Hungary, more women study at college or university. The chance of having twins is not strongly correlated with educational attainment, but rather with the mother's age and genetically inherited factors. Yet the time spent in higher education usually results in a rising age for childbearing, which has a determining role in the number of twin deliveries. Among women who at least started college (having completed 13 grades or more), the twinning rate has been higher than the average since the early 1990s (Figure 9).

FIGURE 9 Twinning rates by number of grades completed by the mother, 1970–2012. Note: Data sourced from the Hungarian Central Statistical Office (HCSO) and HCSO Demographic Yearbooks.
By 2012, the number of mothers having singletons in the mentioned group almost doubled (increased 1.8-fold) compared to the 1990s data, while the number of mothers with twins rose three-fold. The twinning rate started to grow among mothers with at least a college degree after Act CLIV of 1997 on Health was enacted. There was a slight increase among mothers who had completed Grade 8, but this growth stopped by the end of the 2000s. In this group, the chance of having twins was much lower than in the other groups, because on average they gave birth to their children at a younger age.
Twin Deliveries and Infant Mortality
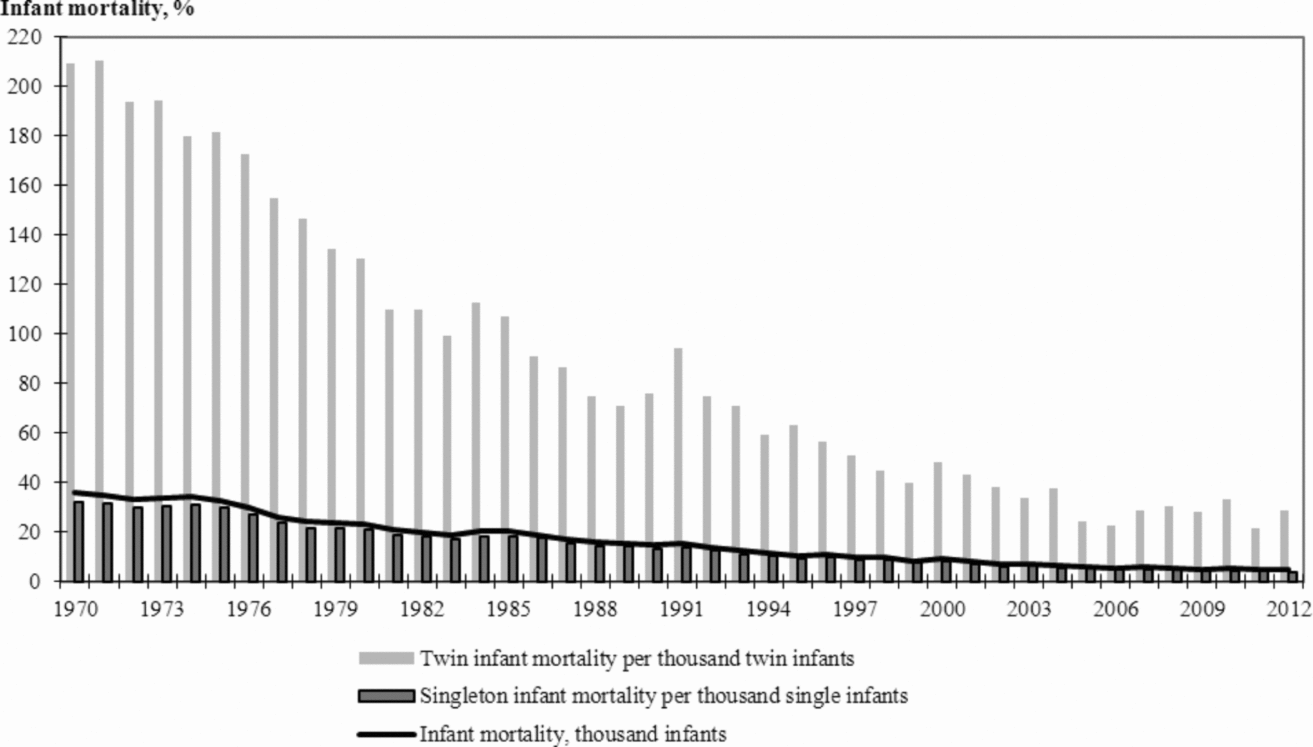
Hungary's infant mortality rate has improved considerably over the past few decades (Figure 10). The average rate was 4.9% in 2012: singletons had a 4.0% rate and twins had a 28.9% rate. Infant mortality fell by a factor of eight among singletons and by a factor of seven among twins by 2012 compared to 1970, but the rate among twins remains more than seven times higher than that of singletons.

FIGURE 10 Infant mortality, 1970–2012. Note: In 1970–1972, infant mortality data among single and twin infants are data estimated from the total. Data sourced from the Hungarian Central Statistical Office (HCSO) and HCSO Demographic Yearbooks.
Over the past four decades, infant mortality was on average six times higher among twins than among singletons. Thus, although infant mortality rates have improved in all categories, twin infant mortality is still very high compared to singleton mortality.
Mother's Place of Residence: Geographical Trends
The twinning rate started to increase in the mid-1990s as a result of changes in childbearing habits. There was no significant difference in twinning rates between settlement types (e.g., smaller towns and villages, towns of county rank, capital city) before the mentioned period. The twinning rate varied between 18% and 25%. After the mid-1990s, however, the twinning rate was above the national average in the capital city and in towns with county rank, while in smaller towns and villages, although the twinning rate also increased, it was below the average (Pári, Reference Pári2011).
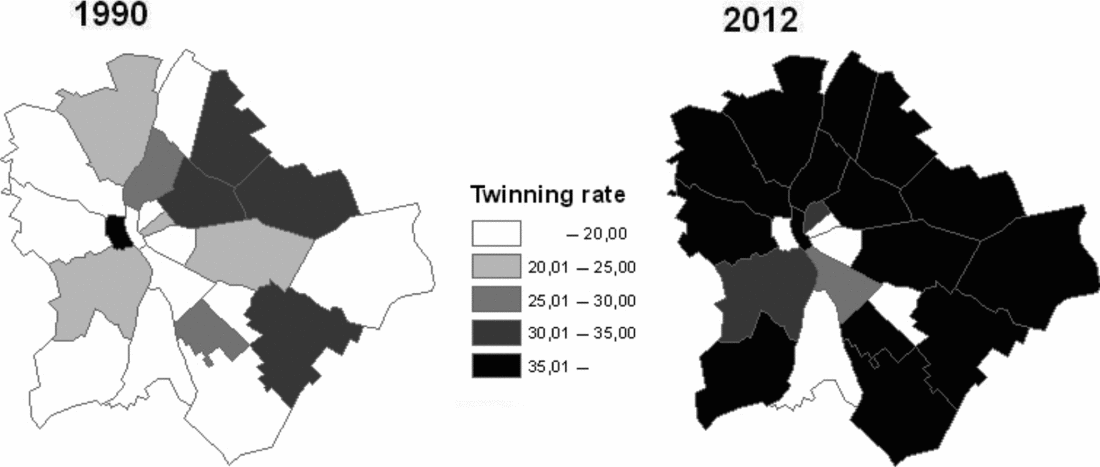
The twinning rate in Budapest (Figure 11) is higher than the national average, but there are large differences among the capital's districts. In 1990, the northeast districts of the city and the 1st and the 18th districts had above-average twinning rates. Except for the central districts, where the figures were below the national average, most districts in Budapest had above-average rates in 2012. The twinning rate of Budapest was 22.2% in 1990 and 36.8% in 2012.

FIGURE 11 Twinning rate in Budapest (capital) districts in 1990 and 2012. Note: Data sourced from the Hungarian Central Statistical Office (HCSO) and HCSO Demographic Yearbooks.
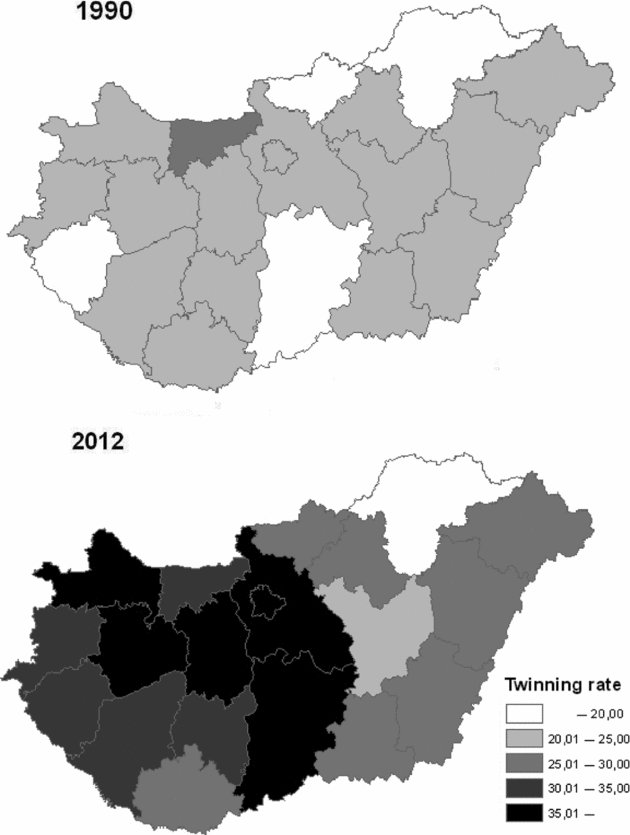
In Hungary, some 100 fewer twins were born in 1990 than in 2012 when 2,941 twins and multiple neonates were born. The twinning rate was 22.2% in 1990 and 32% in 2012. Pest county (62%), Budapest (41%), and Bács-Kiskun county (30%) saw the most significant growth, while the number of twin births decreased by half in Borsod-Abaúj-Zemplén county and to 63% of the 1990 twinning rates in Jász-Nagykun-Szolnok county (Figure 12).

FIGURE 12 Twinning rates by counties in 1990 and 2012. Note: Data sourced from the Hungarian Central Statistical Office (HCSO) and HCSO Demographic Yearbooks.
There is a geographic correlation between regional prosperity and high twinning rates in Hungary over the past decade. Cities and counties with lower unemployment rates and with GDP and personal income higher than the national average — generally the capital and other principal cities, as well as the counties in the northwestern part of the country (HCSO, 2013) — have higher twinning rates. Regional differences in prosperity have increased dramatically since 1990, following the regime change (Halász, Reference Halász2011), and they had an effect on such social phenomena as childbearing patterns (Spéder & Kamarás, Reference Spéder and Kamarás2008). In the few decades before 1990 (the Kádár era), regional (and other) differences in financial resources available to families were not pronounced. There were, correspondingly, no significant regional disparities among twinning rates either. But for some years following the regime change, the twinning rate became higher in those areas where personal incomes were higher and the unemployment rates were lower. Naturally, mothers’ age at childbearing — as a significant factor of twins birth rates — changed, too.
International Outlook
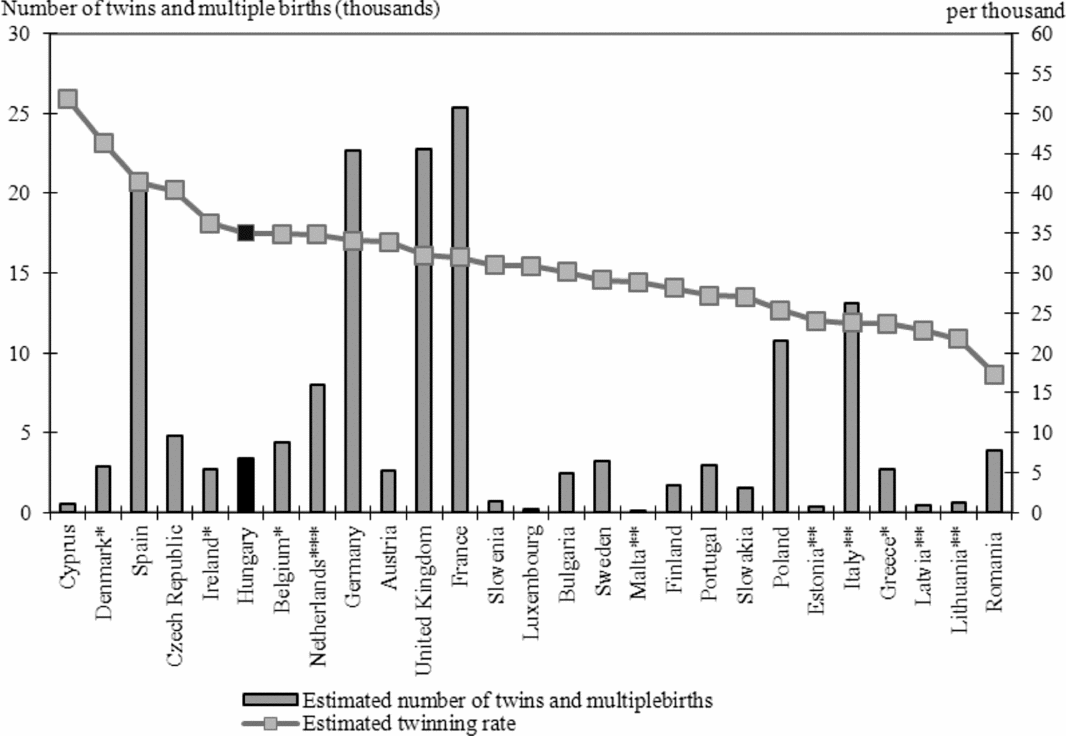
According to Eurostat data, approximately 165,000–167,000 babies were born as twins out of the approximately 5.4 million babies born in 2009 in the European Union (EU), an estimated average twinning rate of 32%. In the same year, 145,000 twins were born out of the more than 4.1 million babies born in the United States, which equaled the Hungarian rate (35%). In the EU member states, more than the half of live-born twins were French, English, German, and Spanish. In the past few years, Cyprus, Denmark, Spain, and the Czech Republic had the highest twinning rates at more than 40% (Figure 13).

FIGURE 13 Number of twins and estimated twinning rate in EU member states, 2009. *Based on 2008 data. **Estimated 2004 data (Euro-Peristat Project, with SCPE, Eurocat, Euroneostat, 2008). ***Estimated from number of twin and multiple deliveries. Note: Data sourced from the Hungarian Central Statistical Office (HCSO) and HCSO Demographic Yearbooks.
Conclusion
According to Hungary's official statistical data, the country's twinning rate had two important peaks since the beginning of data collection in the 1870s. The first was during World War II, and we are just coming off of the latest peak, which started after the mid-1990s, parallel with the Act CLIV of 1997 on Health. The twinning rate is geographically correlated with counties and cities with high incomes and low unemployment rates. Mothers with a higher educational attainment than the national average continued, as they had in the past, to have disproportionately more twins than mothers with low levels of education. However, the main factors affecting the rate of twin births, including the age of mothers at childbearing and the previous number of pregnancies, has changed.
Infant mortality rate has improved considerably since the 1970s, but infant mortality among TAMs is still more than seven times higher than that of singletons. A twin neonate's average birth weight is 1 kg less than that of an average singleton neonate, according to the last 40 years’ official statistics in Hungary, and her/his average birth length is 7–8 cm smaller than that of the average singleton neonate.
Acknowledgments
I would like to thank Brent Ranalli for perusing the study as a native speaker, and special thanks to Johan Fellman for providing professional advice as a twin statistician. This article would not have been possible without the support of the following persons from HCSO, namely Dr Gabriella Vukovich, President of the HCSO; Dr Zsolt Németh Deputy President for Social Statistics; István Szabó, Head of Dissemination Department; and Györgyi Bódiné Vajda, Head of Data Compilation section.


