The balance between dietary carbohydrate and protein has been suggested to influence gut fermentation. Negative effects on gut health might be expected if less carbohydrate and more protein reach the large intestine, due to shifts in short chain fatty acid (SCFA)(Reference Russell, Gratz, Duncan and Holtrop1) patterns and the formation of potentially carcinogenic N-nitroso compounds (NOC)(Reference Holtrop, Johnstone, Fyfe and Gratz2). Nonetheless, high-protein low-carbohydrate diets are popular weight loss regimes. The aim of this study was therefore to assess the impact of diets with varying carbohydrate, protein and energy contents on colonic fermentation products (SCFA) and endogenous formation of NOC.
We conducted a dietary intervention in 18 obese men comparing a body weight maintenance diet (448 ± 50 g/d carbohydrate, 115 ± 13 g/d protein, 13·1 ± 1·4 MJ/d energy) and three weight loss diet (9·0 ± 1·1 MJ/d) containing different levels of carbohydrate (219–308 g/d) and protein (80–156 g/d) to assess the effect of various carbohydrate and protein components. Dietary intakes were estimated from food diaries and faecal fermentation products and NOC were determined as described previously(Reference Holtrop, Johnstone, Fyfe and Gratz2).
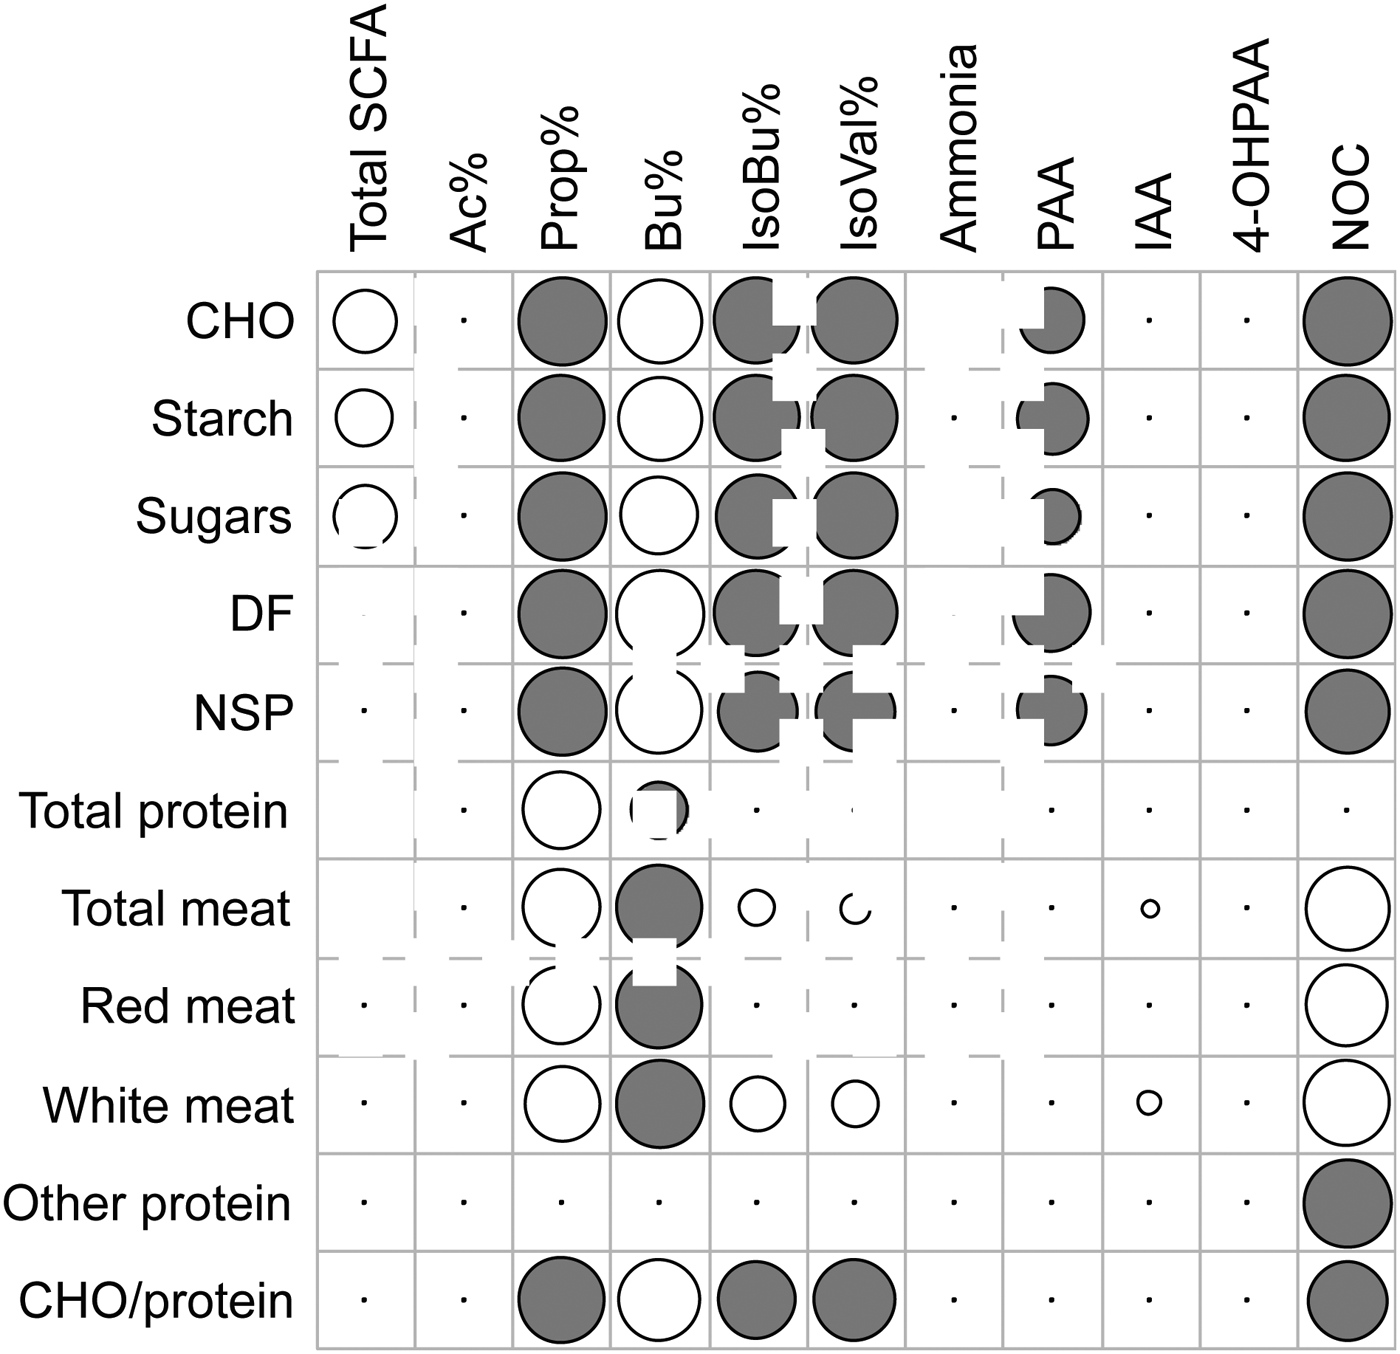
Abbreviations: CHO carbohydrate, DF dietary fibre, NSP non-starch polysaccharide, Ac Acetate, Prop Propionate, Bu Butyrate, IsoBu Iso-butyrate, IsoVal Iso-valerate, PAA Phenylacetic Acid, IAA Indole-3-Acetic Acid, 4-OHPAA 4-Hydroxy-PAA.
Results demonstrate that shifts in the dietary carbohydrate/protein ratio resulted in alterations in faecal SCFA patterns. Butyrate production was positively associated with dietary carbohydrates (P = 0·004) whereas the amino acid breakdown products Iso-butyrate, Iso-valerate and PAA were negatively associated with dietary carbohydrate (P = 0·002, 0·001 and 0·021, respectively), but unrelated to dietary protein (Figure 1). Furthermore, we confirmed red meat as the strongest contributor to endogenous NOC formation (P = 0·005), whereas carbohydrates and especially non-starch polysaccharides were negatively associated with NOC (P = 0·004).

Fig. 1. Significant correlations between dietary intakes and microbial metabolites detected in faeces of 18 study participants. Grey circles indicate negative correlations, white circles indicate positive correlations and circle size relates to the strength of the correlation.
Our results clearly show that high dietary protein and a lack of dietary carbohydrate both contribute to shifts in colonic fermentation in humans. We have also identified the contributions of various dietary components to endogenous NOC formation. These findings might further our understanding of the relationship between diet and cancer.
This work was supported by the Scottish Government (Rural & Environment Science & Analytical Services).


