China has been undergoing rapid economic and epidemiological transitions in recent decades, and at the same time, people's dietary patterns have changed significantly. Although the majority of Chinese residents still keep a plant-food-based dietary pattern, the proportion of energy contributed by animal foods has been increasing( Reference Zhang, Zhang and Wang 1 ). According to data from the China Health and Nutrition Survey in 2002, animal food comprised an important part of the Chinese diet, contributing about 12·6 % to daily energy intake, 25·1 % to daily protein intake and 39·2 % to daily fat intake( Reference He, Zhai and Wang 2 ). In the animal food dietary pattern, the proportion of meat and dairy was 37·9 and 16·7 % respectively, and of other animal food such as fish or shellfish, eggs, poultry was 45·4 % in total( Reference He, Zhai and Wang 2 ).
Meat contains about 20 % protein and is rich in micro-nutrients such as zinc, iron, selenium, vitamins B6 and vitamin B12, which make it as an important food item for human nutrition, especially in poor rural areas( Reference Yang, Wang and Pan 3 ). Nevertheless, excessive meat consumption leads to high intakes of saturated fat, dietary cholesterol and other substances associated with negative impacts on health( Reference Carvalho, César and Fisberg 4 ). Therefore, meat consumption had been identified as a dietary risk factor for CHD( Reference Denke 5 , Reference Hu, Stampfer and Manson 6 ), obesity( Reference Vergnaud, Norat and Romaguera 7 ), diabetes( Reference Steinbrecher, Erber and Grandinetti 8 ), colorectal cancer( 9 ) and stroke( Reference Micha, Wallace and Mozaffarian 10 ).
Dairy products are rich in nutrients such as protein, minerals (calcium, phosphorus, magnesium, calcium, sodium, zinc, iron) and vitamins (A, B1, B2, B12, C, D)( Reference Camfield, Owen and Scholey 11 ). Numerous epidemiological studies indicated that consumption of dairy products decreased levels of systolic blood pressure( Reference Wang, Manson and Buring 12 – Reference Engberink, Geleijnse and De Jong 14 ), risk of type 2 diabetes and insulin resistance( Reference Unal, Akalin and Akbulut 15 – Reference Elwood, Pickering and Givens 17 ), colorectal cancer( Reference Pufulete 18 ), as well as stroke and heart disease( Reference Elwood, Givens and Beswick 16 , Reference Elwood, Pickering and Givens 17 ).
The aim of the present paper was to review the consumption of meat and dairy products and the impact on people's health in China. Relevant data were derived from the National Bureau of Statistics of China, National Nutrition Survey and relevant publications up to July 2015. Keywords used to identify relevant articles were ‘meat’, ‘dairy products’, ‘consumption’, ‘health’ and ‘China’.
Dietary measurements
The food consumption data from the National Bureau of Statistics of China were collected through family recording methods in urban and rural household sample surveys. The dietary intakes of meat and dairy products were assessed by using three consecutive days of 24 h dietary recall in the Chinese National Nutrition Surveys. The average intakes of meat and dairy products were described as daily intake per reference man (estimated average requirement is 10041·6 kJ (2400 kcal)).
Production of meat and dairy products
Meat purchase has been increasing in China, particularly for pork and poultry. Annual global meat production was expected to increase from 218 million tonnes in 1997–1999 to 376 million tonnes by 2030( 19 ). In China, the output of meat was 76·5 million tonnes in 2009; pork, beef and mutton were 48·91 million tonnes, 6·36 million tonnes and 3·89 million tonnes, respectively. Several decades ago, pork contributed 59 % of total meat production; in contrast, beef only accounted for 5 % of meat in China( Reference Gill 20 ). In recent years, the proportion of pork in total meat production increased to 63·9 %, but there had been little change in the proportion of beef (8·3 %)( 21 ).
The production of dairy products was also hugely changing; it varied from 7·36 million tonnes in 1996 to 37·33 million tonnes in 2009, and the proportion of milk was 94·3 % in total dairy products output( Reference Walker, Rhubart-Berg and McKenzie 22 ).
Consumption of meat and dairy products
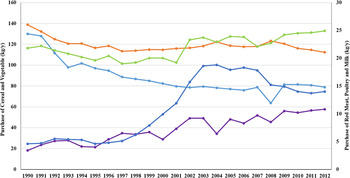
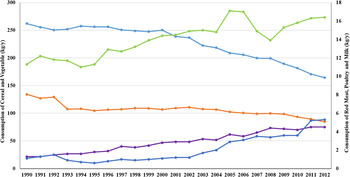
Based on data from the National Bureau of Statistics of China, from 1990 to 2012, red meat was increasing with the annual growth rate of 0·65 % in urban (Fig. 1) and 2·05 % in rural regions (Fig. 2), while poultry was increasing with the annual growth rate of 9·90 % in urban and 11·19 % in rural areas (Figs 1 and 2). Traditionally, Chinese diets were high in plant food, but by 2012 the proportion of animal food in Chinese population's food pattern was increased, especially meat. The per capita annual consumption of pork, beef and mutton, poultry was 21·2, 3·7 and 10·8 kg/year respectively in urban households (Fig. 1), and 14·4, 1·9 and 4·5 kg/year, respectively, in rural households in 2012 (Fig. 2). Compared with 1990, there was a huge increase (Figs 1 and 2).

Fig. 1. (Colour online) Trends of food purchase in urban population. Cereal (![]() ), vegetables (
), vegetables (![]() ), red meat (
), red meat (![]() ), poultry (
), poultry (![]() ), milk (
), milk (![]() ). Data source: National Bureau of Statistics of China.
). Data source: National Bureau of Statistics of China.

Fig. 2. (Colour online) Trends of food consumption in rural population. Cereal (![]() ), vegetables (
), vegetables (![]() ), red meat (
), red meat (![]() ), poultry (
), poultry (![]() ), milk (
), milk (![]() ). Data source: National Bureau of Statistics of China.
). Data source: National Bureau of Statistics of China.
Milk consumption of urban residents changed in a different pattern as compared with rural residents (Figs 1 and 2). The consumption of milk in urban populations increased from 4·6 kg/year in 1990 to 18·8 kg/year before 2004, and then decreased to 14 kg/year in 2012. Although there was also an increasing trend in rural populations, from 1·1 kg/year in 1990 to 5·3 kg/year in 2012, the level of milk consumption in 2012 was only equal to the consumption level of urban populations in 1992 (Fig. 3). The annual growth rate of dairy consumption was 2·96 % in urban populations, and the annual growth rate of dairy consumption was 14·33 % in rural populations over the past 12 years( Reference Wang, Zhai and Wang 23 ). The gap of per capita consumption of milk between urban and rural households was 3·5 kg/year in 1990 and reached a maximum 16·9 kg/year in 2003, then decreased to 8·7 kg/year in 2012. Although the trends of consumption increased in rural households, it was still at a much lower level. The per capita consumption of milk had a sharp rise before 2004, and then began to drop (Fig. 3).

Fig. 3. (Colour online) Per capita milk consumption of urban and rural households. Urban (![]() ), rural (
), rural (![]() ). Data source: National Bureau of Statistics of China.
). Data source: National Bureau of Statistics of China.
Dietary intake of meat
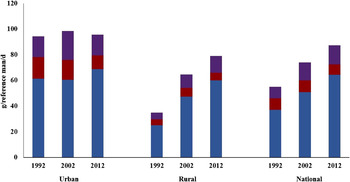
Data from the Chinese National Nutrition Survey showed that the total average meat intake increased from 58·9 g/d in 1992 to 89·7 g/d in 2012 (Fig. 3). It was higher than the recommended level of Chinese Dietary Guidelines (daily meat recommendation 75 g/d). The total pork intake increased by 73 % from 37·1 g/d in 1992 to 64·3 g/d in 2012 (Fig. 3). Meat intake of rural residents changed more remarkably than urban residents. Pork intake of rural residents increased from 25·0 g/d in 1992 to 59·9 g/d in 2012 (in urban residents from 61·3 g/d in 1992 to 68·6 g/d in 2012; Fig. 3). The poultry intake increased from 5·2 g/d in 1992 to 13·1 g/d in 2012 in rural areas, while it remained stable in urban areas (16 g/d; Fig. 3). The demand for meat in China kept growing as intake of meat increased with available income, which was consistent with other research results( Reference Walker, Rhubart-Berg and McKenzie 22 , Reference Speedy 24 ) and the per capita purchases of pork increased from 14·39 to 23·85 kg/year. Meat intake per capita in Inner Mongolia, Sichuan, Guizhou, Yunnan, was considerably higher than that in other regions in China, since they were the major areas for animal product production in history( Reference Pan 25 ).
According to a large cohort study from the China Health and Nutrition Survey between 1991 and 2011, total meat intake was 86·7 g/d in 2011 and the proportions of Chinese residents consuming red meat and poultry increased from 65·7 and 7·5 % in 1991 to 86·1 and 20·9 % in 2011, respectively( Reference Walker, Rhubart-Berg and McKenzie 22 ). The result also indicated that fresh red meat was the main component of total meat, and the proportion of adults consuming fatty fresh red meat was double the proportion of adults consuming lean fresh red meat in 2011 (75·1 v. 30·8 %)( Reference Walker, Rhubart-Berg and McKenzie 22 ). Fatty fresh pork accounted for 54 % of total meat intake, 80 % of fresh red meat intake and 98·7 % of fatty fresh red meat intake in 2011( Reference Walker, Rhubart-Berg and McKenzie 22 ). It was obvious that fatty fresh pork had already become the main component of total meat intake. However, in contrast, the proportion of fatty and lean fresh red meat of mutton and beef reduced by 6·3 and 2·8 %, respectively. Nevertheless, the proportion of seafood and poultry increased by 2·2 and 6·4 %, respectively (Fig. 4)( Reference Walker, Rhubart-Berg and McKenzie 22 ).

Fig. 4. (Colour online) Trends of meat consumption in China. Poultry (![]() ), other meats (
), other meats (![]() ), pork (
), pork (![]() ). Data sources: 1992 China Nutrition Survey, 2002 China Health and Nutrition Survey, 2010–2012 China Health and Nutrition Surveillance.
). Data sources: 1992 China Nutrition Survey, 2002 China Health and Nutrition Survey, 2010–2012 China Health and Nutrition Surveillance.
Dietary intake of dairy products
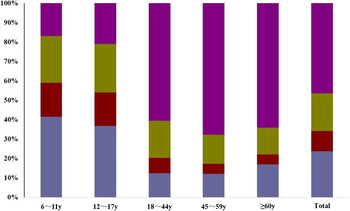
The average intake of milk in big city, small- and medium-sized city, normal rural area and poor rural area in 2012 was 64·3, 24·2, 9·1 and 4·9 g/d, respectively. The frequency of dairy intake among Chinese population decreased with ageing. Compared with other age groups, the population under age 18 years had the highest frequency of milk intake in China. There were only 23·7 % people who consumed dairy every day (Fig. 5).

Fig. 5. (Colour online) Frequency of dairy consumed among Chinese population. <1 time/week (![]() ), 1–3 times/week (
), 1–3 times/week (![]() ), 4–6 times/week (
), 4–6 times/week (![]() ), ⩾1 time/d (
), ⩾1 time/d (![]() ). Data source: 2010–2012 China Health and Nutrition Surveillance.
). Data source: 2010–2012 China Health and Nutrition Surveillance.
According to the data from the 1991 to 2006 Chinese Health and Nutrition Surveys, the trend in percentage of dairy intake increased. The average percentage of Chinese resident's milk intake went up from 2·2 to 7·6 %. Both urban rural adults showed significant increase in percentage, from 9·7 to 23·7 % in urban and 0·1 to 1·8 % in rural adults. The percentages of adults who drank milk once during three survey days, at the top income level and bottom income level, increased from 4·7 to 14·6 % and from 0·1 to 2·4 %, respectively. The average daily intake of milk increased from 3·6 g/d in 1991 to 11·8 g/d in 2006. The daily milk intake among top income level adults and bottom income level adults increased from 8·5 to 23·1 g/d and from 0·2 to 3·3 g/d, respectively( Reference Liu, Zhang and Du 26 ). The results indicated that the intake of dairy products in Chinese residents has been increasing but still remained at a quite low level. Dairy intake in China especially among rural adults required further promotion.
Discussion
In summary, in China, animal food provided an average of 15·2 % of daily energy intake in 1992 and 17·6 % in 2012 in urban areas; in rural areas, it was 6·2 % in 1992 and 12·5 % in 2012. The contribution to protein by animal food varied from 7·97 % in 1992 to 16·15 % in 2012 in rural areas, with little change in urban areas (23·66 %). Consumption of animal food, especially pork, increased significantly especially in rural areas with the gap between urban and rural areas narrowing. The proportion of protein from animal food increased and the total consumption of protein remained in a stable condition. A moderate increase in meat and dairy products consumption will certainly improve the nutritional adequacy of diets and improve health outcomes( 21 ).
The mean calcium intake in Chinese populations was 366 mg/d. There were more than 90 % populations at risk of inadequate calcium intake( 27 ). Dairy was the primary source of calcium. To improve the intake of calcium and prevent osteoporosis or other diseases caused by calcium deficiency, dairy consumption should be recommended to increase in Chinese populations.
Dietary patterns represent a long-term habit of one's dietary intake, and dietary patterns in China were shifting from the traditional pattern with high consumption of plant food and low consumption of animal food, to the Western pattern characterised by animal foods( Reference Zhai, Wang, Du and He 28 ). Previous research among 5267 children in China indicated that the Western dietary pattern with high intake of red meat and other high-energy-dense foods was positively associated with a higher risk of obesity, a higher level of plasma glucose and TAG( Reference Shang, Li and Liu 29 ). Healthy dietary behaviour would promote a healthy lifestyle, so it is necessary for researchers to guide Chinese populations to control their intake of red meat and increase the intake of vegetables, fruit and fish.
Previous reports indicated that a diet high in meat was associated with the growing epidemic of obesity and diet-related chronic diseases( Reference Mente, de Koning and Shannon 30 ). In contrast, vegetables decreased risk for hypertension, obesity, diabetes, CVD and some cancers( Reference Fraser 31 – Reference Key, Appleby and Spencer 35 ). Based on considerable research( Reference Krauss, Eckel and Howard 36 – Reference Reedy and Krebs-Smith 38 ), the dietary recommendations for prevention of chronic diseases advised limiting the consumption of red and processed meat and to eat mostly plant-based food. Meat consumption among the urban residents was much more than the Chinese dietary recommendation; this should call the attention of the public health professionals to take actions on chronic disease prevention via nutrition education in China.
Conclusion
In consideration of the higher consumption of meat, especially fatty fresh pork, formulating relevant strategies and taking action as soon as possible are imperative. The research of Andreyeva et al.( Reference Andreyeva, Long and Brownell 39 ) and Green et al.( Reference Green, Cornelsen and Dangour 40 ) showed that the price of meat can effectively influence consumption. Therefore, the efficient measure of price control could be considered to adjust the consumption structure of meat in China. Conversely, the dietary guidelines for Chinese residents only focus the importance of eating moderate amounts of fish, poultry, eggs and lean meat( 41 ). Hence, considering the health benefits and risks, it may be necessary to recommend consumption of red meat, processed meat and poultry separately, based on the differential influence on health. Most important is to improve the public nutrition education programme, especially on the dietary guidelines and benefits of increasing vegetable, poultry, fish and seafood consumption.
Acknowledgements
Most of the data presented in this article were based on the China Statistical Yearbook, 1992 China Nutrition Survey, 2002 China Health and Nutrition Survey and 2010-2012 China Health and Nutrition Surveillance. We thank the National Bureau of Statistics of the People's Republic of China for their annual reports. The national surveys of nutrition were supported by National Health and Family Planning Commission (Ministry of Health), the Ministry of Science and Technology and the Ministry of Finance in China. We would like to thank all participants and team members from thirty-one provinces who participated in the national surveys for their valuable contributions.
Financial Support
This research received no specific grant from any funding agency in the public, commercial or not-for-profit sectors.
Conflicts of Interest
None.
Authorship
Y. H., J. X. and L. Z. collected data and wrote drafts of the manuscript under the supervision of Y. Y. and Y. X. All authors contributed to the interpretation of the systematic review, commented on drafts of the manuscript and approved the final version.


