


I. INTRODUCTION
Curves make for persistent phenomena in the history of economics (Giraud Reference Giraud, Coopmans, Vertesi, Lynch and Woolgar2014; Morgan Reference Morgan2012). This paper tackles the graphical representation of the behavior of real wages under persistent inflationary conditions, also known as the “sawtooth wages model.”
Economists in the postwar period have singled out the persistence of inflationary pressures in both developed and underdeveloped economies (see Harris Reference Harris1949, p. 200; Campbell Reference Campbell1956, p. 221). There are many perceptions and opinions regarding the underlying causes of this extensive upward bias in price level historical data in the postwar period. Robert Leeson (Reference Leeson1997) has found evidence of the profession’s general change of mind and heart regarding a tolerable rate of inflation that led to a gradual eclipse of the goal of zero inflation;Footnote 1 “employment” rose to the status of a primary policy goal, relegating “price stability” to a second tier. Between 1953 and 1959, the fact that inflation had become persistent in industrial countries reinforced this view. Many countries faced over 100% inflation between 1962 and 1992; for instance, Germany faced a 184% increase, whereas Italy endured a 1300% inflation rate (Reddaway Reference Reddaway, Harcourt and Riach1997, pp. 32–33).
Despite the feeling that inflation was being greatly exaggerated as a menace (see, for instance, Tobin and Ross Reference Tobin and Ross1971), fears of a runaway inflation were not absent. In the 1960s, there were many warnings issued in gloomy images: for example, the view that a “Faustian pact” with the “inflation dragon” would engender a “Latin Americanisation of the world,” whereby a “cost inflation at a high rate has produced a ‘general crisis of capitalism’ and the stability of Communist prices shines like a good deed in a naughty world; yet economic theory has nothing to say” (Leeson Reference Leeson1997, pp. 482–483). Inflation had in fact been a persistent phenomenon in the region, ranging from an average 18% yearly rise (1950 to 1955) to 62% (1960 to 1965) in Brazil, while in Argentina it moved from 17% to 27%, and in Chile, from 47% to 29% (falling but still high in comparison with developed countries’ standards), for the same periods (see Thorp Reference Thorp and Griffin1971, p. 184; Leeson Reference Leeson1997).
As a result of this persistent “baffling inflation” (Takami Reference Takami2015), the economics profession would devote much intellectual energy into characterizing this phenomenon in theoretical and empirical frameworks. The Phillips trade-off controversy of the 1960s exemplifies this new form of thinking and talking about macroeconomics and, particularly, about the dynamics of employment and inflation (see Humphrey Reference Humphrey1976, p. 8). Paul Samuelson and Robert Solow (Reference Samuelson and Solow1960) reframed the dichotomy between cost-push and demand-pull inflation theories in terms of the trade-off between price inflation and unemployment level (Forder Reference Forder2010). Out of this came the simple diagram of a downward-sloping curve with a continuum of policy options for the short run. Richard Lipsey (Reference Lipsey1960) furthered the mathematical underpinnings of Phillips’s original relationship between the rate of change of money wages and the level of unemployment, and set the “new problem” of finding a suitable theory for this empirical regularity (see Tobin Reference Tobin1970).
Inflation thus proved to be a cross-country resilient nuisance in the postwar period and many index-linking schemes were conceived in various countries to cope with ongoing inflation up until the 1980s (see Page and Trollope Reference Page and Sandra Trollope1974; Fischer Reference Fischer1981). But it was in Latin America of the 1950s, particularly in Brazil, where an empirical pattern of real wages was translated into a graphical representation that evolved into a prototype of a theoretical machine widely used in policy design in chronically inflationary economies, most of which were developing nations.
Despite its apparent suitability to observed economic patterns, the sawtooth model was not immediately accepted by a wider audience as an analytical tool, although it was used to illustrate certain arguments during the 1960s. Its heyday was yet to come a quarter of a century later, to inform debates on anti-inflation measures in chronically inflationary economies, in Brazil, where this model achieved high levels of analytical sophistication. As the mathematical revolution slowly settled in economics, it was the structuralist economists who would eventually formalize in mathematical context the arguments conveyed by the sawtooth-shaped visual representation, as a second round of the monetarist-structuralist controversy unfolded in the late 1970s (see Toye Reference Toye1987; and Boianovsky Reference Boianovsky2012 reflects the first round of the controversy).
The paper presents the development of this model and is divided in five subsequent sections beyond this introduction. Section II covers some institutional aspects of indexation from an international perspective, pointing out how various countries applied some inflation-indexing arrangement, as well as the Brazilian uniqueness in this regard. The third section tracks the early days of the sawtooth wages graphical representations born out of Bent Hansen’s institutions-laden neoclassical model of inflation. Section IV deals with further analytical improvements by Nicholas Kaldor, Celso Furtado, and Nicholas Georgescu-Roegen. In section V, we cover further theoretical developments and policy applications of the sawtooth model to the second round of the monetarist-structuralist controversy over inflation stabilization, with a focus on the Brazilian experience. The last section concludes the paper by reviewing the argument.
II. HISTORICAL ASPECTS OF INDEXATION
There is a long history of the perception of indexation as a mechanism to cope with fluctuation in prices and the uncertainty associated with ideas going back to the early eighteenth century (see Giersch Reference Giersch, Friedman, Giersch and Fellner1974, p. 4n5).Footnote 2 Christopher Hanes (Reference Hanes2010) makes a compelling narrative of the early days of this idea in the United States and guides us through its origins. The notion of a “sliding scale” was, however, applied to sectional negotiations between workers and employers and was mostly concentrated in mining and metals industries. Moreover, it did not refer to aggregate consumer price indexes but to a given set of sector prices. It had two purposes: one was to set a binding minimum level to wage rates, no matter what happened to prices; the other was similar to a profit-sharing mechanism, by tying wages to product prices alone or to the margin between product prices and prices of non-labor raw materials.Footnote 3 Working it out in reality proved quite troublesome, for several price-related informational problems are bound to arise. Employers had to open accounting books in order to reveal sales prices and strategies, a necessity with which few enjoyed complying. The question of which prices would be adequate, whether those of a general price list or the open-market prices that embodied discounts, was largely under the prerogative of the employer, and thus entailed protracted dispute during negotiations.Footnote 4
By 1925, Irving Fisher had gained notoriety for his studies on price index technology. He was known for not only favoring the “tabular standard” (the label given to widespread indexation at the time) but actually coming to terms with a manufacturing company that he assisted in founding to issue a purchasing power security. Fisher argued that the terms under which the bond was issued led to its failure, due to the unfamiliarity of the market with the new asset (see McNelis Reference McNelis1986). However, the indexing of Fisher’s bond was peculiar in that a 10% change in the price level was required before the indexing provision became effective.Footnote 5
When prices accelerated in many countries in the 1960s, the debate on the alternatives to attenuate the harmful effects of changing inflation was vigorously revived.Footnote 6 Along the 1970s, controversy grew hotter and a more clear-cut division was noted between those who focused on the benefits of indexation and those of the opinion that such arrangements left the economic system more vulnerable to shocks and surges of inflation. S. A. B. Page and Sandra Trollope (Reference Page and Sandra Trollope1974) compiled the institutional diversity of indexing schemes and provided a summary in Table 1 below.
Table 1. Summary of Countries’ Experience with Indexation until 1974

Source: Page and Trollope (Reference Page and Sandra Trollope1974, p. 47).
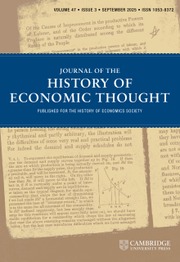
Stanley Fischer (Reference Fischer1981, pp. 24–25) builds on the above survey and other sources and gives an illustrative portrait of indexation up to 1981. Amongst the forty countries that constitute the sample, only France,Footnote 7 Brazil, and Israel account for indexation in all of the aspects considered: wages, taxes, social security, investment, and government bonds. Fischer’s data is summarized in Table 2 below. According to this composition of the economy, 35% of the countries have over one-half of their economies indexed to some measure of inflation. Almost half of the countries (43%) use some sort of wage indexation scheme and roughly two-thirds of the sample (68%) tie its financial bonds to inflation indexes.
Table 2. Indexation Dummies, by Countries
Source: Fischer (Reference Fischer1981, pp. 25–26; 1986, pp. 208–209)
In addition, on the institutional and structural aspects, Jeffrey Sachs (Reference Sachs1979, p. 316) shows that a major change in institutions of wage bargaining led to an autonomous increase of real wages ahead of productivity in many developed countries between 1969 and 1973.
Following the 1973–74 oil shock, trade unions held their ground, imposing downward resistance to real wages in Europe and Japan, albeit not as much in the US. Moving on to the 1980s, Paul McNelis (Reference McNelis1986, Reference McNelis1988) has surveyed the different institutional arrangements regarding indexation carried out by most of the countries mentioned above. Most of them underwent a gradual de-indexing process, which did not happen in Brazil or Israel. These latter countries were unable to dismantle the rigid indexing structure while they were trapped in an escalating hike towards hyperinflation, a predicament that was avoided only by stabilization attempts launched by governments in the 1980s (successful in Israel and round failures in Brazil). Among the countries that promoted de-indexing measures are Chile (1982), Finland (1967), and Iceland (1983). In these three cases, inflation did not rise after indexation was suspended, although in the case of Chile rates of inflation were still far above the standard levels of developed countries.
Indexation is a double-edged sword. It is believed by some to instil a self-feeding process in inflation dynamics (see Simonsen Reference Simonsen1970; Fischer Reference Fischer1981) whilst others praise it for its inflation-dampening effects via moderation of workers’ wage claims (as in Friedman Reference Friedman, Friedman, Giersch and Fellner1974 and Giersch Reference Giersch, Friedman, Giersch and Fellner1974). In developed countries, historical records have shown that inflation precedes consumer or wholesale price indexation and disinflation antedates de-indexation (see Braun Reference Braun1976). For these countries, experience has pointed out that indexing contracts under a rising inflation moderates this uprising via labor market restraints. As for developing countries, indexation is frequently understood in the literature to act merely as a propagating device of these pressures to the rest of the economy.Footnote 8
These structural forces sustaining high inflation in the Latin American region appeared during its attempt to climb the development ladder. The Import-Substituting Industrialization policy required raising several barriers to trade, keeping economies closed, which meant inflation could not be easily tamed by way of increased imports of consumption goods. The side effects of the troubled process of development in the region were deep distributional conflicts coupled with large exchange rate volatility under severe foreign currency constraints and widespread productive bottlenecks. In such an underdeveloped system with rampant institutional flaws in fiscal and monetary policies, sectoral pressures and supply shocks (such as sharp exchange rate devaluations) continuously pushed prices up, triggering the wage-price spiral (see Carvalho and Suprinyak Reference Carvalho and Suprinyak2022, pp. 564–567). As a result, the use of index-linking schemes by governments became gradually endemic to the region, particularly in Brazil after the 1964 military coup.
Given its distributional nature, indexation became a relevant currency of political power. Specific economic sectors and income groups received greater protection from inflation than others, which led to gaping misalignment among various social groups’ real incomes. For instance, in Brazil under military control, wealthy groups had access to inflation-protected public debt securities while workers’ bargaining power was neutralized by the government-determined sliding scale of minimum wage readjustments that recurrently underprotected the purchasing power of wages (Georgescu-Roegen [1970] Reference Georgescu-Roegen and Georgescu-Roegen1976; Resende Reference Resende1982). These differences in real perceived incomes kept conflict going, keeping prices rising constantly, and disseminated the need to broaden the coverage of inflation-correction mechanisms in the economy. The deteriorating expectation that governments could do away with inflation displaced conflict to the institutional design sphere, where decisions about indexation coverage took place. After all, this meant “inflation without tears” (Fishlow Reference Fishlow1974), at least for those with incomes and assets protected.
To sum up, a wide variety of countries used some type—albeit with varied scopes—of index-linkages of contracts while facing very different inflation trends. The available evidence has been inconclusive as to any absolute inflation-feeding pattern of indexation among the sampled countries. This reinforces the hypothesis that indexation is but an effect of protracted deep-seated pressures impinging upon the behavior of prices. Once these pressures are acknowledged as persistent causes of price increases, the empirically observed inflationary bias can be explained; in response to this and to each economy’s historical and institutional features, different indexing “styles” tend to emerge as structural properties of the economic system.Footnote 9 And once they do, these indexing styles engender country-specific channels through which the history of inflation feeds back on the inflationary environment. Institutions and structural dynamics invite themselves as immediate and obvious candidates to be accountable for such disparities in inflationary experiences and, in consequence, in the enactment of indexing clauses. Against this background, economists developed a visual representation of a persistent pattern of inflation that could depict the staggered nature of wage adjustments and their feedback impacts on the behavior of inflation, namely: the sawtooth wages model.
III. ANTICIPATIONS OF THE SAWTOOTH DIAGRAM
The so-called sawtooth wages model is an ingeniously simple way of portraying an economy with a persistently high inflation trend (Arida Reference Arida1992, pp. 36–37). The coupling together of inflation-correcting schemes, such as index-linking of contracts and prices, and a gradual approach to anti-inflation measures, sponsored by governments in Latin America, give nominal contractual incomes a visual pattern with a resemblance to a “sawtooth.” Figure 1 shows a constant average real wage (
 $ {w}^{ave} $
, in the diagram) resulting from a peak real wage (
$ {w}^{ave} $
, in the diagram) resulting from a peak real wage (
 $ {w}^P $
) being corroded by inflation down to a trough real wage just prior to nominal adjustment according to the recorded inflation rate within each h-length period.Footnote
10 This fixed-interval length aimed to depict the disseminated practice of indexation to price indexes and could be set as a parameter (subject to change by incomes policy) or an endogenous variable that could accelerate inflation by shortening wage adjustment intervals (as in Arida Reference Arida1982).
$ {w}^P $
) being corroded by inflation down to a trough real wage just prior to nominal adjustment according to the recorded inflation rate within each h-length period.Footnote
10 This fixed-interval length aimed to depict the disseminated practice of indexation to price indexes and could be set as a parameter (subject to change by incomes policy) or an endogenous variable that could accelerate inflation by shortening wage adjustment intervals (as in Arida Reference Arida1982).

Figure 1. Sawtooth Model or the Simonsen Curve.
Source: Author’s own elaboration.
The received view is that the sawtooth diagram was born out of the “inflation feedback model,” which was developed independently by Mário Henrique Simonsen (Reference Simonsen1964, Reference Simonsen1970) and by Felipe Pazos (Reference Pazos1963, Reference Pazos1969, Reference Pazos1972). A central policy-maker in the Brazilian stabilization attempts, Francisco Lopes (Reference Lopes and Sayad1979), has credited Simonsen (Reference Simonsen1970) for “inventing” the first diagram and has opposed those who treat this advance as a mere technical curiosity, instead of a relevant contribution to economic theory (see Lopes and Williamson [1978] Reference Lopes and Williamson1980, p. 70). However, Leonardo Vera (Reference Vera2013) has recently unearthed evidence of an important contribution by Nicholas Kaldor’s (Reference Kaldor1957) “intuitive”—for not expressed in mathematical form—and visual representation of this pattern (1957, p. 68). Straightforwardly, Kaldor (Reference Kaldor1957, p. 75) described the pattern as follows: “Real wages thus fluctuate around an average set by the extremes of the level of wages immediately prior to and immediately after a particular adjustment” (my emphasis). Moreover, Kaldor also anticipated the circular cumulative causation between endogenous variations in contract length and accelerating inflation,Footnote 11 a detail that furthered the analytical value of the diagram, as later usage would prove (see, for instance, Bacha and Lopes Reference Bacha and Lopes1983). But, as George Feiwel (Reference Feiwel1975) reminds us, scientific work does not occur in a vacuum, and by this token no discovery is totally new. And, as it so happens, Swedish economist Bent Hansen had explored this visual representation a few years before Kaldor, but on a completely different analytical framework.
In his 1951 book, titled A Study in the Theory of Inflation,Footnote 12 Hansen sets out to demonstrate that inflation may arise before full employment is achieved, launching a two-sector model comprised of a goods market and a factor market. When analyzing a policy of constant real wage (w/p), Hansen (Reference Hansen1951) brought in an institutional factor of the interval in-between adjustments of nominal wages, so that the above relation falls discontinuously along this interval and then is adjusted, pushing inflation up at discontinuous hikes. Assuming that wages rise independently of supply and demand adjustment in the labor market (Hansen Reference Hansen1951, p. 16), a continuous “induced inflation”Footnote 13 ensues, which thus presses upon prices in the commodities sector, resulting in a wage-price spiral. To illustrate this process, Hansen displays (Figure 2) a set of diagrams that represent the time path of each set of variables; among them, the sawtooth pattern of real wages behavior under constant inflation (see Hansen Reference Hansen1951, p. 170, figure 18).

Figure 2. Bent Hansen’s Dynamic Chart of Macroeconomic Impacts of Indexed Wages.
Source: Hansen (Reference Hansen1951, p. 170, figure 18).
This pattern comes out of the “price-inertia coefficients” (Hansen Reference Hansen1951, p. 227), a feature present in each and every sector of the economy, which is denoted by the reciprocal of constant k (>0), embedded in the price-reaction equations such as in the expression below:
 $$ \frac{d{p}_i}{dt}={p}_i.k.\frac{x_i}{q_i} $$
where the time-variation of a specific price
 $ \left(\frac{d{p}_i}{dt}\right) $
is a function of its own level multiplied by the price-inertia coefficient (k) and by the ratio of excess demand (
$ \left(\frac{d{p}_i}{dt}\right) $
is a function of its own level multiplied by the price-inertia coefficient (k) and by the ratio of excess demand (
 $ {x}_i $
) to supply of commodity (
$ {x}_i $
) to supply of commodity (
 $ {q}_i $
). Hansen then moves on to a “discontinuous analysis,” in which “the changes of prices occur only at the beginning of each period and are such that the excess demand occurring in the preceding period determines the marking-up of the price at the beginning of the period considered” (Hansen Reference Hansen1951, p. 224). Letting the length of the period be
$ {q}_i $
). Hansen then moves on to a “discontinuous analysis,” in which “the changes of prices occur only at the beginning of each period and are such that the excess demand occurring in the preceding period determines the marking-up of the price at the beginning of the period considered” (Hansen Reference Hansen1951, p. 224). Letting the length of the period be
 $ \varDelta t\;\left(={t}_2-{t}_1\right) $
, and the excess demand at
$ \varDelta t\;\left(={t}_2-{t}_1\right) $
, and the excess demand at
 $ {t}_1 $
be
$ {t}_1 $
be
 $ {x}_i^1 $
, we find the corresponding discrete relation to the above equation:
$ {x}_i^1 $
, we find the corresponding discrete relation to the above equation:
 $$ \varDelta {p}_i={p}_i^1.k.\frac{x_i^1}{q_i^1}.\varDelta t $$
Thus, the longer the period and the greater the value of the constant (k)—that is, lower price rigidity—the higher will be the variation of prices due to a lagged response of prices to excess demand. Hansen (Reference Hansen1951, p. 225) admits that, in reality, “it is not possible to reckon that k—of which the reciprocal can be taken to express inertia of prices with respect to ‘induced’ changes—will in general be the same for all commodities and for all factors.” The relevant price index, in the discontinuous case, must have the form of
 $$ \frac{\varSigma \left(\frac{1}{k_i}\right).{p}_i^2}{\varSigma \left(\frac{1}{k_i}\right).{p}_i^1} $$
so that the weights are represented by the “price-inertia coefficients.”
Therefore, Hansen anticipated the graphical dynamical representation of the direct inverse relationship between real wages and inflation in a system of periodically adjusted fixed nominal incomes, which would give the behavior of real wages a “zigzag” shape. Hansen’s contribution is neoclassical in spirit—inflation is basically demand-pulled—but carries valuable institutional undertones by the framing of wage behavior as a result of a conventional updating of nominal wages based on accumulated price variation within an interval between adjustments. This early formalization of a “wage adjustment rule” can be construed as a symptom of an emergent tradition that gained momentum in the immediate postwar period and was further emboldened in the decades following, when the intellectual landscape of the economics profession grew more mechanically and mathematically oriented. Striking as it may sound, Hansen’s model would anticipate the core of theoretical and policy speculations on the determinants of inflation in Latin America in the late 1970s and early 1980s. More than that, it resonated, probably via Juan Noyola Vasquez, on Celso Furtado’s writings on inflation.Footnote 14
IV. FURTHER IMPROVEMENTS IN ANALYTICAL OPERATION OF THE MODEL
Before providing a diagram of the sawtooth behavior of wages, Kaldor (Reference Kaldor1957) set up the connection between inflation and development through a discoursive model of conflicting claims that accounted for the self-sustaining pattern of inflation (see Figure 3). In The Economic Growth of Brazil, Furtado ([1959] Reference Furtado, Aguiar and Drysdale1963, ch. 35) formulated a neutral inflation dynamic equilibrium in which the distributional profile is left unaffected by the rise in the price level. The self-reinforcing struggle to defend one’s income against erosion by inflation is slowly imprinted in price- and wage-setting behavior by institutional changes in the form of various index-linking practices. The economic system thus tends to assimilate any shock into a speeding up of the real-income defense process. Kaldor (Reference Kaldor1957, p. 75) also foresaw that any further excitement of distributional struggles would lead to “adjustments to earnings hav[ing] to be made at increasingly shorter intervals,” launching an inflationary spiral. This “sterile phase of inflation” becomes a pointless “game of passing the buck,” for it would cease to entail any positive effects on output growth (Furtado [1962] Reference Furtado and Macedo1965, pp. 101–113).Footnote 15

Almost a decade after Furtado (Reference Furtado1954) published his view of inflation, Felipe Pazos’s (Reference Pazos1963) first writing on the oscillating pattern of real wages appeared in his article “Notas para un Estudio de la Espiral Inflacionaria,” published by the Mexican journal El Trimestre Económico in 1963 and also in the first volume of the “Centro de Estudios Monetarios Lationamericanos”—CEMLA with the support of the International Monetary Fund and the Interamerican Bank for Development (IBD), both from Washington, DC. Pazos (Reference Pazos1963, p. 612) presents a table with nominal and real wages within a staggered structure of wage adjustments. Although it is still quite vague in its shape, the oscillating behavior of wages is taken into account.
One year later, Simonsen (Reference Simonsen1964) described a regime of chronic inflation wherein real incomes undergo an oscillatory behavior with a staggered structure of real income at any given point in time: some groups are at their peak real income, some are at their “trough” real income, while others are midway. Simonsen (Reference Simonsen1964, p. 18) illustrated the unsynchronized structure of income adjustments as overlapping cycles (see Figure 4).

Figure 4. – Sawtooth Shape of the Real Minimum Wage: Schematics of Real Wage(*) Behavior (y-axis) through Time (x-axis) (right panel).
Source: Simonsen (Reference Simonsen1964, p. 92)
(*)Title of the diagram reads: “Schematic Representation of the Wage Adjustment Formula,” and below it, in parentheses, it reads: “Average plus increase in productivity.” The image represents the peak real wage (Picos) at level A, the average real wage (Média) at level E, and the trough real wages (Vales) at level C.
In aggregate terms, argues Simonsen, “everything appears as if individuals, instead of living purchasing power cycles, remained in the comfortable stability of average income levels” (Reference Simonsen1964, p. 19). The very asynchrony among the various income peak levels may turn inflation economically viable. Were all the peak levels to be simultaneously obtained, the result would be the acceleration of price increases. It is thus the “effect of previous peak levels on the aspirations and expectations that explain the difficulties faced by monetary stabilization” (p. 19).Footnote 16
By the time of Simonsen’s first book, the Brazilian government had imposed, under a recently initiated military regime, a wage-adjustment formula that would discipline wage growth throughout the economy so as to keep it in pace with productivity growth. Under the guise of the Plan for Economic Action of the Government (PAEG in Portuguese), inflation was understood to be a result of excess claims on society’s output due to out-of-control public deficit and wage claims outpacing labor productivity growth (Resende Reference Resende1982, p. 774). The effective wage-adjustment formula implied a one-year-lagged inflation correction plus a productivity growth index plus a twelve-month-ahead inflation forecast (systematically underestimated). Simonsen graphically depicted the expected outcome of that policy measure (Reference Simonsen1964, p. 92) as slowing inflation down (flattening the real wage line) while lowering the peak real wage, extending the interval length between wage adjustments. All of this could be achieved with an unchanged average real wage. And here lay the rub. Simonsen showed that a toning down of distributional conflict (i.e., the gap between peak and average real wage) could be attained without harming workers’ interests any further. This conclusion relied on Simonsen’s (Reference Simonsen1964) assumption that at every contract adjustment date, the recipients of fixed income restored their peak real income level and that, by the constant inflationary erosion of real incomes, the “normal” level coincided with the average real income throughout the period. As a result, inflation would be distributively neutral in the dynamic sense. This was the first record of the sawtooth wages model being used as an “object of reasoning” about stabilization policy.
Simonsen’s conciliatory “inflation feedback model” managed to encompass within a single framework both sides of the monetarist-structuralist controversy (see Boianovsky Reference Boianovsky2012, p. 290). But it was not immune to criticism. A few years after its publication, the time-honored ecological economist Nicholas Georgescu-Roegen (Reference Georgescu-Roegen1968, [1970] Reference Georgescu-Roegen and Georgescu-Roegen1976) published two papers on “the structural inflation lock,” in which he takes issue with this normal-average correspondency assumption and extends Simonsen’s (Reference Simonsen1964, p. 92) framework by dividing the economy between fixed-income receivers and the variable income-receivers. The pitfall in Simonsen’s conclusion, according to Georgescu-Roegen, is the disregard of how labor productivity enhancements, which are bound to occur along the process of economic development, fail to compensate labor accordingly, due to a host of structural and institutional mechanisms that hold the economy locked in an inflation-addicted growth model.Footnote 17 Georgescu-Roegen ([1970] Reference Georgescu-Roegen and Georgescu-Roegen1976, p. 167) later put forth a distribution-related extended version of the visual argument, wherein the upward sloping band of the real wage trend accounts for the income transfer from fixed-income recipients—which he identifies with workers—to variable-income earners (profit recipients).
In contrast with Simonsen’s horizontal graphical depiction of the real wage variation band, Georgescu-Roegen (Reference Georgescu-Roegen1968, p. 13) understood that economic development and the accompanying productivity growth would most likely, following W. Arthur Lewis (Reference Lewis1954), entail progressively higher peak and average real wages. One of his dented diagrams (Georgescu-Roegen ([1970] Reference Georgescu-Roegen and Georgescu-Roegen1976) shows that the wage policy set forth by the Brazilian government restored real income to its previous levels without correcting it for the actual productivity gains observed during the Brazilian economic “miracle” from 1967 onwards (Figure 5). In 1968, the military regime escalated measures against civil rights and labor unions. By stifling protest, the government severely limited workers’ ability to push for higher wages. Also, wide-ranging institutional reforms recently implemented were combined with a large idle productive capacity to generate the strongest growth spurt Brazil ever had. In policy circles, inflation concerns lost ground in policy priorities as the Brazilian economic “miracle” reached its full swing, with an average yearly growth rate of 10.1% between 1967 and 1974 (see Bacha Reference Bacha1977, p. 48, for further data on the period), while inflation de-escalated with the help of wage and cost controls put in place by the government (see Taylor et al. Reference Taylor, Bacha, Cardoso and Lysy1980, ch. 10).

Figure 5. The Sawtooth Diagrams and Regressive Income Distribution.
Source: Georgescu-Roegen (Reference Georgescu-Roegen1968, p. 13).
In retrospect, Georgescu-Roegen’s contribution to the debates on inflation and income distribution seems more deserving of attention than the mild reactions it generated at the time (see Carvalho and Suprinyak Reference Carvalho and Suprinyak2022). His model clearly showed that, with wages tied down by the centralized adjustment formula, profits and rents were free to accrue most, if not all, real income growth that followed development. Reality would later prove him right, as an array of economic and institutional forces stirred up social conflict through the 1970s. Inflation escalated under the strain of domestic policies and international shocks, which agravated “the inability of wage-earners to defend their real incomes,” and which meant that inflation resulted in “a tendency to make the income distribution more uneven” (Tyler Reference Tyler1973, p. 322). The debate on the causes of inflation was reignited under new circumstances in the developed and underdeveloped Western societies. The sawtooth wages model rose to prominence in Latin America just as the Phillips Curve fell out of favor in the northern hemisphere’s academic quarters in the late 1970s.
V. THEORETICAL DEVELOPMENTS AND POLICY IMPLICATIONS
The idea that any fixed nominal value has its real value eroded by inflation reaches at least as far back as W. Stanley Jevons’s (Reference Jevons1884) social effects of the devaluation of gold and was given a proper analytical update by Irving Fisher’s (Reference Fisher1911) The Purchasing Power of Money. The core mechanism of the inflation-related sawtooth model is, hence, in no way new, although its frequency of repetition under a seemingly autonomous thrust seems to be a more recent phenomenon tied to the wide spread of indexation schemes in the postwar era (see Campbell Reference Campbell1956; Brenner Reference Brenner1979). Crucial to the early development of this visual representation was the empirical reality of high and chronic inflation in Latin America. No other country has achieved such a widespread usage of inflation-correction instruments as Brazil (see Friedman Reference Friedman, Friedman, Giersch and Fellner1974; Kafka Reference Kafka, Friedman, Giersch and Fellner1974; Fischer Reference Fischer1981).Footnote 18
Throughout the 1970s, the heated disputeFootnote 19 over the existence of an exploitable Phillips trade-off traveled south of the Equator. The United States struggled with the rise of the stagflation monetarist theory while South America, particularly Brazil, witnessed the establishment of the sawtooth wages model as a benchmark framework for inflation-related debates, in both academic and policy circles. The sawtooth model gradually became a cornerstone of non-monetary inflation theories linked to structuralist approaches, old and new (see Toye Reference Toye1987). Although the model’s theoretical relevance has been subject to debate since its conception, its policy application became quite prominent in Brazilian stabilization debates in the early 1980s, given its visual communicability and fair level of practicality in generating various results and even in designing policy proposals (see, for instance, Lopes Reference Lopes1986; Modiano Reference Modiano1988).
Francisco Lopes (Reference Lopes1976) published his first attempt at mathematical formalization of the “inflation neutrality” phenomenon in Revista Brasileira de Economia (also published in Lopes Reference Lopes1986, ch. 4), wherein a sawtooth diagram displays the zigzag pattern of real incomes when their nominal values were adjusted in fixed intervals. An environment with a constant inflation renders real incomes fully flexible, while their average values remain stable at the same level. Inflation could be neutralized in its distributional effects if the average real incomes of all productive factors (e.g., two workers, or profits and wages) were consistent with each other and remained stationary at levels compatible with the level of capacity utilization that would be observed under price stability, its neutral values (Lopes Reference Lopes1986, pp. 25–26). This basic framework allows Lopes to envisage several behavioral developments, as agents jockey against each other to maintain or increase their share of the pie. Neutrality is then achieved when these individuals or income-receivers adjust their desired real income levels to coincide with the average real income level (Figure 6).

Figure 6. The Sawtooth Diagrams of Real Wages through Time.
Source: Lopes (Reference Lopes1986, p. 48).
By 1978, Lopes had already come across a simple way to express what could explain inflation. He wrote a paper with John Williamson (Lopes and Williamson [1978] Reference Lopes and Williamson1980) where they derive the mathematical conditions for a “consistent indexation.” Basically, they find that the downward rigidity of the peak level perpetuates inflation. If real incomes were adjusted, falling short of the desired peak real incomes levels, inflation would decelerate and the same real wage could be attained but with a lower inflation rate. They showed “the operational mechanics of the system of consistent indexation” to be reached with fixed-interval adjustments of nominal wages. Due to the specifics of the wage indexation law in Brazil (see Simonsen Reference Simonsen1970), when wages are settled the inflation rate that will erode its real value is not yet known, so that the relevant variable workers’ target is the expected rate of inflation for the period following negotiations. The economic policy problem thus entails finding the prospective value of inflation that will maintain the average real wage constant through time. Any attempt to curtail inflation must then involve a less-than-full indexation of wages to past inflation.
Soon thereafter, Lopes co-authored another work with André Lara Resende, making extensive use of the diagram (Figure 7), but now in order to undergird an empirical analysis of the causes of the then-recent acceleration of inflation in Brazil (Resende and Lopes [1979] Reference Lopes and Sayad1981). The diagram could also depict the long-known problem of lack of synchronism among wage and price readjustments in a staggered adjustment setting (figures 8 and 9). It proved to be quite practical to illustrate both the coordination problem that generated inflation and the alternatives to achieve a neutral solution (see Lopes Reference Lopes1986, ch. 18, for the illustration of the inertial inflation case).

Figure 7. The Sawtooth Diagram of Real Wages: Illustrative Purposes (*).
Source: Resende and Lopes ([1979] Reference Resende and Lopes1981, p. 610)
(*) On top of the left-hand panel, it reads: “Increase in Average Real Wage.”

Figure 8. The Sawtooth Diagram of Real Wages: Lack of Synchronism.
Source: Resende and Lopes ([1979] Reference Lopes and Sayad1981, p. 610).

Figure 9. The Sawtooth Diagram of Real Wages: Various Systems of Wage Indexations.
Source: Lopes (Reference Lopes1986, p. 89).
The sawtooth model gradually became a cornerstone of non-monetary stabilization policy based on the rising inertial inflation hypothesis that came to dominate economists’ opinions in the late 1970s (see Carvalho Reference Carvalho2019). Lopes (Reference Lopes1985) operates the model to show how the so-called heterodox shock in the form of an economy-wide price and wage freeze would entail distributional imbalances. Using a two-person overlapping real wage periodic adjustment, a price and wage freeze would leave agents a and b with different real wages, a situation likely to keep the inflation memory in store (see Figure 10). As soon as the freeze was undone, conflict would restore the previous real wage oscillating dynamics and inflation would come back. Thus a post-shock transition period could apply corrective measures to bring all wages and prices to their historical twenty-four-month averages.

Figure 10. Heterodox Shock: Real Wages under a Price Freeze.
Source: Author’s own elaboration based on Lopes (Reference Lopes1985).
Pérsio Arida (Reference Arida1992, pp. 36–37) would later recall the model’s usefulness in simplifying the dynamics of nominal wages to a considerable extent. Average real wages depend on (i) exogenous base wages (beginning of period), (ii) the length of interval between wage adjustments, and (iii) the rate of inflation over the indexing interval.Footnote 20 A decade earlier, the same Arida (Reference Arida1982) had set out to determine the conditions under which an “optimal indexing scheme” could be designed. The model addressed the choice between a fixed-period indexation and an endogenous interval arrangement for a wage-indexing policy. Inflation results from conflict between entrepreneurs and workers. For a given rate of inflation, conflict will impose the maximum length for adjustment intervals.Footnote 21 Arida derives the notion that the shortening of indexing intervals leads to higher inflation and may set the economy on an explosive path, leading to hyperinflation, thus mathematically formalizing the arguments set forth by Kaldor (Reference Kaldor1957) and Furtado (Reference Furtado1954, [1962] Reference Furtado and Macedo1965), although no visual representation of the sawtooth pattern was displayed.
Edmar Bacha and Lopes (Reference Bacha and Lopes1983) took on this task and provided the most rigorous mathematical formulation of the sawtooth wages model, followed by Simonsen (Reference Simonsen1984) and Modiano (Reference Modiano1988), both of which derived the concept of inflation inertia as a function of the ratio between peak and average wages. The basic function depicts a “linear fall of the logarithm of the real wage, which amounts to assuming that the instantaneous (or monthly) rate of inflation is constant within settlement dates” (Bacha and Lopes Reference Bacha and Lopes1983, p. 3). After some algebraic manipulations, average real wage (
 $ \overline{w} $
) is given by:
$ \overline{w} $
) is given by:
 $$ \overline{w}=\frac{W}{p}=\frac{w^{\ast }}{{\left(1+\overline{p}\right)}^{1-h}} $$
where
 $ {w}^{\ast } $
is some real target under price stability (set by workers’ bargaining power or by convention),
$ {w}^{\ast } $
is some real target under price stability (set by workers’ bargaining power or by convention),
 $ \overline{p} $
is the average inflation rate throughout the period, and
$ \overline{p} $
is the average inflation rate throughout the period, and
 $ h $
denotes a function of the amplifying effects of the number of wage adjustments per period of analysis (n), as in
$ h $
denotes a function of the amplifying effects of the number of wage adjustments per period of analysis (n), as in
 $ h=1-\frac{1}{2n} $
, which the authors simply refer to as “the generalized period analysis representation of a Brazilian type wage indexation system” (Bacha and Lopes Reference Bacha and Lopes1983, p. 5). As the h parameter approaches unity, the system converges to perfect indexation and, in the limit (h=1), the real wage is fully sheltered from inflation (p. 6). Around one year later, Simonsen (Reference Simonsen1984, p. 102) provided yet another version of the same model, with the following formula:
$ h=1-\frac{1}{2n} $
, which the authors simply refer to as “the generalized period analysis representation of a Brazilian type wage indexation system” (Bacha and Lopes Reference Bacha and Lopes1983, p. 5). As the h parameter approaches unity, the system converges to perfect indexation and, in the limit (h=1), the real wage is fully sheltered from inflation (p. 6). Around one year later, Simonsen (Reference Simonsen1984, p. 102) provided yet another version of the same model, with the following formula:
 $$ \overline{w}=\frac{p}{\left(1+p\right).\ln \left(1+p\right)}{w}^{\ast } $$
He assumed that wages are adjusted twice a year at the constant rate of increase in the cost of living (p) at 76% per semester. An annual inflation of 210% yields then
 $ \overline{w}=0.764\;{w}^{\ast } $
, which means that, by the end of the year, average real wage will be situated 23.6% below peak levels obtained at every adjustment date. The wage legislation at the time froze the peak real wage at a level that, should the economy stabilize, the average real wage would rise nearly 30%. Rearranging the equation above, we get the “peak/average wage ratio”:Footnote
22
$ \overline{w}=0.764\;{w}^{\ast } $
, which means that, by the end of the year, average real wage will be situated 23.6% below peak levels obtained at every adjustment date. The wage legislation at the time froze the peak real wage at a level that, should the economy stabilize, the average real wage would rise nearly 30%. Rearranging the equation above, we get the “peak/average wage ratio”:Footnote
22
 $$ \frac{w^{\ast }}{\overline{w}}=c $$
where
 $ c=\frac{\left(1+p\right).\ln \left(1+p\right)}{p} $
depicts the required rate of inflation to bring real wages into consistency with the growth rate of labor productivity (Simonsen Reference Simonsen1970, Reference Simonsen1984). Modiano (Reference Modiano1988, p. 219) found yet another expression to convey a similar message as that posited by Bacha and Lopes (Reference Bacha and Lopes1983), whereby
$ c=\frac{\left(1+p\right).\ln \left(1+p\right)}{p} $
depicts the required rate of inflation to bring real wages into consistency with the growth rate of labor productivity (Simonsen Reference Simonsen1970, Reference Simonsen1984). Modiano (Reference Modiano1988, p. 219) found yet another expression to convey a similar message as that posited by Bacha and Lopes (Reference Bacha and Lopes1983), whereby
 $ c=\frac{\left(h+1\right)p{\left(1+p\right)}^h}{{\left(1+p\right)}^{h+1}-1} $
, which reveals with enhanced clarity the positive relationship between the inconsistency gap
$ c=\frac{\left(h+1\right)p{\left(1+p\right)}^h}{{\left(1+p\right)}^{h+1}-1} $
, which reveals with enhanced clarity the positive relationship between the inconsistency gap
 $ \left(\frac{w^{\ast }}{\overline{w}}\right) $
and the number of adjustments throughout the year (h), as well as the rate of inflation. This approach is also consistent with Robert Rowthorn’s (Reference Rowthorn1977) concept of “aspiration gap.”
$ \left(\frac{w^{\ast }}{\overline{w}}\right) $
and the number of adjustments throughout the year (h), as well as the rate of inflation. This approach is also consistent with Robert Rowthorn’s (Reference Rowthorn1977) concept of “aspiration gap.”
In a nutshell, the sawtooth wages model became a veritable workhorse for the inertial inflation paradigm and the discussions concerning stabilization debate. Its mathematical development is owed entirely to economists at PUC-Rio, namely: the axiomatic representation by Bacha and Lopes (Reference Bacha and Lopes1983) and Modiano’s (Reference Modiano1983a and Reference Modiano and Arida1983b) numerical translation of the “peak/average wage ratio” into a conversion rule for nominal contracts that met the neutrality condition for stabilization purposes. In terms of communication, Simonsen performed a crucial role by attracting the attention of international audiences to the theoretical substance the diagram depicted (e.g., Dornbusch and Simonsen Reference Dornbusch and Dornbusch1988, p. 445, in Figure 11). The graph shows a rising rate of inflation correlated with steeper downward-sloping real wage lines.

Figure 11. Real Minimum Wage and Inflation in Brazil.
Source: Dornbusch and Simonsen (Reference Dornbusch and Dornbusch1988, p. 445).
Figure 12 depicts a long-run perspective of the real minimum wage series from 1960 to 1994, when inflation stabilization was finally achieved in Brazil. During the high-inflation period of the 1980s, the diagram shows the sawtooth becoming increasingly more compressed, when inflation (gray bars) started to speed up, achieving its highest levels between 1991 and 1994, when the Real plan was enacted and Brazil managed to keep inflation at low levels ever since; at first, under a strict fixed exchange rate price anchor and, after the maxi-devaluation of January 1999, under a regime of an inflation-targeting monetary policy framework with floating exchange rates.

Figure 12. Real Minimum Wage (July 1994 = 100) [January 1960–December 1994].
Source: Brazilian Institute for Applied Economic Research (IPEADATA).
VI. CONCLUDING REMARKS
The present paper showed how formal and informal indexation practices led to an emerging pattern of institutional change in monetary institutions in Latin America. This historical process of chronically high inflation was represented by the sawtooth wages model. Our narrative covered the early years of the sawtooth-shaped diagram and then showed how a sequence of analytical improvements led to the model’s full development as both analytical and policy tools, in Brazil particularly, where it was more relevant than in any other neighboring country.
Under chronic inflation, questions addressing the distributional effects were bound to arise. In the absence of any credible indication that prices will stop rising, economic agents set out to find ways to protect the purchasing power of their incomes and the real value of their asset holdings. Once the ongoing inflation seems not to be going away, mechanisms are designed to cope with it. Sliding scales, escalator clauses, index-linked bonds and assets, indexation, and monetary correction are all by-products of the slow process of degeneration of the unit-of-account property of money. Under the influence of such institutional adaptations, actual real world prices and wages are likely to behave quite mechanically (Heymann and Leijonhufvud Reference Heymann and Leijonhufvud1995, p. 34); as history had it, so did the models that explained them.
We have shown above that the structuralist models in the 1950s and 1960s were formalized in discursive form, that is, borrowing Morgan’s (Reference Morgan2012) expression, in a “sea of words,” while hinting at the visual representation of the oscillating pattern real wages underwent under chronic inflation. Bent Hansen’s analytical breakthrough was followed by marginal contributions by Furtado, Kaldor, and Pazos, who singled out the effects of shortening contract length. Simonsen then wrapped it in a more detailed analytical frame, in which Georgescu-Roegen infused a clear-cut distributional aspect to the model within a development path of structural change.
Under the strains of the oil price shocks of the 1970s, inflation was brought back to the fore. As the hyperinflation scare took hold of Latin America, a second round of debates opposed monetarist and structuralist economists in Brazil (see Carvalho Reference Carvalho2019 for a detailed account of both rounds). At this juncture, the sawtooth wages model became the workhorse of the structuralist contention of monetarist reasoning based on an accelerating Phillips curve model. By disparaging the latter as unsuited for a widely and deeply indexed economy, economists made ample use of the sawtooth diagram to convey their stabilization programs. In that sense, we named this diagram a “Phillips curve for the poor,” given its usage by prominent economists and its warm reception by a wide audience of academics and non-academics.
In our seemingly archeological retrieval of this sawtooth-shaped “object of economic reasoning” (Morgan Reference Morgan2012), we highlighted Bent Hansen’s overlooked contribution in setting up the basic framework. But the fact that more than one economist was able to devise this pattern in a seemingly independent fashion from other economists strongly suggests that scattered (albeit unsubstantiated) notions regarding the phenomenon were probably “in the air.” Yet, more broadly, the appearance of the first sawtooth-shaped patterns reflected the rise of the mechanical models in economics. Similar sawtooth-shaped diagrams can be found in the Operations Research (OR) literature (see Arrow, Harris, and Marschak Reference Arrow, Harris and Marscha1950). Mechanical models of inventory management held striking similarities to the visual representations of real incomes under sustained inflationary conditions. Although the literature has not thus far established any factual connection between this field of research and inflation theories, the OR program constitutes a common ancestor of at least two other lines of theoretical development in macroeconomics: the theory of demand for money in the 1950s, and the behavior of prices under inflationary conditions in the late 1970s (for further details, see Carvalho Reference Carvalho2015, chs. 3–5). Future archival research can reveal whether Kaldor or Hansen received any inspiration from this vein of theoretical development or deduced it simply from the postwar inflation indexation literature, as Reuven Brenner (Reference Brenner1979) anticipated.
COMPETING INTERESTS
The author declares no competing interests exist.


