Article contents
The appointment of executive heads in UN treaty-based organizations
Published online by Cambridge University Press: 22 May 2009
Extract
The research reported in this article seeks to understand how and why individuals are appointed to serve as executive heads of international organizations. A simple statement of the behavioral rule used in selection of executive heads is developed in the form of an executive head appointment function. The type of data available for the analysis of the appointment of executive heads in international organizations is identified, and an empirical examination of changes in emphasis in the selection of executive heads is reported. The executive head appointment function utilized in the study views appointment as an executive head as a function of six factors (three organizational, one national, and two personal). Discriminant function analysis is used to determine if the function would distinguish between individuals appointed during the period 1945–57 and those appointed from 1958–70 as executive heads in UN treaty-based organizations. It is possible to distinguish, on the basis of the specified executive head appointment function, between executive heads appointed during the two halves of the time period under study. It is therefore reasonable to conclude that the emphasis involved in the selection of executive heads has changed over time in UN treaty-based organizations.
- Type
- Articles
- Information
- Copyright
- Copyright © The IO Foundation 1976
References
1 The background characteristics of certain secretaries-general of international nongovernmental organizations have been collected by Lawrence Young and Kjell Skjelsbaek. See Young, Lawrence J., “Secretaries General in International Non Governmental Organizations (INGOs),” International Associations 1971/1977 (08-09 1971): 396–403Google Scholar; and Skjelsbaek, Kjell, “A Survey of International Nongovernmental Organizations–2,” International Associations 1974/1976–1977 (06-07 1974): 352–4.Google Scholar
2 For an elaboration of the policy-making perspective presented here see Hoole, Francis W., Politics and Budgeting in the World Health Organization (Bloomington, Ind.: Indiana University Press, forthcoming).Google Scholar
3 The acid test of such a function would be the evaluation of its ability to make accurate predictions about future appointments. Furthermore, a strong empirical test would include some individuals who were appointed and some who were not. This type of test would create in interesting variation in the dependent variable and would set up an evaluation of the function's ability to predict or postdict appointments and non-appointments. Unfortunately data for those tests are currently not available to me. To date I have been able to obtain only data on the individuals actually appointed. Thus the examination of whether the details (either the values of the variables or the weights given to the variables) concerning the factors contained in the function have changed is all that is proper at this time.
4 The data reported in table 1 were collected from the following sources: Yearbook of the United Nations (New York: United Nations, 1947–1970)Google Scholar; The International Who's Who, Thirty-Seventh Edition, 1973–74 (London: Europa Publications Ltd., 1973)Google Scholar; The International Who's Who, Thirtieth Edition, 1966–67 (London: Europa Publications Ltd., 1966)Google Scholar; The International Who's Who, Twenty-Seventh Edition, 1963–64 (London: Europa Publications Ltd., 1963)Google Scholar; The International Who's Who, Nineteenth Edition, 1955 (London: Europa Publications Ltd., 1955)Google Scholar; The International Who's Who, Eleventh Edition, 1947 (London: George Allen and Unwin, 1947)Google Scholar; Who Was Who, 1961–1970 (London: Adam and Charles Black, 1972)Google Scholar; Who Was Who, 1951–1960 (London: Adam and Charles Black, 1961)Google Scholar; World Biography, Fifth Edition (Beth-page, New York: Institute for Research in Biography, Inc., 1954)Google Scholar; Who's Who inthe World, 1st Edition, 1971–1972 (Chicago: Marquis Who's Who, Inc., 1970)Google Scholar; Who's Who in the United Nations (Yonkers-on-Hudson, New York: Christian E. Burckel and Associates, 1951)Google Scholar; The Canadian Who's Who, Volume XII, 1970–1972 (Toronto: Who's Who Canadian Publications, 1972)Google Scholar; and The New York Times, June 19, 1958, November 22, 1961 and February 20, 1967, A second person collected a randomly selected duplicate set of twenty percent of these data. There were no intercoder differences. This was probably because the data were copied in a straightforward manner and little coding was involved. The same procedure was used for the data in table 3 and the same results were obtained, probably for the same reason. It is a weakness of the study that intuition and availability of data, rather than prior explicit theoretical statements, guided the selection of the data.
5 Singer, Marshall R. and Sensenig, Barton III, “Elections within the United Nations: An Experimental Study Utilizing Statistical Analysis,” International Organization 17 (Autumn 1963): 901–25CrossRefGoogle Scholar; Gregg, Robert W., “The Latin American Bloc in United Nations Elections,” Southwestern Social Science Quarterly 46 (09 1965): 146–54Google Scholar; and Weigert, Kathleen Maas and Riggs, Robert E., “Africa and United Nations Elections: An Aggregate Data Analysis,” International Organization 23 (Winter 1969): 1–19.CrossRefGoogle Scholar
6 The scale of assessments from the World Health Organization (WHO) was used because it includes all nations listed in table 2 whereas the United Nations (UN) scale of assessments does not. Actually WHO takes the UN scale from the prior year and adjusts it for membership differences. The budget assessments listed in table 2 were taken from Official Records of the World Health Organization, No. 159, Financial Report, 1 January–31 December 1966 (Geneva: World Health Organization, 1967): 17–9. Gross National Product, Gross Domestic Product or some other indicator could have been used. Since most indicators of development or wealth are highly correlated it probably does not make too much difference which is used for preliminary analysis. In future analyses multiple indicators should be utilized.
7 Yearbook of International Organizations, 12th (1968–69) Edition (Brussels: Union of International Associations, 1969): 13.Google Scholar
8 In a legal sense there were only thirteen specialized agencies in 1966. The International Atomic Energy Agency (IAEA) has been treated as a specialized agency because by most non-legal criteria it is considered to be one.
9 The data which form the basis of table 3 were collected from various documents issued by UN agencies. This data set is available from the International Organization Data Archive of the International Studies Association, which is located at Indiana University. A copy of the data, intercoder reliability information and a listing of the data sources can be obtained by writing to the author of this article. The summary statistics reported in table 3 were calculated on the CDC 6600 Computer at Indiana University's Wrubel Computing Center. The SPSS program was used.
10 The factor analysis was done on the CDC 6600 Computer at Indiana University's Wrubel Computing Center. The SPSS factor analysis program PA1 was used. Some noise may have been introduced into the analysis because of deviation from the normal distribution by certain of the arrays of data. I considered transforming the data, but, in the final analysis, decided not to do so. It is my feeling that the product moment correlation coefficient is robust and partially compensates for this problem. I chose to keep everything as simple as possible. A copy of the correlation matrix and other details regarding the factor analysis can be obtained by writing to the author of this article.
11 Three individuals were appointed to head the IBRD, IFC and IDA at the same time. For those appointees the IBRD data were used for the organizational indices.
12 For an introduction to discriminant function analysis see Cooley, William W. and Lohnes, Paul R., Multivariate Data Analysis (New York: John Wiley and Sons, Inc., 1971): 243–86Google Scholar. The acceptance of the assumptions contained in discriminant function analysis is a refinement of the executive head appointment function. In future studies alternative ways of specifying the function should be considered.
13 All data analysis in this section was done on the CDC 6600 Computer at Indiana University's Wrubel Computing Center. The BMD 5M Discriminant Analysis program was used.
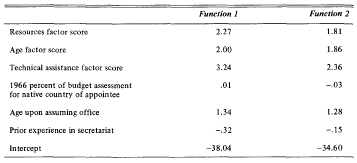
14 The following discriminant function coefficients were used:

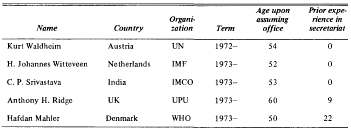
15 The 1945–70 time period was used because at the time the data were collected and analyzed the 1970 Yearbook of the United Nations was the most recent one available. Recently I have had the opportunity to verify that five more executive heads were appointed during 1971, 1972 and 1973:

The data on these individuals were collected from the following sources: Who's Who 1974 (London: Adam and Charles Black, 1974)Google Scholar; The International Who's Who, Thirty-Sixth Edition, 1972–1973 (London: Europa Publications Limited, 1972)Google Scholar; The International Year Book and Statesmen's Who's Who 1974 (London: Mercury House Reference Books, 1974)Google Scholar; and International Monetary Fund, Annual Report 1973 (Washington, D.C.: International Monetary Fund, 1973)Google Scholar. These individuals were included in the second group of appointees (which became the 1958–73 group) and the discriminant function analysis program was run again. The coefficients in the functions changed slightly. The new analysis correctly classified thirty-seven out of fifty-two appointees (71 percent, compared with 72 percent for the prior analysis). The Mahalanobis D Square went up slightly to 24.12 (from 19.64). The inclusion of this new data does not seem to make much difference in the general results obtained. Secretary-General Waldheim was the only one of the new appointees who was misclassified. He had a .34 probability of belonging to the second group. The only individual who was reclassified was Eugene Black, who had a new probability of .503 of belonging to the second group.
16 Cox, Robert W. and Jacobson, Harold K., The Anatomy of Influence: Decision-Making in International Organization (New Haven: Yale University Press, 1973).Google Scholar
17 Alker, Hayward R. Jr and Christensen, Cheryl, “From Causal Modelling to Artificial Intelligence: The Evolution of A UN Peace Making Simulation,” in LaPonce, J. and Smoker, P., eds., Experimentation and Simulation in Political Science (Toronto: University of Toronto Press, 1972): 177–224Google Scholar; and Alker, Hayward R. Jr and Greenberg, William J., “The UN Charter: Alternative Pasts and Alternative Futures,” in Fedder, Edwin H., ed., The United Nations: Problems and Prospects (St. Louis: Center for International Studies, University of Missouri, 1971): 113–42.Google Scholar
18 Hoole, Francis W., “The Simulation of Alternative Budgetary Futures for the World Health Organization,” in Fedder, , ed., The United Nations: Problems and Prospects: 143–64Google Scholar; Hoole, , Politics and Budgeting in the World Health OrganizationGoogle Scholar; and Hoole, Francis W., Job, Brian L. and Tucker, Harvey J., “Incremental Budgeting and International Organizations,” The American Journal of Political Science, forthcoming.Google Scholar
- 3
- Cited by


