Introduction
If we wish to assess the possibility of life elsewhere in the universe, we need first to understand the physical factors that constrain the existence of life in the only example available for study, namely here on Earth. Limits to life could theoretically be set by one of any number of environmental factors, or combination of these, such as pressure, pH, ionizing radiation, or the presence of particular elements or compounds. In this paper, I examine the limits to life on Earth set by one such factor: temperature.
Temperature attracts particular attention from astrobiologists because it sets the boundary conditions for the existence of liquid water, which is known to be essential for life on Earth. Astrobiologists have considered the possibility of life based on solvents other than water (Clarke Reference Clarke, Rothschild and Lister2003; Bains Reference Bains2004; Benner et al. Reference Benner, Ricardo and Carrigan2004; Ward & Baross Reference Ward, Baross, Sullivan and Baross2007), but at present these remain purely theoretical possibilities. The search for exoplanets that might support life is thus essentially a search for rocky planets with surface temperatures allowing the presence of liquid water.
Temperature is a thermodynamic state variable and appears in all of the equations of state that describe the universe. It affects every aspect of existence, as it influences all of the physical features of the environment as well as the inside of the cell (Clarke Reference Clarke, Rothschild and Lister2003). Examples of physiologically important physical features governed by temperature include the viscosity, density, pH, and dielectric permittivity of water, as well as its capacity to dissolve solutes and gases.
This pervasive influence of temperature sets a profound methodological challenge to any investigation of the effects of temperature on life. Because every aspect of the physical environment is affected by temperature, it is impossible to design a fully controlled experiment to explore the effects of temperature, where the only difference between the treatment and the control is a difference in temperature. For example, two aquatic animals exposed to different temperatures will also experience differences in viscosity, gas solubility and pH. Similarly two terrestrial plants exposed to different temperatures will also be subject to differences in relative humidity, gaseous diffusion rates and air density. This makes the interpretation of many experimental investigations of temperature challenging, and sometimes equivocal.
Definitions and principles
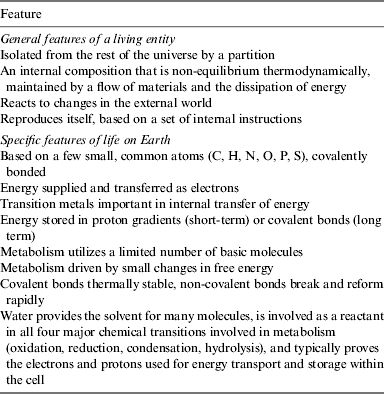
Life, like time, is an elusive concept that we feel we understand intuitively and yet find difficult to explain to others. But if we are to discuss life as a general concept, then we need to know exactly what we are talking about; the problem here is that philosophers and scientists have yet to produce a universally agreed definition of life (Benner Reference Benner2010). What we can do, however, is arrive at a working description of life on Earth. Table 1 provides one such description, emphasizing those aspects which are important in terms of understanding what sets the thermal limits to its continued existence.
Table 1. A working description of life on Earth

The first four items comprise the essential general features of life as we know it on Earth, and may be characterized as a containment, metabolism and programme (CMP) description of life (Bedau Reference Bedau2010). It implies constraints on the physical size of a living entity, which cannot be too small (to avoid fatal stochastic imbalances in the internal environment) or too large (such that internal integration becomes compromised).
Almost all discussions of the nature of life refer back to Erwin Schrödinger's classic short book What is life? (Schrödinger Reference Schrödinger1944) in which he emphasized the role of free energy and entropy in maintaining the viability of living organisms and explored the nature of the chemistry underpinning the coding of genetic information. At that time the precise chemical nature of the genetic material was unknown, and was widely believed to be protein. It was only later that it was shown to be nucleic acid (Avery et al. Reference Avery, MacLeod and McCarty1944), and the nature both of the code and its manner of replication recognized with the elucidation of the structure of DNA (Watson & Crick Reference Watson and Crick1953).
Although prescient in his analysis of the thermodynamic aspects of life, Schrödinger confounded the two important features of heredity, namely the code itself and the translation and execution of that code. Von Neumann corrected this error in his consideration of the theory of automata (von Neumann Reference von Neumann and Jeffress1951, Reference von Neumann and Arthur1966), emphasizing that the genetic material must both be copied, so that its integrity is preserved, and translated (that is, interpreted). Von Neumann's analysis thus recognized the critical distinction between what we would now call software (the coded instructions embodied in nucleic acids) and hardware (the protein machinery produced by translating and interpreting that software).
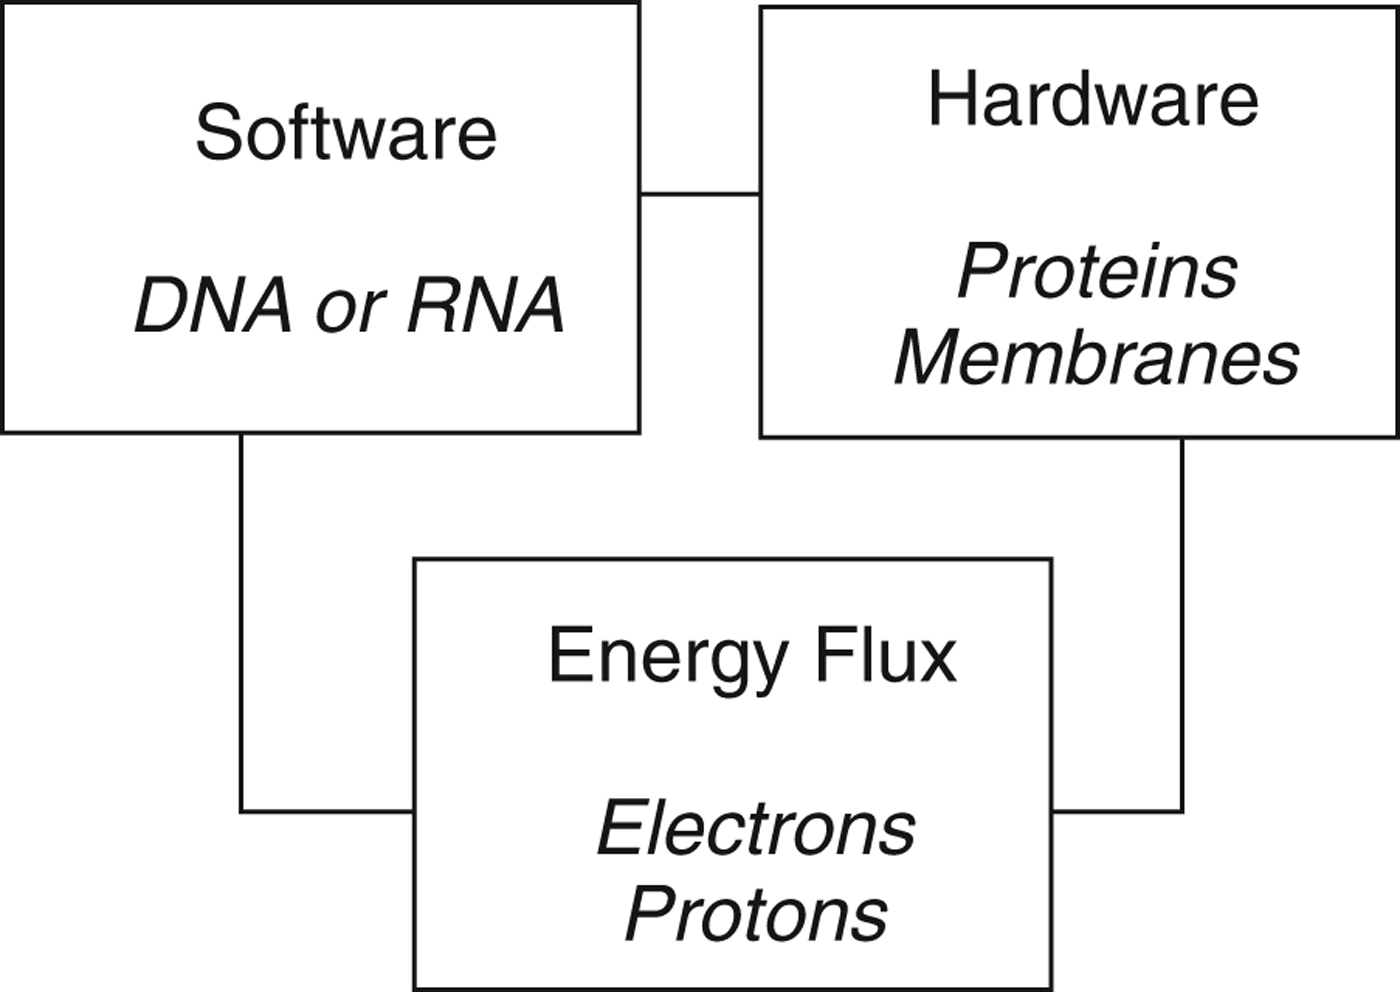
Taking these insights together suggests a tripartite description of life (Fig. 1). A living entity on Earth comprises three essential features: the genetic information encoded in nucleic acids (software), the structural elements of the cell in the protein and lipid architecture, and the protein functional elements (hardware), and energy flux. This last dynamic element is required by thermodynamics: the interior of the cell is maintained in a thermodynamically non-equilibrium state and for this locally low entropy environment to be maintained there must be a continuous dissipation of energy. Without this, the internal composition of the cell cannot be maintained, the organism dies and free energy is then dissipated as its internal composition decays to the equilibrium state.

Fig. 1. A tripartite description of life on Earth, based on Schrödinger (1944) and von Neumann (Reference von Neumann and Jeffress1951, Reference von Neumann and Arthur1966). All three components are necessary, but not sufficient: thermodynamic considerations dictate that for a living entity to perpetuate it must also replicate.
Some authors have used such thermodynamic considerations as the basis of a definition of life (e.g. Lovelock Reference Lovelock1965). Such definitions, however, also apply to systems that generate order through the dissipation of energy but which we would not regard intuitively as alive.
An organism is alive only if it exhibits all three of the features shown in Fig. 1. A virus has only software: it contains the genetic instructions for the construction of new viruses, but lacks the machinery to do this and exhibits no energy flow. Viruses are obligate parasites of cells, which they utilize for both the machinery of construction and the energy flux to drive that construction. Based on the description of life in Table 1 and Fig. 1, viruses are not alive.
A resting spore, such as those of bacteria, fungi, eukaryotic algae or the brine-shrimp Artemia salina contains both the software (DNA) and the hardware (proteins, membranes), but exhibits no energy flux. Like many plant seeds, tardigrade tuns or dehydrated nematodes, Artemia spores have the potential (or capacity) to be alive when circumstances change, but they are not alive in themselves. This context dependence of the living state sets an interesting challenge for those wrestling with the definition of life.
A living entity thus has software, hardware and exhibits energy flux (metabolism). While necessary, however, these are not sufficient. Thermodynamic considerations dictate that no living entity can perpetuate itself forever (Bains Reference Bainsin press), and the fourth essential component of life is thus reproduction. This reflects a second key distinction identified by von Neumann (Reference von Neumann and Jeffress1951, Reference von Neumann and Arthur1966), namely that between metabolism and replication. All living entities on Earth reproduce themselves; for a bacterium or archaean this means cell division to produce daughter cells, for a sexually reproducing eukaryote it means completion of the cycle from zygote to zygote.
Given that the copying of the internal instructions in DNA will always be imperfect, and in a resource-limited world not all offspring will survive, evolutionary change is inevitable. Evolutionary change starts with variation in the genetic material, but also requires that this variation results in changes in organism performance (fitness), and that the changes in the genetic material are heritable. A subtle but important feature here is that the basis of the description of life on Earth in Table 1 is the individual entity, and an individual organism does not evolve. Neither does a change in genetic makeup between parent and offspring constitute evolution. Evolution is the change in the frequency of genes in a defined group of individuals over time: it is a feature of populations, not of individuals. Darwinian evolution is thus a population consequence of the general features of life, rather than a defining characteristic of an individual entity (as proposed in the NASA definition of life: Luisi Reference Luisi1998).
Temperature thresholds
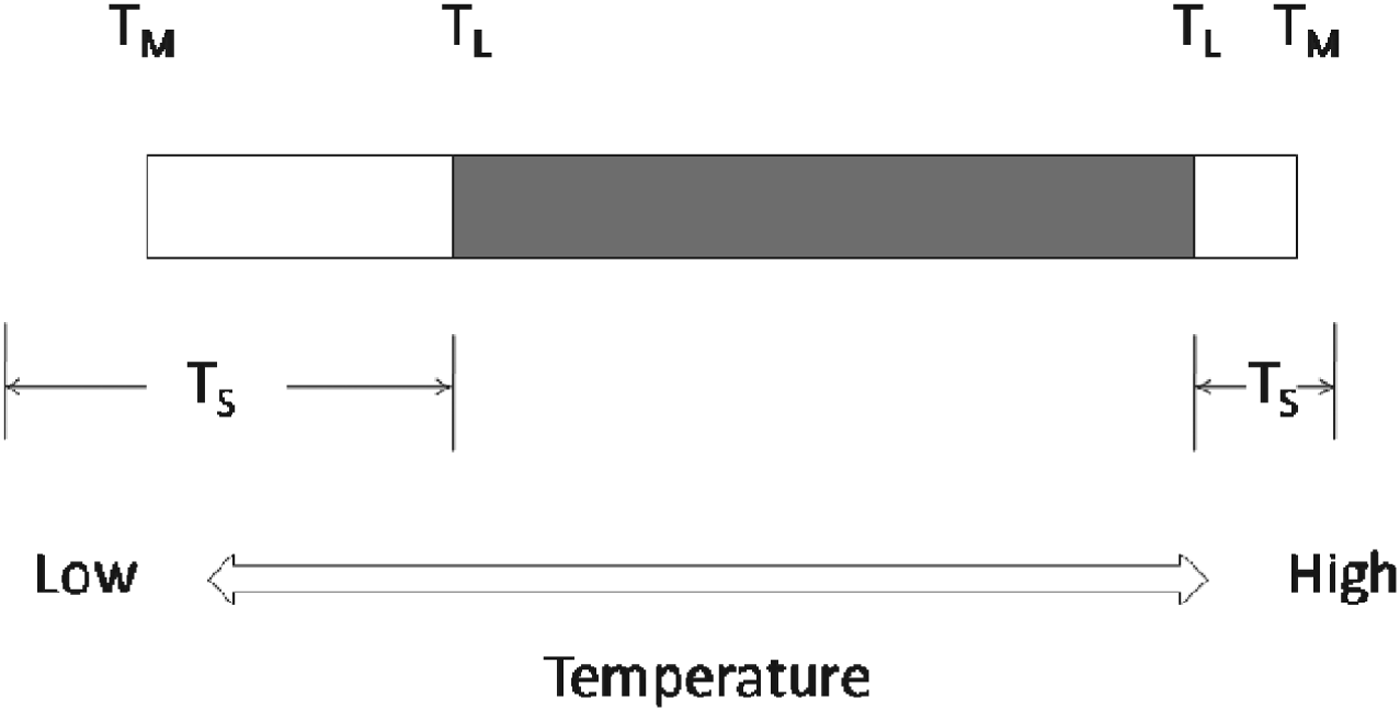
In relation to life on Earth, we can therefore draw an important distinction between two different threshold temperatures: a threshold for completion of the life cycle, T L, and a threshold for metabolism, T M (Fig. 2). Between T L and T M, the organism is viable and metabolizing, but unable to complete its life cycle. This might be because of insufficient energy to produce gametes, or initiate cell division, or it might be caused by a temperature-related failure of a key physiological process involved in reproduction but which is not in itself lethal.

Fig. 2. Temperature thresholds for life on Earth. T L: thermal limits for completion of the life cycle; T M: thermal limits for metabolism; T S: thermal limits for survival. The shaded portion shows the temperature range over which the life cycle can be completed, and defines the thermal limits for the continued existence of a species over generations. Modified from Clarke et al. (Reference Clarke, Morris, Fonseca, Murray, Acton and Price2013).
A third important threshold is that for survival, T S. This does not exhibit a consistent relationship with T L or T M; for example the lower T S may be at T L, at T M or below T M. Thus in a chilling-sensitive organism, where a critical physiological system fails at a relatively high temperature, and T S, T L and T M may even coincide. By contrast, in a cold-hardy organism, T S may be below T M. Between T M and T S the organism is in a state of suspended animation, but can resume metabolism once the temperature increases and recrosses the T M threshold. An important difference between high- and low-temperature limits for life is that at high temperatures T S is always reached; in contrast at low temperatures an organism may never reach its T S, even when taken close to absolute zero (Morowitz Reference Morowitz1968).
The upper and lower T L thresholds thus mark the limits to life on Earth, as existence outside these boundaries does not allow for completion of the life cycle. The T L thresholds are those which define a habitat capable of sustaining life, and are thus the temperature thresholds of most significance to astrobiology. While studies of extremophile microbes have tended to concentrate on establishing T L by determining the thermal limits to cell division, studies of plants and animals have tended to concentrate on limits to survival (T S). Coupled with the highly variable thermal environment on land, this makes determination of T L in these organisms very difficult, but in terms of defining the thermal thresholds for life, it is T L we need to know.
Domains of life
Living organisms on Earth range in size and complexity from bacteria and small mycoplasma to whales and redwoods. These organisms show a wide range of internal structure and, in the case of multicellular organisms, tissue architecture. We should therefore not expect them all to respond to temperature in the same way, and indeed they do not. However, life on Earth can be grouped into a relatively small number of functional groups, based on their response to temperature (Table 2).
Table 2. The three major domains of life on Earth, with Eukarya subdivided into categories with differing features of potential importance to their thermal ecology

Temperature extremes on earth
An important context for understanding the thermal limits to life on Earth is set by the range of temperatures available. If we find habitats with liquid water but no life, then we can conclude that these habitats may exceed the temperature limits for life. If on the other hand, we find life everywhere we cannot say whether other, more extreme, environments might harbour life; we may not have sampled the full range of temperatures to which life could adapt.
Life evolved in the sea, and the emergence of first plants and then animals onto the land was one of the most important steps in the evolution of life on Earth. The thermal challenges of land and sea are, however, very different, and the two realms therefore need to be considered separately.
The mean surface temperature of the Earth over the period 1980–2013 was 14.4 °C (data from the Reanalysis Project of the European Centre for Medium-Range Weather Forecasts), but there is much variation with latitude, altitude and season. In addition, the data show an overall increase in mean global temperature from 14.1 °C in the early 1980s to 14.5 °C in 2012. The lowest air temperature yet measured at the surface of the Earth is −89.2 °C, recorded at Vostok Station, Antarctica on 21 July 1983 (Bodetsky Reference Bodetsky1984). The lowest mean monthly temperature for Vostok is −65 °C (August), indicating that this was a truly unusual event. Turner et al. (Reference Turner2009) discuss the atmospheric conditions leading to this record low, and speculate that at nearby Dome A similar circumstances could lead to surface air temperatures as low as −100 °C.
Vostok and Dome A are deep in the interior of Antarctica. There is no native biota at either site, though this is likely the result of the isolation and the lack of habitat rather than temperature per se. It is possible that the biota of isolated nunataks (mountain peaks exposed above the ice plateau) in continental Antarctica experience temperatures similar to those of continental locations such as Vostok, but as yet the data are lacking. The lowest temperature for a location with native flora and fauna is −67.7 °C, recorded for two locations in the Sakha (Yakutia) Republic of Russia: Verkhoyansk on 5 and 7 Feb 1892, and at Oymyakon on 6 Feb 1933. Earlier records of −69.8 °C and −68.8 °C at Verkhoyansk in 1892 are now regarded as unreliable. The daily mean temperatures for January are −45.5 °C (Verkhoyansk) and −46.4 °C (Oymyakon) (all data from the World Meteorological Association).
The interior of Alaska also gets very cold in winter and here the record low is −62.2 °C recorded at Prospect Creek on 23 Jan 1971 (data from NOAA). This is only just above the record low for North America, which is −63.4 °C recorded at Snag airport, Yukon, on 3 Feb 1947. The interior of continental North America also gets very cold in winter, and there are record low temperatures below −50 °C recorded for many states such as Montana, Utah, Wyoming and Colorado.
The highest surface air temperature ever recorded is 56.7 °C, measured at Furnace Creek Ranch (formerly Greenland Ranch), Death Valley, California on 10 July 1913, a previous record of 58 °C from El Azizia, Libya, now being regarded as unreliable (El Fadli et al. Reference El Fadli2013).
These are, of course, meteorological air temperatures taken at 1.5 m above the ground surface. While these temperatures are relevant for familiar animals and plants, many organisms are small or very small, and live on or very close to the ground surface. Here temperatures can be very different, and satellite observations indicate that surface temperatures frequently exceed 50 °C. Surface temperatures reflect heating of the ground by solar radiation and the highest temperatures will occur where skies are clear, the soils are dry and winds are light. The hottest surface temperatures on Earth determined by remote sensing are regularly recorded from the Lut Desert in Iran, where in 2005 a record of 70.7 °C was achieved (data from NASA MODIS satellite).
The oceans are the largest habitat on the face of the Earth. The overall range of temperatures is much narrower than for terrestrial habitats and the high thermal capacity of water means that rates of change, both across space and in time, are much slower than in air. Surface oceanic waters vary in temperature with depth, latitude and season. The enormous size of the oceans, coupled with their great depth, make it difficult to calculate an overall temperature for seawater. Below the seasonally warmed and cooled surface layers, seawater remains permanently between −1 and +4 °C, except for the deep Mediterranean and Red Sea and the immediate environs of hydothermal vents (Gage & Tyler Reference Gage and Tyler1991). Overall, the mean temperature of oceanic water is <4 °C; the largest habitat on the face of the Earth is cold.
Surface oceanic waters can reach ∼30 °C in tropical regions and −1.96 °C (the freezing point of seawater at atmospheric pressure) in high latitudes. In waters close to the Antarctic continent, bottom temperatures can be ∼−2 °C year-round (Clarke et al. Reference Clarke, Griffiths, Barnes, Meredith and Grant2009).
High-temperature limits to life
The earliest record of life in hot springs appears to be that of Pliny the Elder, who noted in his Natural History (probably written around 77–79 AD) that green plants could be found growing in the hot springs at Padua. These springs are still active, and undeveloped sections contain cyanobacterial mats (which are presumably the ‘green plants’ recorded by Pliny) (Brock Reference Brock1978).
There are many places on Earth where geothermally heated water reaches the surface, including Iceland, New Zealand, Kamchatka and the hydrothermal vent fields associated with the spreading ridge systems of the deep ocean. However, the basis of our understanding of microbial life at high temperatures stems from the pioneering work of Thomas Brock and colleagues in Yellowstone Park (Brock Reference Brock1978). The value of Yellowstone as a location for this work is the existence of a large number geothermal springs with a wide range of temperatures, pH and mineral contents. Although Brock himself ceased working in there in 1975, Yellowstone continues to provide important insights into thermal physiology and ecology. Brock first reported microbes growing at high temperatures in the 1960s (Brock & Brock Reference Brock and Brock1966; Brock Reference Brock1967). Shortly afterwards together with a colleague Hudson Freeze he isolated a bacterium growing at 70 °C which they described as Thermus aquaticus (Brock & Freeze Reference Brock and Freeze1969). This organism has proved to be of enormous significance as the source of the DNA polymerase which underpins the genomic revolution. Based on his experiences of life in hot springs in Yellowstone and elsewhere, Brock (Reference Brock1978) predicted that life would be found wherever water was liquid, a prediction that was vindicated spectacularly by the discovery of microbial life at very high temperatures and pressures associated with hydrothermal vents in the 1970s.
The very hot water, often at temperatures >300 °C, that emerges from hydrothermal vents mixes with the local seawater and this leads to very strong thermal gradients. The very hottest waters appear to be abiotic, but areas where the water has cooled are characterized by extensive microbial mats. These have yielded a wide range of hyperthermophiles, both archaeans and bacteria. Hyperthermophiles are defined as organisms with an optimal growth temperature at or above 80 °C. They require liquid water so growth above 100 °C is possible only where pressure keeps water liquid. They are found in a wide variety of terrestrial and marine habitats, all associated with geothermal sources of heat. The low solubility of oxygen at these high temperatures and the frequent presence of large amounts of reducing gasses mean that most habitats for hyperthermophiles are anaerobic. Most hyperthermophiles utilize inorganic redox reactions as the sources of energy, and CO2 as the sole carbon source.
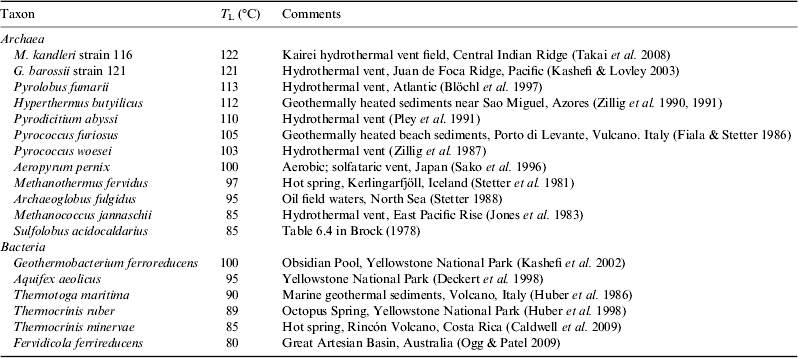
The current record for a high-temperature growth is Methanopyrus kandleri, originally isolated from a vent in the Gulf of California and found to grow between 84 and 110 °C (Huber et al. Reference Huber, Kurr, Jannasch and Stetter1989; Kurr et al. Reference Kurr, Huber, König, Jannasch, Fricke, Kristjansson and Stetter1991). However a strain of M. kandleri isolated subsequently from the Kairei vent field on the Central Indian Ridge was found to grow at 122 °C under 40 MPa pressure (Takai et al. Reference Takai, Nakamura, Toki, Tsunogai, Miyazaki, Miyazaki, Hirayama, Makagawa, Nunoura and Horikoshi2008), just surpassing the previous record for 121 °C for Geogemma barossii strain 121 (Kashefi & Lovley Reference Kashefi and Lovley2003).
Microbes growing at the very highest growth temperatures all appear to be archaeans, but there are some bacteria are able to grow to ∼100 °C, with the current record being Geothermobacterium ferrireducens, which was isolated from Obsidian Pool in Yellowstone National Park (Kashefi et al. Reference Kashefi, Holmes, Reysenbach and Lovley2002). Two other taxa, Aquifex aeolicus and Thermotoga maritima can grow at 90 °C or above (Table 3), and there are a range of Fe(III)-reducing thermophilic bacteria with T L values in the range 65–75 °C (Sokolova et al. Reference Sokolova, Hanel, Onyenwoke, Reysenbach, Banta, Geyer, Gonzáles, Whitman and Wiegel2006). This difference between archaea and bacteria in sensitivity to high temperatures is evident in the distribution of the two groups within active vents, where there can be a transition from a mixed assemblage of archaea and bacteria near the cooler exterior of the chimney, to primarily archaea in the hotter interior (Schrenk et al. Reference Schrenk, Kelley, Delaney and Baross2003).
Table 3. Some representative thermophilic Archaea and Bacteria that define the upper thermal limit to life on Earth. Hyperthermophiles are a subset of thermophilic extremophiles, defined by having an optimal temperature for growth above 80 °C

The water issuing from hydrothermal vents can exceed 300 °C, and with the surrounding seawater at less than 4 °C this leads to very steep and highly variable thermal gradients that make it extremely difficult to quantify the precise thermal environment of the microbes growing there. Schrenk et al. (Reference Schrenk, Kelley, Delaney and Baross2003) reported intact microbes growing in water ‘that must have been well in excess of 100 °C’ but the only reliable technique to establish unequivocal growth temperatures is culture in vitro. Baross et al. (Reference Baross, Lilley and Gordon1982) sampled the microbial flora from hydrothermal vents along the East Pacific Rise, where vent fluids had temperatures of >300 °C. Baross & Deming (Reference Baross and Deming1983) and Deming (Reference Deming1986) reported growth of these microbes in culture at 250 atm (26.85 MPa) pressure and temperatures of 250 °C, with evidence for the utilization of inorganic C and N and the production of methane. These studies raised the upper thermal limit for hyperthermophiles by a staggering 140 K, and initiated an intense debate centred on the possibility of artefacts or contamination (Trent et al. Reference Trent, Chastain and Yayanos1984), and the instability of many biological molecules at such high temperatures (Bernhardt et al. Reference Bernhardt, Lüdemann, Jaenicke, König and Stetter1984; White Reference White1984; Lang Reference Lang1986). To date these results have not been replicated, and while Wharton (Reference Wharton2002) has speculated that the actual thermal limit for microbial growth may be as high as 150 °C, the currently accepted upper limit for microbial growth is 122 °C.
Temperature and microbial diversity
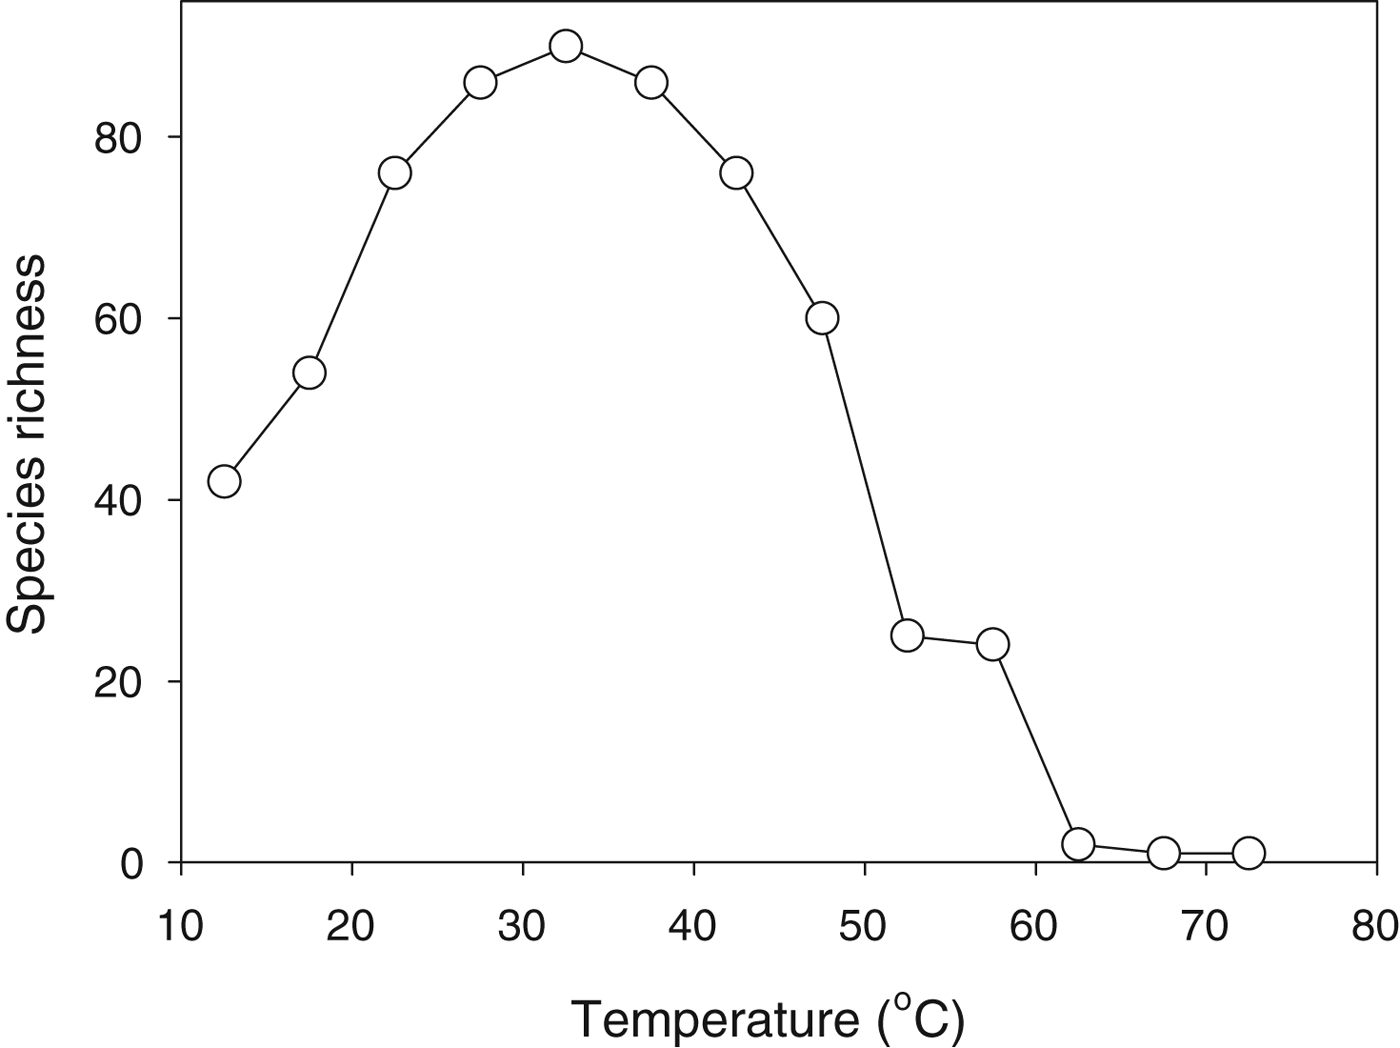
The diversity of microbial taxa that can exist in geothermally heated waters declines with increasing water temperature and the very highest temperatures support only a small number of extremophile taxa (Fig. 3). At first glance this pattern might seem entirely sensible: as the environment gets tougher fewer species can live there. Indeed we often make a subjective assessment of the harshness of an environment on the basis of how many (or how few) types of organism live there. This reasoning is, of course, inherently circular: we explain the paucity of organisms on the basis of the harshness of the environment, but we also assess the harshness of an environment from the number of types of organism that live there.

Fig. 3. Species richness (number of species) of cyanobacteria as a function of water temperature across a range of geothermally heated pools in Yellowstone National Park. Replotted from data in Brock (Reference Brock1978).
While a correlation between environmental harshness and diversity of life might seem intuitively reasonable, it was challenged memorably by the ecologist Evelyn Hutchinson. In a classic short paper (Hutchinson Reference Hutchinson1959), he posed the question of why, if one species can adapt to a particular environment, cannot more do so? The question was actually posed in terms of plants adapting to a cold Arctic environment, but it is equally pertinent to cyanobacteria in hot springs. We do not yet have a fully satisfactory answer to this deceptively simple question.
Eukaryotes at high temperature
Eukaryotes appear not to be able to live at the very highest temperatures that characterize geothermal water. The highest T L for a unicellular eukaryote appears to 55–56 °C, which is the upper limit for the rhodophyte Cyanidium caldarium, although optimal (maximum) growth was at 45 °C (Doemel & Brock Reference Doemel and Brock1970, Reference Doemel and Brock1971). Over a century ago, however, Dallinger (Reference Dallinger1887) reported an experiment in which he raised the temperature of a culture of ‘monads’ (unicellular flagellates, including Tetramitus rostratus, Monas dallingeri and Dallingera drysdali), inspecting the cultures for morphology (especially the presence of vacuoles), activity, fission and sexual fusion after each rise in temperature. Over the course of 7 years (the experiment ran from 1880 to 1886, allowing the cultures to acclimate after each small increment in temperature) Dallinger reported that the flagellates were still active and reproducing at 70 °C. This intriguing experiment needs repeating with replication, modern means of temperature control and documentation of growth from cell counts, as it may well establish a new thermal maximum for growth in unicellular eukaryotes.
Slightly higher temperatures appear to be tolerated by filamentous fungi, and a survey of a range of high-temperature habitats revealed species able to grow at 55–60 °C (Tansey & Brock Reference Tansey and Brock1972). Both unicellular algae and fungi can produce resting stages (spores) when environmental conditions become unfavourable. The upper thermal limit for survival of these spores is unclear, though resistance up to 115 °C has been reported in spores of saprotrophic fungi in the Western Ghats of Southern India (Suryanarayanan et al. Reference Suryanarayanan, Govindarajulu, Thirumalai, Reddy and Money2011). This extreme thermotolerance may be an adaptation to surviving the dry season wildfires that characterize the Western Ghats; the growing fungi themselves are mesophilic.
Higher plants can be found growing close to hot springs in Yellowstone, and in the perennial grass Dichanthelium lanuginosum (intriguingly named ‘hot springs panic grass’) the thermal tolerance is mediated through a mutualistic endophytic fungus Curvularia protuberata (Redman et al. Reference Redman, Sheehan, Stout, Rodriguez and Henson2002) and a mycovirus (Márquez et al. Reference Márquez, Redman, Rodriguez and Roosinck2007). With both the fungus and mycovirus present, plants can grow in soils up to 65 °C; with either missing the plants are unable to grow above 38 °C (Márquez et al. Reference Márquez, Redman, Rodriguez and Roosinck2007).
Hot springs also provide the hottest habitats inhabited by invertebrates and vertebrates. Temperature in these springs may reach over 50 °C, and the fauna includes crustaceans, chironomid larvae, nematodes and molluscs, as well as fish. It is difficult to establish T L values for these; although many secondary and anecdotal sources quote a range of temperatures for hot springs, there are very few primary sources with data for both temperature and fauna. Two nematodes, Rhabditis terrestris and Udonchus tenuicaudatus, appear to be ubiquitous in thermal springs and have been recorded as living up to 42.8 °C in Granada, Spain (Ocaña Reference Ocaña1991), Wharton (Reference Wharton2002) records Aphelenchoides parientus living in hot springs up to 51 °C, and Darylaimus thermus is found in Yellowstone in waters up to 53 °C (Hoeppli Reference Hoeppli1926; Hoeppli & Chu Reference Hoeppli and Chu1932). Hot springs contain a range of other aquatic invertebrates, including crustaceans such as the isopod Thermosphaeroma subequalum, insect larvae (especially chironomids), and molluscs such as the springsnail Tryonia julimensis; all of these will have similar T L values. The highest temperature for completion of the life cycle in an invertebrate may be for nematodes of the genus Aphelenchoides and Panagrolaimus, which tolerate temperatures of 60 °C in compost heaps (Steel et al. Reference Steel, Verdoodt, Čerevková, Couvreur, Fonderie, Moens and Bert2013).
Hot springs also support populations of fish, and the classic high-temperature fish are the desert pupfish of the genus Cyprinodon. These fish live in shallow geothermal springs, where the temperatures are high but vary both spatially and throughout the day and with season. Cyprinodon pachycephalus from the hot springs of San Diego de Alcalá, Chihuahua, México lives in waters of 39.2–43.8 °C (Minckley & Minckley Reference Minckley and Minckley1986; Miller et al. Reference Miller, Minckley and Norris2005), and Cyprinodon julimes recently described from the hot springs of Julimes, Chihuahua, México lives at temperatures of between 38 and 46 °C (Montejano & Absalόn Reference Montejano and Absalón2009). In contrast to terrestrial vertebrates which can use shade to avoid the heat of the sun, and which cool off by night, desert pupfish spend their entire life at these high temperatures. While the water temperatures do vary a little diurnally and the fish often select the cooler water (Montejano & Absalόn Reference Montejano and Absalón2009), these two species of Cyprinodon are believed to be the fish with the highest T L on Earth. They also limited to a few small springs and pools and are consequently highly endangered.
The hottest marine environments are hydrothermal vents, and these have a spectacularly rich and abundant fauna that includes a range of crustaceans, molluscs and worms (Van Dover Reference Van Dover2000). As with the microbial flora within the vent chimneys, the very steep thermal gradients make it difficult to assess precisely what temperatures any given animal is experiencing. Behavioural observations and associated temperature measurements suggest that many motile vent animals select warm but not hot locations, and that they are very sensitive to changes in temperatures.
The most studied vent animal in this regard is the Pompeii worm, Alvinella pompeiana. This polychaete lives in a tube through which vent fluids pass, and from which it emerges to forage. Recordings with a temperature probe indicated that at the base of the tube the temperatures can reach 81 °C, and that the base of the worm itself the temperature averaged 61 °C, although occasionally spikes up to 81 °C were recorded. At the mouth of the tube temperatures averaged 22 °C (Cary et al. Reference Cary, Shank and Stein1998). These data indicate that Alvinella is subject to a quite remarkable thermal gradient along its body (roughly 60 K). However, it is difficult to assess its T L, both because of this gradient but also because the worm leaves its tube to forage in much cooler water (2 °C: Lutz Reference Lutz and Bell2012). Indeed studies of individual proteins indicate quite low thermal denaturation temperatures: ∼50 °C for haemoglobin and ATP generation by isolated mitochondria, and ∼45 °C for collagen. These data would indicate that in the long term, Alvinella is limited to temperatures below ∼50 °C (Desbruyères & Laubier Reference Desbruyères and Laubier1991). A recent study (Ravaux et al. Reference Ravaux, Hamel, Zbinden, Tasiemski, Boutet, Léger, Tanguy, Jollivet and Shillito2013) has shown that long-term survival, as assessed by a 2 h ramped thermal exposure, is above 42 °C but below 50 °C. Similarly, another vent polychaete Paralvinella sulfinicola, can be found in waters up to 88 °C, but has an upper incipient lethal temperature (at which 50% of the population cannot survive indefinitely) of only 45 °C (Dilly et al. Reference Dilly, Young, Lane, Pangilinan and Girguis2012). Although the actual T L values for Alvinella or Paralvinella are unknown, current data suggest that they may hold the record T L for an aquatic animal, and are also probably some of the most eurythermal metazoans on the planet (Lutz Reference Lutz and Bell2012).
Away from geothermal areas, the hottest terrestrial environments are deserts and directly measured surface temperatures in places can reach 75–80 °C (Ward & Seeley Reference Ward and Seeley1966). Deserts are, however, often only hot during the day; by night and under a clear sky temperatures can drop below freezing (Ward Reference Ward2009).
This combination of high daytime temperatures and low night-time temperatures poses severe physiological problems for organisms living in deserts. Some motile forms are active by day and can tolerate brief periods of very high temperatures. For example, the Saharan silver ant Cataglyphis bombycina forages for very short periods in air temperatures up to 55 °C (Wehner et al. Reference Wehner, Marsh and Wehner1992). Similarly, Ocymyrmex barbiger, an ant from the Namib Desert, forages in air temperatures up to 67 °C (Marsh Reference Marsh1985), and the pseudoscorpion Eremogarypus perfectus only goes into heat coma at 65 °C (Heurtault & Vannier Reference Heurtault and Vannier1990). Being small, these ants have a very low thermal mass, and in consequence they heat up and cool down quickly. These, and other small arthropods active in the desert heat thus minimize the period of time for which they are exposed to the highest temperatures, and they climb frequently up stems of vegetation where the air is cooler.
Not all desert animals are so active and able to use behavioural means to minimize their exposure to the heat of the sun. Some such as land snails simply have to sit it out. The desert snail Sphicterochila boisseri minimizes its body temperatures by having a highly reflective shell, which allows it to maintain a tissue temperature of 50 °C in direct sunlight despite a local air temperature of 43 °C and a surface temperature of 65 °C (Schmidt-Nielsen et al. Reference Schmidt-Nielsen, Taylor and Shkolnik1971). A significant physiological problem for organisms that cannot move underground to avoid temperature extremes is that gas exchange inevitably also results in water loss. Many arthropods minimize this water loss by restricting the periods of tracheal respiration (an adaptation referred to as discontinuous gas exchange). While these examples indicate that many desert invertebrates can tolerate very high temperatures, at least for short periods, they cool down by night and it is not clear what is the highest temperature at which any of these organisms can complete their life-cycles.
Desert plants must be able to withstand the same temperatures as the animals, but without the ability to move about to alleviate the direct effects of heat. One must assume that some plants living in the hottest deserts have thermal tolerances at least comparable with those living around geothermal springs, but data on the maximum temperatures at which plants can complete their life cycle are very difficult to find.
Plants exposed to direct solar heating can reach temperatures well above that of the surrounding air. Fleshy leaves can reach internal temperatures of 40–50 °C when the surrounding air is only 20–30 °C, and the cambium of the sunny side of some trees may reach 55 °C (Öpik & Rolfe Reference Öpik and Rolfe2005). The record appears to be held by the cactus Opuntia, several species of which can reach internal temperatures up to 65 °C (Smith et al. Reference Smith, Didden-Zopfy and Nobel1984).
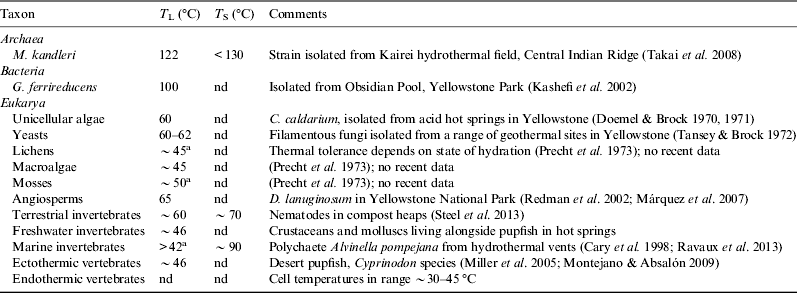
Current knowledge of the upper thermal limits to life is summarized in Table 4. Although there is a diverse literature on thermal limits to survival (T S), data on the thermal limits to the completion of the life cycle (T L) are far more difficult to obtain, and for some groups the data in Table 4 rely principally on the data collated over 40 years ago by Precht et al. (Reference Precht, Christophersen, Hensel and Larcher1973).
Table 4. High-temperature limits for life on Earth

nd: no data.
a Unclear whether the entire life cycle is completed at this temperature.
What sets upper thermal limits?
The main physiological challenge from increased temperature comes in the form of greater thermal motion. In particular, the enhanced internal molecular motions increase the likelihood of thermal denaturation, in that the molecule may move to a conformation that is neither functional nor allowing return to a functional state.
The higher level structure of cellular macromolecules and the association between molecules critical to physiological processes are all dependent on weak bonds, such as Van der Walls interactions, hydrogen bonds, electrostatic (ionic) bonds and hydrophobic interactions. These all have low enthalpies of formation, typically in the range <4 kJ mol−1 (Van der Waals) to 10–30 kJ mol−1 (hydrogen bonds) and <40 kJ mol−1 (hydrophobic interactions). These values are of the same order of magnitude as the mean thermal energy of molecules at 25 °C, and hence are likely to break more frequently at higher temperatures.
The most common adaptations to allow macromolecules to function at high temperatures include changes in the number of residues influencing overall hydrophobicity, and an increase in the number of weak interactions to increase stability. These adaptations result in homologous enzymes having similar flexibility, and hence similar metabolic activity, at the optimal growth temperature (Tehei & Zaccai Reference Tehei and Zaccai2007). Whilst some proteins that are stable to ∼140 °C can be isolated from hyperthermophiles, not all proteins appear to be sufficiently stable to retain their structure, and hence function, at very high temperatures (Lang Reference Lang1986; Committee on the Origins and Evolution of Life 2007). In these, structural integrity is associated with the presence of large molecular chaperones and a range of small compatible solutes (Sterner & Liebl Reference Sterner and Liebl2001).
The thermostability of nucleic acids has been linked to the content of guanine and cytosine, which, having three hydrogen bonds, are thermally more stable than the pairing of adenine and thymine, which have only two. However, there is no correlation between genome GC content and growth temperatures (Hurst & Merchant Reference Hurst and Merchant2001; Hickey & Singer Reference Hickey and Singer2004). There is a correlation in structural RNAs although this is limited to the double-stranded stem regions of the molecules (Galtier & Lobry Reference Galtier and Lobry1997).
Much attention has been directed at the unique membrane architecture of archaea in respect of the ability of some taxa to live at very high temperatures. Archaeal membranes consist of isoprenoid hydrocarbon chains, which are attached to the glycerol moiety by an ether link. Furthermore, the glycerol moiety has a different stereochemistry from that in bacteria and eukaryotes, and in some archaeans the isoprenoid chains are fused to form a single layer (as distinct from the bilayer that is found in all other organisms). While this unique membrane architecture is found in hyperthermophilic archaeans, it is also found in archaea that live at low temperatures, which suggests that it may not necessarily be an adaptation to high temperature but simply a feature of archaeans in general. Its greater stability at high temperatures does, however, allow archaea to live at higher temperatures than bacteria or eukaryotes.
While an upper limit to the stability of biomolecules may be set by processes such as hydrolysis, it is not yet clear whether the upper limit for survival of an organism is set by the fate of individual molecules or the intracellular structure. Hansen et al. (Reference Hansen, Criddle and Battley2009) used calorimetry to investigate denaturation of key physiological macromolecules at high temperature and showed that in both Escherichia coli and Lactobacilluis plantarum ribosomes denatured at lower temperatures than either DNA or cell walls.
We cannot necessarily generalize from these results and assume that upper thermal limits will be set by the same processes in all organisms. Indeed the difference in the upper thermal limits for Archaea, Bacteria and Eukarya (Table 4) suggests that different processes may set the limits for different domains. It is tempting to ascribe the markedly lower upper thermal limit for eukaryotes to the presence of a nucleus, but there are many other differences in internal cellular complexity that might be responsible for the greater sensitivity to high temperatures, and in truth we do not know the cause. In multicellular organisms, the requirement for integration between cells in tissues, and between tissues within the organism, introduces further possibilities for limiting thermal sensitivity. It also introduces the possibility of sublethal damage that limits physiological function, and hence maybe preventing completion of the life cycle, but without causing organism death.
The physiological challenge of low temperature
Cells at low temperatures must cope with the reduced molecular kinetic energy of the environment and the consequent lower rate of many physical processes. In addition, cells must adjust to reduced membrane fluidity, changes in intracellular pH and loss of macromolecular integrity (Hochachka & Somero Reference Hochachka and Somero2002). The molecular adaptations to maintain physiological function at low temperatures are in many cases simply the reverse of those involved in adaptation to high temperatures.
Additional challenges arise, however, when ice is present in the environment immediately external to the cell. Following ice nucleation, solutes are rejected from the growing ice crystal and are concentrated in the remaining liquid, which thus increases in osmotic strength and tends to pull water from inside the cell.
A critical distinction in considering how organisms react to the physiological challenge of ice nucleation is that between unicells and multicellular organisms (Table 2). In archaea, bacteria and unicellular eukaryotes, the cell membrane is exposed directly to the environment. Although a cell wall may be present, this has to be permeable to allow the cell to take up nutrients, and dump waste products. This means that when ice is present in the environment, the cell membrane will experience directly the associated changes in osmotic strength. In contrast, multicellular organisms have their internal cells and tissues bathed in a fluid over whose composition the organism can exert a degree of control. When ice is present in the external environment, the cells and tissues of a multicellular organism such as a plant, insect or frog are not necessarily exposed to that ice.
When ice is present in the immediate environment of the cell, that cell may be damaged through hydraulic stresses, osmotic changes or solute toxicity mechanisms. In addition, intracellular ice can form when the cooling rate is sufficiently high that the cell cannot maintain osmotic equilibrium with the environment (Mazur Reference Mazur, Fuller, Lane and Benson2004). Intracellular ice is observed only rarely in the natural environment (Wharton & Ferns Reference Wharton and Ferns1995). This is partly because the formation of intracellular ice generally requires faster cooling than is typical of the natural environment. For example in the yeast Saccharomyces cerevisiae intracellular ice formation requires cooling rates faster than 20 K min−1 (Seki et al. Reference Seki, Kleinhans and Mazur2009). Atmospheric cooling rates in the environment rarely exceed 1 K min−1 (Clarke et al. Reference Clarke, Morris, Fonseca, Murray, Acton and Price2013), but some specialized habitats such as rock or leaf surfaces can change temperature more rapidly (Strimbeck et al. Reference Strimbeck, Johnson and Vann1993). Freezing of extracellular fluids does, however, occur in some multicellular plants and animals living in seasonally cold climates (Schmid Reference Schmid1982; Leather et al. Reference Leather, Walters and Bale1993; Pearce Reference Pearce, Fuller, Lane and Benson2004).
At the slow cooling rates typical of the natural environment, cells can often maintain osmotic equilibrium with the surrounding fluid. Under these circumstances, free-living cells such as bacteria, archaeans or unicellular eukaryotes may vitrify. Vitrification (also known as the glass transition) occurs when a liquid begins to behave as a solid during cooling, but without any substantial change in molecular arrangement or thermodynamic state variables (pressure, volume, internal energy, entropy) (Wowk Reference Wowk2010). In bulk liquids, as temperature decreases, all molecular motions, translational and internal, become progressively slower until a critical temperature is reached where there is insufficient energy for significant translational molecular motion to take place over a meaningful timescale. This is the vitrification or glass transition temperature, Tg, and it is defined operationally as the temperature at which viscosity exceeds 1012 Pa.s (Debenedetti Reference Debenedetti1996).
Intracellular vitrification is more complex than in simple bulk liquids. This is principally because the interior of the cell is extremely crowded (Ellis Reference Ellis2001), approximating a colloid in physical structure. As colloids dehydrate they exhibit a sharp increase in viscosity and undergo a colloid glass transition (Zhou et al. Reference Zhou, Trepat, Park, Lenormand, Oliver, Mihailovich, Hardin, Weitz, Butler and Fredberg2009). Cellular dehydration, whether associated with a shift to anhydrobiosis or withdrawal of water driven by freeze concentration of the extracellular medium, can thus induce vitrification of the cell interior. The vitrification of the interior of a free-living microbial cell exposed to ice in the external environment is thus primarily the result of dehydration and is analogous to the vitrification of a colloid rather than the glass transition of bulk water.
The vitrification temperature of a cell will vary with the precise composition of the internal cell environment, and this may allow the intracellular vitrification temperature to be adjusted by natural selection to match ecological circumstances (for example by varying the level of small cryoprotectant molecules). In free-living unicells, dehydration driven by freeze-concentration of the external environment triggers vitrification at temperatures between −10 and −25 °C (Clarke et al. Reference Clarke, Morris, Fonseca, Murray, Acton and Price2013).
The very high viscosity of the vitrified cell means that movement of oxygen and metabolites effectively stops. Under these conditions, metabolism ceases. The cell does, however, maintain its internal integrity, and metabolism can start again once the cell warms and rehydrates. This process carries the danger that once water molecules can move within the cell, any small ice nuclei present may grow rapidly (a process usually termed devitrification) and the consequent mechanical damage may be lethal. The presence of chaperone proteins such as dehydrins or late embryogenesis abundant proteins (LEAs), as well as cryoprotectants such as polyols may be important in ensuring a safe transition from the vitrified to the normal state, though this is an area where more research is needed. LEAs were originally identified in plant seeds, but are now known to be fairly widespread (Hand et al. Reference Hand, Menze, Toner, Boswell and Moore2011). It is also possible that thermal hysteresis proteins (antifreeze proteins) may be important in minimizing the chances of lethal growth of intracellular ice (devitrification) during the return to the fluid state.
Low-temperature limits
A general lower limit for life in free-living unicells would appear to be set by the temperature at which freeze-concentration of the external environment dehydrates the cell interior and drives vitrification (Clarke et al. Reference Clarke, Morris, Fonseca, Murray, Acton and Price2013). While vitrification defines a lower limit for metabolism, it is possible that one or more other factor may limit completion of the life cycle at temperatures above which the cell vitrifies (that is T L is above T M, where T M corresponds to the vitrification temperature).
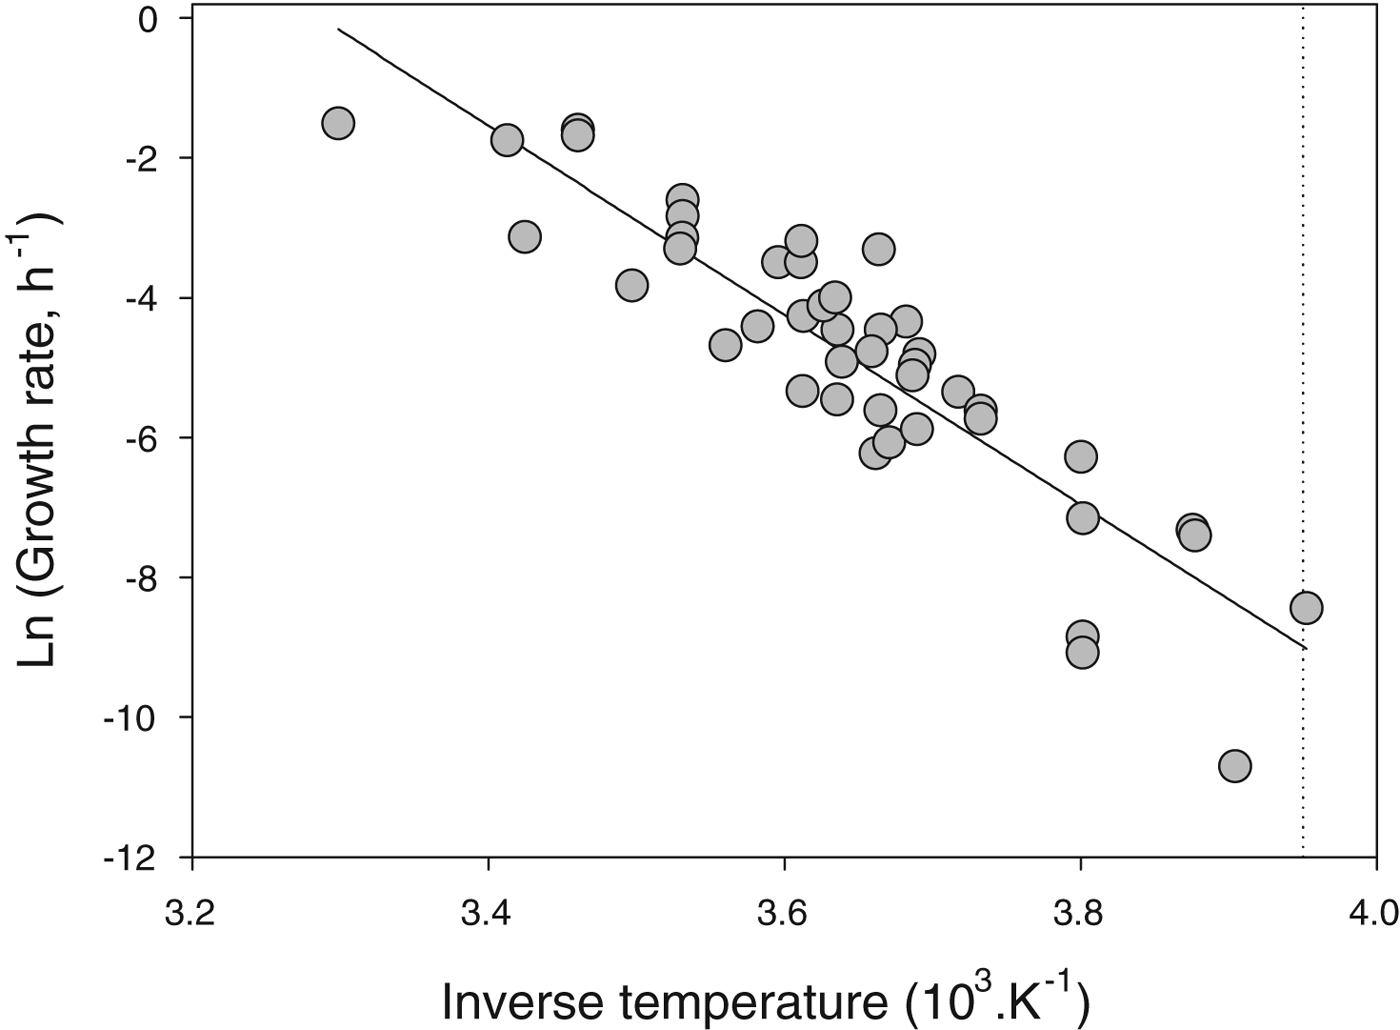
A thorough survey of studies of microbial growth at low temperatures suggests that none grow below −20 °C (Fig. 4). There are a few reports in the literature of microbial growth at temperatures below −20 °C but in these studies growth or metabolism are usually inferred from proxies (such as release of apparent metabolic products) and not direct measures of cell number as a function of time. It is possible that in these cases geochemical processes or concentrated solution chemistry is mimicking metabolism (see discussion in Clarke et al. Reference Clarke, Morris, Fonseca, Murray, Acton and Price2013). Indeed, despite a century of refrigeration technology, there are no reports of spoilage organisms growing below −20 °C (Geiges Reference Geiges1996). It is clear that the lower limit for completion of the life cycle in free-living unicells (bacteria, archaeans, unicellular eukaryotes) is around −20 °C.

Fig. 4. Specific growth rate (h−1) of microbes as a function of temperature. Data plotted as Arrhenius relationship (natural log of rate as a function of inverse thermodynamic temperature). The slope of the fitted line (ordinary least-squares regression), which captures the across-species relationship between growth rate and temperature, is −13.6 (note that the inverse temperature has been rescaled for presentational convenience). The dotted line shows the lower thermal limit for microbial growth known to date, which is −20 °C. Data replotted from Price & Sowers (Reference Price and Sowers2004).
The lower thermal limit for life in marine organisms is set by the lowest temperature at which seawater can remain liquid. For seawater of normal salinity (35), the equilibrium freezing point at atmospheric pressure is −1.92 °C, increasing with depth. Parts of the continental shelf seabed around Antarctica are close to the freezing point year-round (Clarke et al. Reference Clarke, Griffiths, Barnes, Meredith and Grant2009) and so the rich communities of marine invertebrates and fish that live there must complete their life cycles at this temperature (T L∼−2 °C).
Teleost fish have body fluids of lower osmotic strength than seawater, and would freeze at these temperatures. Polar teleosts avoid such freezing by the production of protein or glycoprotein antifreezes, together with a suite of associated anatomical and physiological adjustments (DeVries & Cheng Reference DeVries, Cheng, Somero, Osmond and Bolis1992). Different lineages of teleost fish use different molecules as antifreezes, indicating that antifreeze has evolved many times independently, suggesting that this is not a difficult evolutionary problem.
When sea-ice forms, salt is excluded from the growing ice. As a result sea-ice contains many channels filled with brine, and these can reach very low temperatures (∼−20 °C) without freezing. These channels contain diatoms and many other unicellular eukaryotes (Thomas Reference Thomas and Bell2012), as well as some invertebrates. It is possible that these assemblages contain taxa that can complete their life cycle at lower temperatures than in the surrounding seawater: for example the Arctic sea-ice diatom Nitzschia frigida can grow down to −8 °C, although the doubling time is very long (60 days) (Thomas Reference Thomas and Bell2012).
In terrestrial habitats, temperatures may fall very low in winter (see above). While some animals migrate to warmer climates, many others and all plants have to survive the winter in situ. Polar organisms have evolved two basic strategies to achieve this: they either prevent ice forming within their tissues and survive the winter in an undercooled state (freeze avoidance), or they allow extracellular water to freeze (freeze tolerance). In the latter case, cells are typically subject to dehydration driven by freeze-concentration of the extracellular water as it freezes; they then either undercool or vitrify.
It has long been known that fungal infections can affect crops under snow and Schmidt-Nielsen (Reference Schmidt-Nielsen1902) reported the growth of two unicellular yeasts at 0 °C. Pathogenic fungi are known from snow banks and also from cryoconite assemblages on the surface of glaciers, and mushrooms that emerge through snow in northern forests are well known (Hoshino et al. Reference Hoshino, Xiao, Yajima, Tkachenko and Yumoto2013). The lower thermal limit for completion of the life cycle in free-living fungi and yeasts remains unknown but appears to be about 0 °C, and while some moulds and rusts can grow at low water activities on refrigerated foods, none are known to grow below −20 °C (Geiges Reference Geiges1996).
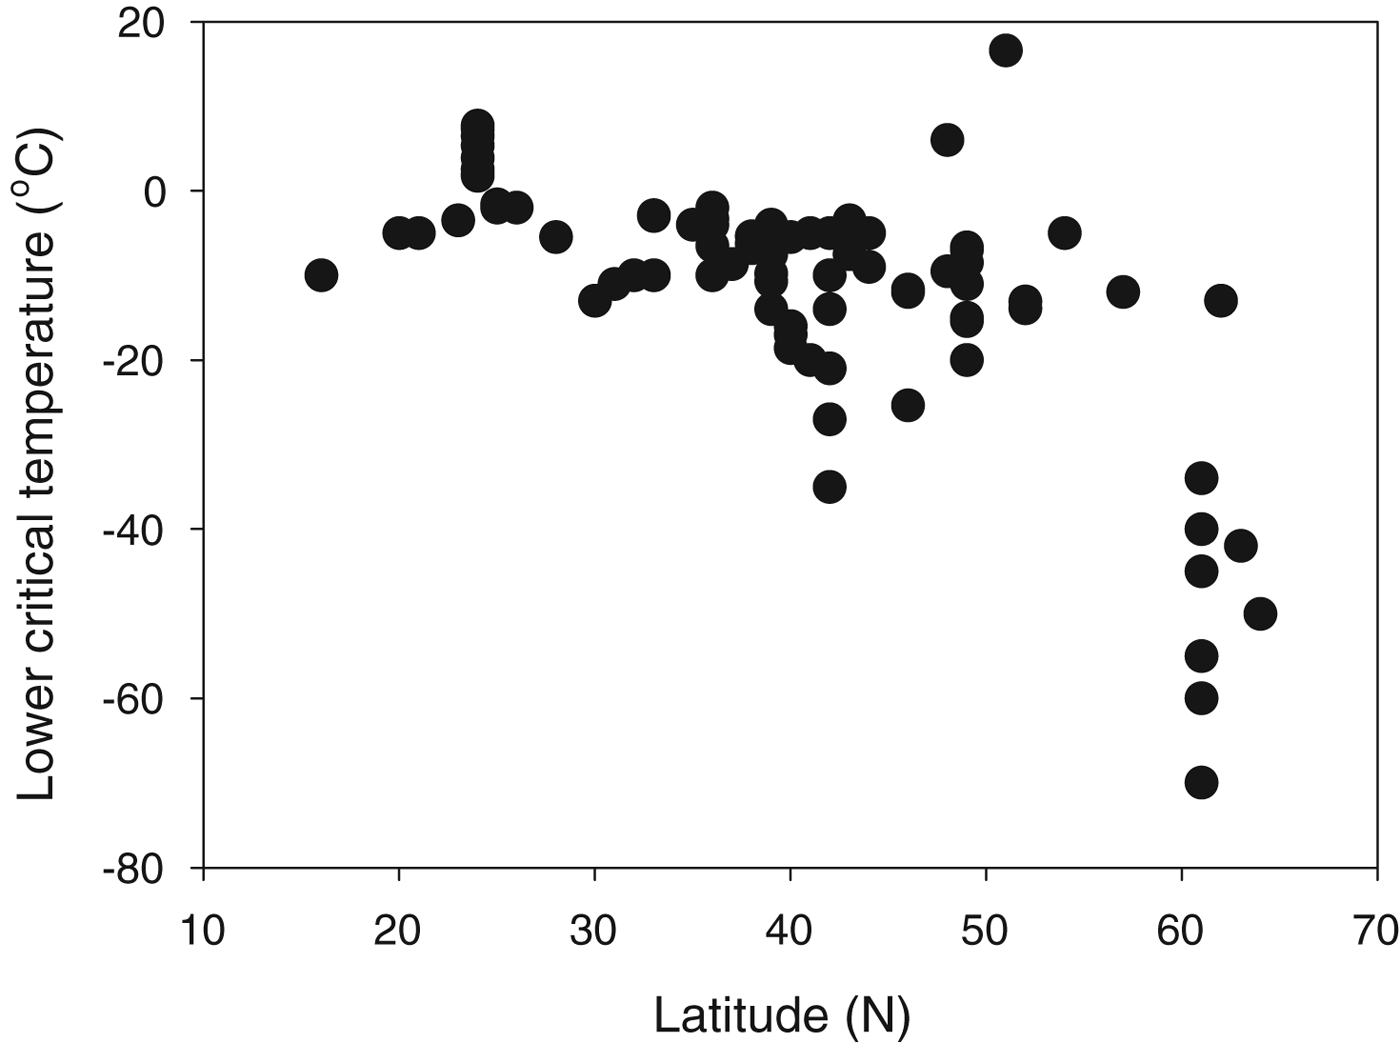
The most studied animals in terms of winter survival in relation to freezing temperatures are arthropods, and insects show examples of both freeze avoidance and freeze tolerance (Leather et al. Reference Leather, Walters and Bale1993; Wharton Reference Wharton2002; Denlinger & Lee Reference Denlinger and Lee2010). A recent study of thermal limits (T S) in insects shows clearly that T S is much lower in insects from higher (colder) latitudes (Fig. 5), indicating that T S can be adjusted by natural selection to match ecological requirements. A few vertebrates have been shown to tolerate extracellular freezing, and the most studied example here is the wood frog Rana sylvatica (Schmid Reference Schmid1982; Storey & Storey Reference Storey and Storey1996, Reference Storey, Storey, Fuller, Lane and Benson2004). Plants overwintering in cold regions are known to undergo extracellular freezing, and in some cases vitrification of the dehydrated cells has been demonstrated (Hirsh et al. Reference Hirsh, Williams and Meryman1985). This may prove to be a widespread phenomenon in high-latitude plants (Hirsh Reference Hirsh1987; Pearce Reference Pearce, Fuller, Lane and Benson2004).

Fig. 5. Lower critical temperature (LCT) as a function of latitude for northern hemisphere insects. LCT is a measure of the lower T S; T L will either be at or above the lower T S. Plotted from data in Hoffmann et al. (Reference Hoffmann, Chown and Clusella-Trullas2013).
Lichens are among the most tolerant of plants, being found in habitats where higher plants are missing. They are able to dehydrate extensively, and in this state can tolerate very low temperatures. The lowest recorded temperature for photosynthetic carbon fixation is −24 °C (Kappen Reference Kappen and Friedmann1993). In Antarctic lichens, photosynthesis has been recorded down to −16.5 °C in Xanthoria candelaria, −17 °C in Umbilicaria aprina and −18 °C in Neuropogon acromelanus (Kappen Reference Kappen and Friedmann1993; Schroeter et al. Reference Schroeter, Green, Kappen and Seppelt1994). In U. aprina, dark respiration ceased at higher temperatures, suggesting that T L is ∼−10 °C (Schroeter et al. Reference Schroeter, Green, Kappen and Seppelt1994). Lichens are a symbiotic relationship between an alga (the photobiont) and a fungus (the mycobiont). Interestingly, the symbiotic organisms (the lichen) appear to withstand more extreme conditions than either the phytobiont or mycobiont alone (de Vera et al. Reference de Vera, Rettberg and Ott2008).
In Antarctica, lichens extend further south than either mosses or vascular plants (Peat et al. Reference Peat, Clarke and Convey2007), suggesting that they are more tolerant of very low temperatures and the associated aridity. These characteristics of lichens have stimulated considerable interest in their use as model experimental organisms in astrobiology (de Vera et al. Reference de Vera, Rettberg and Ott2008; Onofri et al. Reference Onofri2012). Indeed, lichens have been shown to photosynthesize under simulated Martian conditions (de Vera et al. Reference de Vera, Möhlmann, Butina, Lorek, Wernecke and Ott2010), and it has been suggested that lichens could even by viable in small areas with suitable microclimates on Mars today. Studies have, however, concentrated on photosynthesis, and the limited experimental; data suggest that growth ceases at higher temperatures than photosynthesis (Schroeter et al. Reference Schroeter, Green, Kappen and Seppelt1994).
In most cases, terrestrial organisms able to survive extreme cold can only complete their life cycle once temperatures have risen again in summer. Hence, while some very impressive examples of low-temperature survival (T S) are known, it is much more difficult to assign a value to the low-temperature threshold for completion of the life cycle (T L). The lowest limits so far documented are for invertebrates in meltwater on glaciers, such as the enchytraeid annelid ‘ice worms’ of the genus Mesenchytraeus (Farrell et al. Reference Farrell, Hohenstein and Shain2004) or chironomid midges of the genus Diamesa (Kohshima Reference Kohshima1984; Hagvar Reference Hagvar2010), where T L is ∼0 °C. This is slightly higher than the T L for marine invertebrates, but it may be that we simply lack documentary evidence of lower T L values for terrestrial plants and invertebrates. The marked diurnal and seasonal variations in environmental temperature will, however, make such data difficult to obtain.
The special case of endotherms
Two lineages of vertebrates, mammals and birds, have independently evolved endothermy, the capacity to maintain a high and constant body temperature. This is often referred to colloquially as ‘warm-bloodedness’, but this term is unhelpful because many ectotherms, including insects, reptiles and even some fish, can achieve similarly high body temperatures.
Typically endotherm body temperatures are in the range 30–45 °C, with birds tending to be warmer than mammals (Clarke & Rothery Reference Clarke and Rothery2008). These temperatures are achieved through a combination of a high resting metabolic rate and insulation. Endothermy is very expensive energetically, but it allows mammals and birds to be active at any time of the day or night, and to occupy a very wide range of habitats.
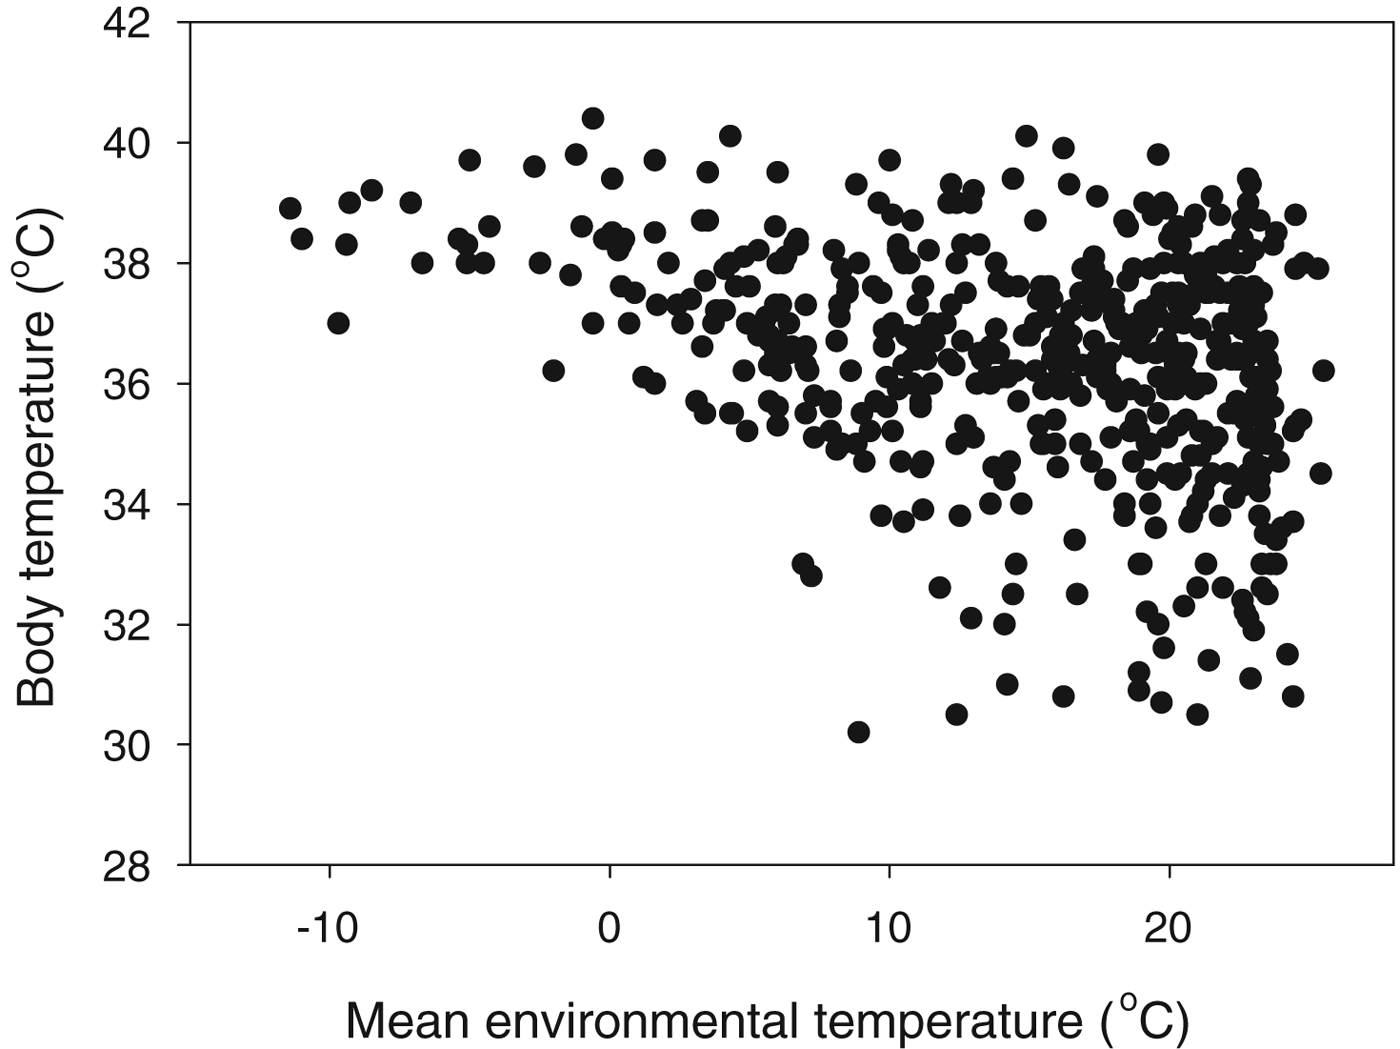
While endotherm cell temperatures are confined to a narrow range, the environments they inhabit range from the hottest deserts to the polar regions. To take mammals as an example, the range of body temperatures is 30–41 °C, but these live in areas with annual mean temperatures ranging from −11 to 26 °C (Fig. 6). The extreme endotherm example is, however, probably a bird: the Emperor Penguin, Aptenodytes forsteri, which raises its chick on sea-ice in the depths of the Antarctic winter, when temperatures are −20 °C or below (McCafferty et al. Reference McCafferty, Gilbert, Thierry, Currie, Le Maho and Ancel2013).

Fig. 6. What is the T L for a mammal? Body temperature as a function of the mean annual environmental temperature within the range for 512 mammal species (from Clarke et al. Reference Clarke, Rothery and Isaac2010).
This poses the question of what is the correct value of T L for an endotherm: is it the internal body temperature at which the cellular physiology operates, or is it the environmental temperature? For humans with cultural adaptations (clothing, housing), the range of environmental temperatures that define the T L range is the widest of any species on Earth.
Concluding remarks
The upper and lower thermal limit to life vary markedly across the domains of life on Earth (Tables 4 and 5). While data on limits to survival (T S) attract considerable attention, the thermal limits to completion of the life cycle (T L) are far more difficult to determine and hence are much less well defined.
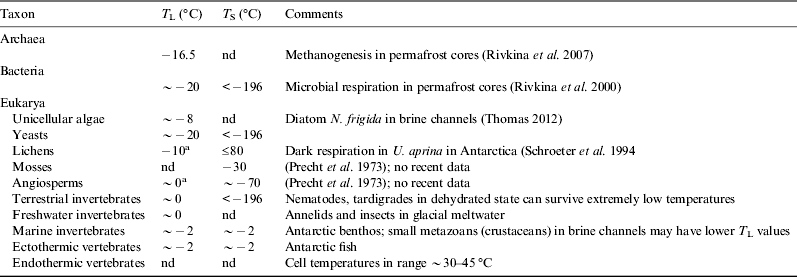
Table 5. Low-temperature limits for life on Earth

nd: no data.
a Unclear whether the entire life cycle is completed at this temperature.
The data are clearest for unicells. Currently identified upper thermal limits for growth are 122 °C for archaeans, 100 °C for bacteria and ∼60 °C for unicellular eukaryotes. No unicells appear to grow below −20 °C, a limit that is probably set by dehydration-linked vitrification of the cell interior driven by freeze-concentration in the presence of extracellular ice (Clarke et al. Reference Clarke, Morris, Fonseca, Murray, Acton and Price2013).
The range of temperatures over which multicellular eukaryotes can complete their life cycle is much narrower than for unicells. The upper limits on land would appear to be exhibited by nematodes in hot springs and compost heaps (∼60 °C), and in the sea by polychaetes associated with hydrothermal vents (>40 °C, but poorly defined). The upper limit for an ectothermic vertebrate would appear to be 38–46 °C for desert pupfish. The lower thermal limits for survival (T S) in multicellular organisms extend to at least −70 °C, the winter minimum temperature of the Arctic tundra and taiga. However in all cases known to date, completion of the life cycle requires summer warmth and the lowest T L appears to be ∼0 °C for invertebrates in glacial meltwater and ∼−2 °C for marine invertebrates and fish living on the continental shelves around Antarctica.
It is interesting that in lichens (de Vera et al. Reference de Vera, Rettberg and Ott2008) and the grass D. lanuginosum (Redman et al. Reference Redman, Sheehan, Stout, Rodriguez and Henson2002), temperature tolerance is conferred by symbiosis or mutualism. The mechanism by which the symbiotic organism gains enhanced temperature tolerance in comparison with the isolated individual components remains obscure.
Acknowledgements
I thank Charles Cockell and Rocco Mancinelli for the invitation to present a keynote talk at the Fifth UK meeting of the Astrobiology Society of Britain (ASB5), and to write this paper. The subject of this paper has benefitted greatly from helpful input over a number of years from John Morris, Peter Convey, Bill Block, Roger Worland, Steven Chown, Lloyd Peck and Nick Lane. I also thank David Wharton, Mark Blaxter and Paul De Ley for helpful advice on recent nematode references, and William Bains for valuable input that sharpened my thinking in key areas.

