


Impact Statement
This research provides actionable insights for managers and engineers in the energy sector by highlighting the critical role of carbonate equilibrium in managing calcium carbonate scale formation in power plant open recirculating cooling systems. Using a data-driven assessment model, the study demonstrates how real-time monitoring of water quality parameters (pH, total hardness, total dissolved solids, and alkalinity) can optimize water treatment, improve heat transfer efficiency, and reduce operating costs. These findings underscore the importance of adopting predictive and adaptive strategies to prevent scaling, ultimately supporting sustainable energy production, conserving resources, and minimizing environmental impact. Managers and engineers can use these results to implement evidence-based guidelines for efficient water chemistry management in power generation facilities.
1. Introduction
The efficient operation of power plants necessitates a continuous supply of water with precise physical and chemical properties, critical to various operational processes, particularly cooling. In open recirculating systems (ORS), used for cooling large-scale equipment, the management of water chemistry is crucial, particularly in preventing calcium carbonate (CaCO3) scale formation, which can severely reduce the efficiency of heat transfer. The fundamental chemistry behind this process involves carbonate (CO32−) equilibrium, governed by the interactions of dissolved carbon dioxide (CO2), carbonic acid (H2CO3), bicarbonate ions (HCO3−), and carbonate ions (CO32−), all of which are influenced by pH and CO2 concentration. When CO2 dissolves in water, it hydrates to yield H2CO3 (equation (1)). This reaction is slow relative to the dissociation of H2CO3 and it is possible to distinguish between simple dissolved CO2 (Lerman and Mackenzie, Reference Lerman and Mackenzie2018). H2CO3 dissociates with the formation of HCO3− ions and CO32− (equation (2), which significantly depends on hydrogen pH).
 $$ {\mathrm{CO}}_2+{\mathrm{H}}_2\mathrm{O}\leftrightarrow {\mathrm{H}}_2{\mathrm{CO}}_3 $$
 $$ {{\mathrm{H}\mathrm{CO}}_3}^{-}+{\mathrm{OH}}^{-}\leftrightarrow {{\mathrm{CO}}_3}^{2-}+{\mathrm{H}}_2\mathrm{O} $$
Variations in hydrogen pH and dissolved СО2 concentration in water control CO32− equilibrium. The effect of CO2 uptake by water and excretion from water may be the dominant process in waters that ultimately lead to CaCO3 deposition equation (3) (Montety et al., Reference Montety, Martin, Cohen, Foster and Kurz2011).
 $$ 2{{\mathrm{H}\mathrm{CO}}_3}^{-}+{\mathrm{Ca}}^{2+}={\mathrm{Ca}\mathrm{CO}}_3\downarrow +{\mathrm{H}}_2\mathrm{O}+{\mathrm{CO}}_2 $$
The CO2 concentration in most waters controls the pH value and thus regulates CaCO3 deposition, affecting CO32− equilibrium (Tobias and Böhlke, Reference Tobias and Böhlke2011). The pH also depends on the partial CO2 pressure: the higher the CO2 pressure, the more CO2 is dissolved, and thus the lower the pH becomes (Walker et al., Reference Walker, Safari, Theregowda, Hsieh, Abbasian, Arastoopour, Dzombak and Miller2012).
ORS is widely used in the energy sector for efficient cooling of large-scale power generation equipment. Scale deposits (i.e., mineral build-up) in ORS, especially CaCO3, reduce operational efficiency. The large scale of ORS amplifies the challenges posed by mineral deposits, requiring more extensive water treatment measures to mitigate them. Scale deposits occur when soluble salts are precipitated and deposited from the cooling water of the ORS to the heat-exchanging surfaces. Scale deposits of CaCO3 are by far the most common found in cooling water systems, which normally result from the breakdown of calcium bicarbonate (Ca(HCO3)2) present in water. CaCO3 results in a loss of ORS operating efficiency. The cost of eliminating the effects of scale formation in ORS can reach USD 0.93 million per year, or 0.88% of revenue for a 550 MW base plant (Walker et al., Reference Walker, Safari, Theregowda, Hsieh, Abbasian, Arastoopour, Dzombak and Miller2012). During ORS operation, cooling water evaporates and concentrates, so make-up water is supplied to restore flow rates, and part of the water is removed from the return water. Therefore, for cooling water ORS, similarly to natural waters, the effect of CO2 uptake by water and excretion from water occurs, and the components of the CO32− system are in equilibrium according to reactions (1 and 2) (Si et al., Reference Si, Xiang and Han2022). Once in the ORS, water changes its physicochemical composition under the influence of many factors, and scale formation processes can occur, consisting of precipitates of СaСО3 depending on the reaction (3) (Kuznietsov et al., Reference Kuznietsov, Biedunkova, Yaroshchuk and Рryshchepa2024). Power plant operation requires access to water sources with appropriate physical and chemical properties. Water quality directly impacts the efficiency and reliability of power plant systems, particularly in cooling processes. Poor water quality, such as high levels of TDS or low pH, can accelerate corrosion of equipment and promote scale formation, leading to a decrease in heat exchange efficiency. This results in higher energy consumption, increased operating costs, and more frequent maintenance. Furthermore, inappropriate water chemistry may cause deposition issues, impairing the flow of water and reducing system reliability.
CaCO3 precipitation can be determined by the loss of chemical equilibrium between ions and CO2 in water (Aziz et al., Reference Aziz, Gebauer and Hedin2011). The solubility of CaCO3 in water is significantly influenced by the concentration of CO2, which is in a state of dynamic equilibrium with specific proportions of HCO3− and CO32−. It is challenging to ascertain the CO2 content in highly mineralized water (Khormali et al., Reference Khormali, Petrakov and Moein2016). Nevertheless, the quantitative relationship between CO2, HCO3−, and CO32− (carbonate equilibrium) can be determined by the concentration of hydrogen ions, with pH, which characterizes the equilibrium condition between the liquid phase and the solid and gaseous phases, taken into account (Bewernitz et al., Reference Bewernitz, Gebauer, Long, Cölfen and Gower2012). In this CO32− equilibrium system, the chemical reactions (1–3) that exist are the CO32−, which contributes to the final pH, and the concentration of Ca. The pH in turn determines the speciation; the level of Ca2+ (and Mg2+) in solution determines the level of complexation (Jarrahian et al., Reference Jarrahian, Aminnaji, Graham and Sorbie2022). Inorganic scales can reduce the flow area of pipelines, leading to increased pressure drop or even blocking of the pipeline (Nouigues et al., Reference Nouigues, Acevedo, Amor, Laberty-Robert, Perrot and Cheap-Charpentier2024). The deposition of scale frequently gives rise to a number of technical challenges, including a reduction in heat exchange efficiency, a decline in flow rates, and the formation of blockages in pipes, which can result in infrastructure failures and damage to pipelines (Luo et al., Reference Luo, Chen, Xu, Chen, Wang, Hong and Ruan2024). The scaling phenomenon is frequently observed in a range of industrial facilities, including power plants, where it affects heat exchangers, steam generation equipment, and cooling towers (Zhang et al., Reference Zhang, Wu, Zhang, Zhou, Guo and Shen2012). Therefore, the formulation of efficacious strategies to prevent or mitigate scale formation represents a substantial concern for the power plant industry (Kuznietsov, Reference Kuznietsov2024). Managing CO32− equilibrium in power plants is crucial for maintaining the efficiency of cooling systems, such as ORS. When the balance of CO32− ions is disrupted, CaCO3 can precipitate, forming scale on heat exchange surfaces. This scale reduces the efficiency of heat transfer, leading to increased energy consumption and operational costs. Proper control of factors like pH and CO2 concentration helps mitigate scale formation, optimizing the plant’s performance and reducing maintenance expenses. Despite the large effort to forecast and prevent CaCO3 formation, the role of CO32− equilibrium on scale formation is poorly understood. On the other hand, the problematic issues of CaCO3 scale formation under changes in CO32− equilibrium in process water within power plant ORS are insufficiently studied. In particular, by conducting an assessment, it is possible to identify preventive actions to avoid problems with ORS operation associated with scale formation on heat exchange surfaces (Toller et al., Reference Toller, Giambastiani, Greggio, Antonellini, Vasumini and Dinelli2020). However, even from the concise introduction above, assessing fluctuations in ORS make-up and cooling water quality and scale formation is important for any power plant to optimize costs. The importance of maintaining strict control over the chemical composition of water to ensure the long-term safety and efficiency of ORS operation. The importance of maintaining strict control over the chemical composition of water to ensure the long-term safety and efficiency of ORS (Kuznietsov et al., Reference Kuznietsov, Biedunkova, Yaroshchuk and Рryshchepa2024). This makes it possible to implement measures aimed at minimizing the reduction of heat transfer efficiency, which leads to a decrease in the overall efficiency of the power plant, increased operating costs and potential overheating of critical components (Jiménez-Arreola et al., Reference Jiménez-Arreola, Pili, Dal Magro, Wieland, Rajoo and Romagnoli2018; Xu et al., Reference Xu, Lin, Dal Magro, Li, Py and Romagnoli2019). TH indicates the amount of calcium and magnesium, which are key components in CaCO3 precipitation, while TA provides insights into the water’s buffering capacity and its resistance to pH changes. Buffering capacity is water’s property to oppose the change of its chemical reaction (pH) more than is typical (6.5–8.5). In the natural waters, the buffer capacity is due to the presence of two systems: carbonic and humic (Lis et al., Reference Lis, Duka, Bunduchi, Gladchi and Goreaceva2010). Buffer capacity of the carbonic system is caused by the HCO3− and CO2 excess (Ibanez et al., Reference Ibanez, Hernandez-Esparza, Doria-Serrano, Fregoso-Infante and Singh2008).
Aziz et al. (Reference Aziz, Gebauer and Hedin2011) explored the kinetic control of CaCO3 crystallization, emphasizing particle-mediated crystallization processes that impact the formation of scales. Similarly, Bewernitz et al. (Reference Bewernitz, Gebauer, Long, Cölfen and Gower2012) investigated metastable liquid precursor phases of CaCO3. These studies provide critical insights into the physicochemical processes underlying scale formation. Kontrec et al. (Reference Kontrec, Tomašić, Matijaković Mlinarić, Kralj and Njegić Džakula2021) examined how factors such as pH and stirring conditions affect spontaneous CaCO3 precipitation. Their findings underscore the sensitivity of scale formation to pH fluctuations, which is critical in cooling systems where CO2 uptake and excretion shift CO32− equilibrium. Khormali et al. (Reference Khormali, Petrakov and Moein2016) and Jarrahian et al. (Reference Jarrahian, Aminnaji, Graham and Sorbie2022) conducted experimental analyses of scale formation in CO32− formations, offering solutions for mitigating scale deposition in power plant cooling circuits. These works emphasize the challenge of managing scale inhibitors in high-temperature environments, which can significantly impact operational efficiency. Scale inhibitors are chemicals that delay or prevent scale formation when added in small concentrations in water that would normally create scale deposits (Mpelwa and Tang, Reference Mpelwa and Tang2019). Temperature changes within ORS play a pivotal role in CaCO3 precipitation, as described by Hofmann (Reference Hofmann2009) and Montety et al. (Reference Montety, Martin, Cohen, Foster and Kurz2011). Luo et al. (Reference Luo, Chen, Xu, Chen, Wang, Hong and Ruan2024) analyzed scale formation of heat exchanger materials; Meng et al. (Reference Meng, Liu, Hou and Chen2024) further expanded on the performance and economic impacts of treating cooling tower blowdown water, highlighting the economic benefits of scale control. The research by Kuznietsov and Biedunkova (Reference Kuznietsov and Biedunkova2023a, Reference Kuznietsov and Biedunkova2023b, Reference Kuznietsov and Biedunkova2024) presents a comprehensive view of water chemistry management in nuclear power plants. These studies emphasize the need for improved monitoring and treatment strategies to address both scale formation and environmental impacts of cooling water discharge. Nouigues et al. (Reference Nouigues, Acevedo, Amor, Laberty-Robert, Perrot and Cheap-Charpentier2024) studied the inhibition efficiency on CaCO3 formation, using advanced analytical tools to refine water treatment protocols. This study complements other research on optimizing chemical treatments, such as the work by Zhang et al. (Reference Zhang, Wu, Li and Zhao2012). Several studies address the broader implications of scale management for operational efficiency and sustainability. Abili and Hemeda (Reference Abili and Hemeda2023) discussed the role of digital engineering in improving efficiency across the energy industry, advocating for data-driven approaches to monitor and optimize system performance, including scale control. Jiménez-Arreola et al. (Reference Jiménez-Arreola, Pili, Dal Magro, Wieland, Rajoo and Romagnoli2018) provided the importance of efficient heat exchange and the prevention of fouling and scaling. Xu et al. (Reference Xu, Lin, Dal Magro, Li, Py and Romagnoli2019) further explored energy efficiency improvements in waste-to-energy plants through novel thermal buffer systems, highlighting the critical role of efficient water management. Therefore, the literature highlights the complex interplay between water chemistry and CO32− equilibrium in ORS power plants.
In this study, a data-driven appraisal model was employed to represent the chemical processes within an ORS. This model utilizes data collection from chemical control measurements at the Rivne Nuclear Power Plant (RNPP), integrating pH, TH, TDS, and TA values to predict precipitation of CaCO3. Data-driven methodologies such as this allow for more precise monitoring of the CO32− system’s equilibrium, facilitating better decision-making for water treatment interventions. This approach aligns with modern trends in engineering systems, where data-centric models improve reliability, resilience, and efficiency by providing predictive capabilities that reduce downtime and operational inefficiencies (Cerquitelli et al., Reference Cerquitelli, Pagliari, Calimera, Bottaccioli, Patti, Acquaviva and Poncino2021; Abili and Hemeda, Reference Abili and Hemeda2023). Moreover, this research offers new quantitative correlations between pH levels, TH, TA, and TDS with the onset of CaCO3 precipitation, allowing for more accurate predictions of when and where scale will form. This is particularly valuable for operators looking to optimize water treatment strategies in similar ORS configurations. Despite the growing emphasis on such methodologies in engineered systems, studies addressing the role of data-driven methods in the management of water chemistry, particularly CO32− equilibrium, remain limited. This article aims to fill this gap by demonstrating how real-time data monitoring and analysis can prevent scale formation, optimize system performance, and reduce costs. The purpose of this article is to examine the relationship between CO32− equilibrium and CaCO3 scale formation in ORS at a power plant, using a data-driven model to predict and mitigate scaling events. The collection and analysis of chemical data allow for a dynamic understanding of the ORS, enabling proactive adjustments to water treatment processes to prevent scale formation and optimize system performance. The novelty of this research lies in its focus on data-centric methods to enhance operational efficiency and reliability in ORS systems. While previous studies have addressed CO32− equilibrium and scale formation (Dhokai et al., Reference Dhokai, Palkar and Jain2022; Kuznietsov, Reference Kuznietsov2024; Meng et al., Reference Meng, Liu, Hou and Chen2024), few have employed a data-driven framework to offer real-time insights into these processes. This article demonstrates how data-driven models can offer predictive capabilities, reducing both the frequency of scale-related issues and the overall operational costs of power plants.
2. Materials and methods
2.1. Appraisal model development
The present study employs an appraisal model designed to simulate the processes occurring during the operation of an ORS at a power plant. Specifically, the model investigates the behavior of water in the ORS, with a particular focus on CaCO3 precipitation and its relationship with CO32− equilibrium. These processes are influenced by water evaporation and concentration, which in turn affect the system’s CO32− equilibrium. A critical parameter in the model is the Cycle of Concentration (CoC), which is defined as the ratio of the concentration of dissolved substances in cooling water to that in make-up water. The CoC is calculated using equation (4). Temperature fluctuations within the system, such as those experienced in condensers and cooling towers, significantly impact the CO32− equilibrium. Heating promotes CO2 excretion, facilitating CaCO3 precipitation, whereas cooling leads to CO2 uptake, thereby influencing pH and the CO32− equilibrium, as described by equation (5). The appraisal model integrates chemical monitoring data and offers a novel approach to predicting CaCO3 precipitation based on variations in key water quality parameters.
2.2. Model assumptions and equations
The model assumes that during ORS operation, continuous cycles of water heating in the condenser and subsequent cooling in the cooling tower result in water evaporation and concentration. This process is reflected in the CoC, which serves as a measure of the rate of evaporation and concentration within the ORS. The CoC is determined (Biedunkova et al., Reference Biedunkova, Kuznietsov and Gandziura2024) by the following equations (4, 5).
 $$ \mathrm{Co}\mathrm{C} =\mathrm{MU}/\mathrm{BD}+ W $$
 $$ W=\Delta \mathrm{t}\hskip0.24em K $$
where MU is the make-up water rate, m3/s; BD is the blow-down water rate, m3/s; W is the windage water in ORS; Δt is the temperature difference in the system, °С; and К is the coefficient for ORS, which depends on air temperature and varies in the range from 0.0012 (0оС) to 0.0016 (40оС).
The appraisal model, illustrated in Figure 1, represents the key processes involved in power plant ORS operation, including water evaporation and concentration.

Figure 1. The appraisal model of an ORS, which reflects the processes of operating a power plant.
However, equations (4, 5) do not fully represent the complex interplay between water evaporation, chemistry, and CO32− system dynamics, crucial for understanding CaCO3 precipitation. Additional chemical processes such as CO2 uptake and excretion, changes in pH, ТH, and TA significantly affect the system’s behavior. The influence of these factors was investigated to identify the dominant one with a relationship between water chemistry and operating parameters affecting scale formation and system efficiency.
2.3. Water chemistry dynamics and scale formation
The model also incorporates the assumption that water chemistry is dynamic, with parameters such as TH, TDS, and TA affecting CaCO3 scale formation. It is hypothesized that an increase in TH and TDS, combined with a decrease in TA, will create conditions favorable for CaCO3 precipitation. Data from the RNPP were used to calibrate the model, specifically focusing on chemical control parameters, including pH, TH, TA, and TDS in both make-up and cooling water. Water quality monitoring at the operational RNPP was conducted three times daily (once per shift), providing frequent measurements of key indicators. This comprehensive dataset formed the empirical basis for model calibration, ensuring data consistency and reliability. The evaluation of correlations, such as between pH make-up and cooling water, make-up water pH and cooling water TA, and CoC and cooling water TH, was performed using Pearson correlation analysis. Preprocessing steps included outlier detection and normalization to ensure the validity of statistical analysis. Thus, the model postulates that changes in water chemistry (COC, pH, TH, TA, and TDS) are closely related to the behavior of the CO32− system, which influences changes in CO32− equilibrium. By basing its parameters on detailed, high-frequency chemical monitoring data, the model ensures robust representation of the CO32− system dynamics within the ORS.
2.4. Analytical methods
Standard analytical methods were employed to measure the water chemistry parameters relevant to the appraisal model. Table 1 outlines the characterization of the measurement methods used in the study.
Table 1. Characterization of measurement methods used in the study

pH was measured using the potentiometric method (MWV 081/12-0317-06), ensuring high precision in detecting pH variations, which are critical for understanding CaCO3 precipitation. By using potentiometry, the study ensures precise monitoring of pH variations, which directly affect CaCO3 precipitation. TDS was determined using the gravimetric method (MWB 081/12-0109-03), providing accurate measurements of the total dissolved ions in the water, which influence water mineralization and the likelihood of scale formation. The gravimetric method is a reliable technique for determining TDS, which represents the total concentration of dissolved ions in the water (Corwin and Yemoto, Reference Corwin and Yemoto2020). Since TDS levels influence water mineralization and the likelihood of scale formation, accurate TDS measurements are essential for understanding the extent of water concentration in the ORS (Biedunkova et al., Reference Biedunkova, Kuznietsov and Gandziura2024). TH and TA were measured by titrimetric methods (MWV 081/12-0006-01), allowing for reliable determination of calcium, magnesium (for TH), and CO32− species (for TA). These parameters are critical for understanding the capacity of water to form scale.
2.5. Statistical analysis
The statistical processing of the study’s results included determining the data range (min-max), arithmetic mean (M), and standard deviation (± SD) for each water quality parameter. Statistical analysis was performed to evaluate correlations between these variables, with the assumption that these relationships could predict the onset of CaCO3 scale formation under varying CoC conditions. Pearson’s coefficient (r) was used to interpret the correlation between the indicators, and r was classified as follows: r < 0.1 indicated a “negligible” correlation, r = |0.1–0.39| denoted a “weak” correlation, r = |0.40–0.65| represented a “moderate” correlation, r = |0.65–0.9| corresponded to a “strong” correlation, and r > |0.9| indicated a “very strong” correlation (Biedunkova and Kuznietsov, Reference Biedunkova and Kuznietsov2024). The model parameters, such as CoC and windage water (W), were derived from empirical data. The calibration of the model was validated through cross-validation techniques using a subset of the dataset collected during chemical monitoring at the RNPP. Statistical analysis was conducted using the BioEstar software package (Version 5.3 MLM) to establish correlations between key water quality parameters. In summary, the model postulates that variations in water chemistry (CoC, pH, TH, TA, and TDS) are closely tied to the behavior of the CO32− system.
3. Results and discussion
If untreated water is used for ORS addition, scale formation cannot be prevented even at low CoC, so pre-treatment methods are used (Biedunkova et al., Reference Biedunkova, Kuznietsov and Korbutiak2024a). Indeed, lime softening is one of the most common pretreatment methods for ORS water and is used at RNPP and consists of treating natural water with lime Ca(OH)2 (Kuznietsov and Biedunkova, Reference Kuznietsov and Biedunkova2023a). Therefore, in lime softening processes, Ca(HCO3)2 and magnesium Mg(HCO3)2 are converted into CaCO3 precipitates and magnesium hydroxide Mg(OH)2, according to the reactions (6–8). The make-up water that has been lime softened is completely devoid of CO2 due to the reaction (6) and, indeed, the effect of CO2 excretion from the water is possible when neutralized with mineral acid (Kuznietsov and Biedunkova, Reference Kuznietsov and Biedunkova2024). The pH level determines the state of CO32− equilibrium and the distribution of CO32− system components. The variations observed for the cooling water pH levels are smaller compared to the make-up water pH values, and the pH changes are more noticeable in the make-up water than in the cooling water (Figure 2a). In particular, by analyzing the data in Figure 2a, it can be stated that the pH of the make-up water is in the range min-max = 7.51–9.52 units, M ± SD = 8.57 ± 0.45 units; the pH of the cooling water is in the range min-max = 8.21–9.53 units, M ± SD = 8.43 ± 0.14 units (Table 2).
 $$ {\mathrm{CO}}_2+\mathrm{Ca}{\left(\mathrm{OH}\right)}_2={\mathrm{CaCO}}_3\downarrow +{\mathrm{H}}_2\mathrm{O} \hskip0.48em $$
 $$ \mathrm{C} \mathrm{a}{\left({\mathrm{H}\mathrm{CO}}_3\right)}_2+\mathrm{C} \mathrm{a}{\left(\mathrm{O} \mathrm{H} \right)}_2=2{\mathrm{CaCO}}_3\downarrow +2{\mathrm{H}}_2\mathrm{O} $$
 $$ \mathrm{Mg}{\left({\mathrm{H}\mathrm{CO}}_3\right)}_2+2\mathrm{C} \mathrm{a}{\left(\mathrm{O} \mathrm{H} \right)}_2=\mathrm{Mg}{\left(\mathrm{O}\mathrm{H}\right)}_2\downarrow +2{\mathrm{CaCO}}_3\downarrow +{\mathrm{H}}_2\mathrm{O} $$
Table 2. Changes in make-up and cooling water quality indicators at ORS RNPP (2022)

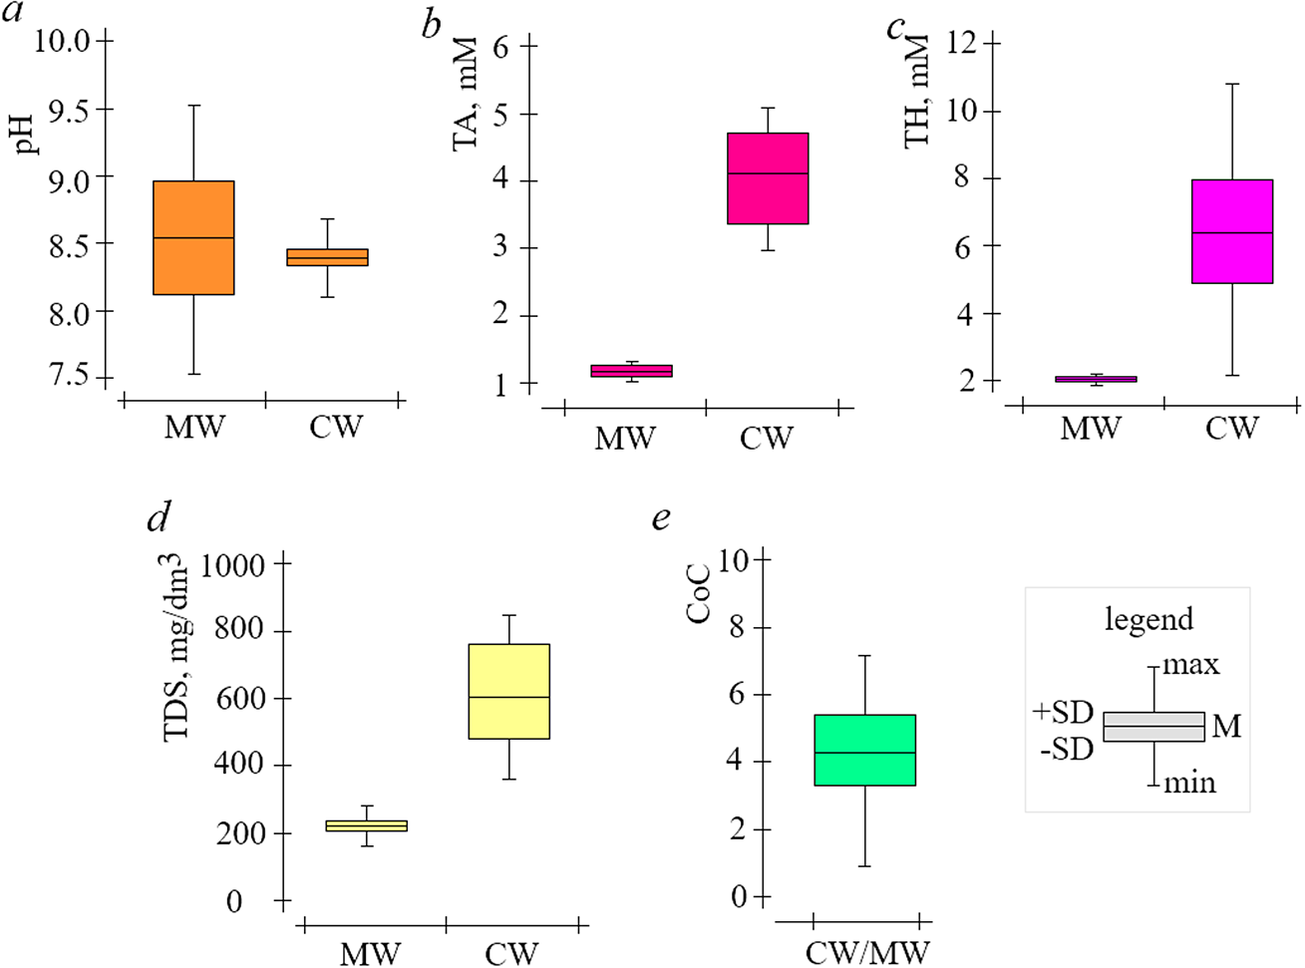
Figure 2. Change values in make-up (MW) and cooling (CW) water of the ORS RNPP for 2022 (a—pH, b—TA, c—TH, d—TDS, e—CoC).
However, the pH levels of the cooling water may increase or decrease compared to the pH levels of the make-up water input (Figure 3a). The ultimate effect of CO2 uptake by the water with the atmosphere is the formation of more H+, with a consequent lowering of pH. A decrease in pH levels in the cooling water compared to the feed water indicates the effect of CO2 uptake by the water as the main process (Trach et al., Reference Trach, Trach, Kuznietsov, Pryshchepa, Biedunkova, Kiersnowska and Statnyk2024). Thus, the effect of CO2 excretion from the water is accompanied by an increase in pH levels, which indicates the formation of CaCO3 precipitate. Changes in the pH of cooling water can be caused by either CO2 excretion or uptake from the atmosphere, affecting the CO32− equilibrium in the water, as highlighted in the study by Toller et al. (Reference Toller, Giambastiani, Greggio, Antonellini, Vasumini and Dinelli2020), where the formation of CaCO3 and an increase in pH levels are discussed. The importance of atmospheric CO2 on aquatic systems is confirmed by McAllan et al. (Reference McAllan, Banks, Beyer and Watson2009), who demonstrate that the absorption of CO2 in water leads to a decrease in pH due to the formation of H2CO3. According to Poschenrieder et al. (Reference Poschenrieder, Fernández, Rubio, Pérez, Terés and Barceló2018), the decrease in water pH due to CO2 uptake can be explained by the increased concentration of H+ ions, which disrupts the CO32− system. Studies on aquatic ecosystems show that CO2 excretion from water and the formation of CO32− precipitates can contribute to an increase in pH (Hofmann, Reference Hofmann2009). The analysis of CO32− formation processes presented by Morse et al. (Reference Morse, Arvidson and Lüttge2007) demonstrates that CO2 excretion from water systems and CaCO3 formation are key mechanisms for pH increase. The correlation between cooling water pH and make-up water pH is quantified by r = 0.7851, which indicates a strong positive correlation. This suggests that changes in the make-up water pH significantly influence the cooling water pH (Figure. 3a). The high value of r confirms the reliability of the observed relationship, demonstrating that variations in make-up water pH play a substantial role in shifting the CO32− equilibrium, which in turn affects CaCO3 precipitation and scaling dynamics.

Figure 3. Change values in MW and CW quality ORS RNPP for 2022 (a—effect of make-up pH on system pH, b—effect of make-up pH on TA, с—effect of CoC on system TH).
TA and TH are integral indicators that affect the process of CaCO3 precipitation by equation (3) (Biedunkova et al., Reference Biedunkova, Kuznietsov and Korbutiak2024a). In particular, by analyzing the data in Figure 2b and c, it can be stated that TA and TH make-up water do not show significant fluctuations, and the range min-max = 0.80–1.52 mM, M ± SD = 1.27 ± 0.22 mM, and min-max = 1.82–2.22 mM, M ± SD = 4.11 ± 0.11 mM, respectively (Table 2). TA and TH cooling water vary in a wider range of min-max = 2.71–5.22 mM, ± SD = 2.05 ± 0.93 mM, and min-max = 2.32–11.18 mM, М ± SD = 6.05 ± 2.34 mM, respectively (Table 2).
The results indicate that water heating in ORS condensers significantly drives CO2 excretion from the water, leading to an increase in pH levels and the onset of CaCO3 precipitation. Conversely, cooling in the towers facilitates CO2 uptake, which lowers pH levels. These alternating processes disrupt the CO32− equilibrium, making precise control of water chemistry essential to prevent scale formation. The ability to predict these fluctuations based on data enables more efficient control of the ORS, minimizing operational interruptions. At this stage, the relationship between pH levels of the supplementary water and TA values of the cooling water (Figure 3b) confirms this statement, as the proportionality of changes in the indicators remains with the restoration of the equilibrium of the CO32− system components according to equations (2, 3). The correlation between make-up water pH and cooling water TA is quantified by r = 0.6974, indicating a strong positive correlation. This suggests that variations in supplementary water pH significantly influence TA levels in the cooling water. The correlation between make-up water pH and cooling water TA (r = 0.6974), while slightly lower than the correlation between pH cooling water and pH make-up water (r = 0.7851), still demonstrates a robust connection. The correlation between supplementary water pH and cooling water TA is slightly weaker because TA, being a measure of the water’s buffering capacity, is influenced not only by pH changes but also by other factors, such as the concentration of HCO3−, СО32−, and other dissolved substances that participate in the CO32− equilibrium.
TDS is an integral indicator that represents the total content of soluble ions. In particular, by analyzing the data in Figure 2d, it can be stated that the TDS of the make-up water varied in the range min-max = 152–305 mg/dm3, M ± SD = 223 ± 54 mg/dm3 and in the cooling water min-max = 350–905 mg/dm3, M ± SD = 692 ± 170 mg/dm3 (Table 2). However, cooling water TDS changes proportionally with changes in make-up water TDS, and taking into account, the make-up water rate and blow-down water rate regimes in ORS, it can be argued that the proportionality of the increase in cooling water TDS is determined by CoC (1). In particular (Figure 2e), CoC varied in the range min-max = 1.52–7.02 units, M ± SD = 4.11 ± 1.53 units (Table 2). Visualization of the data collected in Figure 3c shows that the change in ORS cooling water TH values is proportional, though not strictly linear. This is reflected in the r = 0.3541 (weak positive correlation), which r compared to the correlations for pH (r = 0.7851) and TA (r = 0.6974) highlights the more complex relationship between CoC and TH. Indeed, there is a decrease in the slope of the line after a CoC value of ≥4.2 units, which corresponds to a decrease in the TH value. As CoC increases, the TH initially rises in a proportional manner until it reaches a critical point (CoC = 4.2 units), at which point CaCO3 begins to precipitate, leading to a reduction in TH (Figure 3c and Table 3). This suggests that the system undergoes a transition from a dissolved to a precipitated state of calcium at higher concentrations of carbonate (CoC). The reduction in TH at higher CoC values provides evidence of the influence of CO32− equilibrium dynamics and highlights the critical role of CaCO3 precipitation in regulating the system’s water chemistry.
Table 3. Relationships of CoC with changes in TH and CaCO3 precipitation

Thus, taking into account the dependencies of the ORS water quality indicators (Figures 2 and 3), it can be stated that the lower the CoC values (Table 3), the lower the actual absolute value of TA reduction will be, and for pH, the increase or decrease will be determined by the initial state of CO32− equilibrium. The capacity of a system to reach carbonatite equilibrium is commonly referred to as the buffering capacity (Desmet et al., Reference Desmet, Belleghem, Seuntjens, Bouma, Buis and Meire2011). Furthermore, during heating in the ORS condenser, the subsequent cooling and aeration of the air in the ORS cooling tower causes a shift in the CO32− equilibrium, which can be assumed to be buffered by the dissolution of CaCO3 and the associated increase in TA and pH of the cooling water, and the buffering capacity is determined. However, the CO32− equilibrium is influenced by biochemical processes that also occur in the cooling water of an ORS. In the process of nitrification (Kozaki et al., Reference Kozaki, Ozaki, Nakatani, Mori and Tanaka2014), NH4+ is oxidized to NO3− and HCO3− is converted to H2CO3 (H2O + CO2), which also shifts the CO32− equilibrium. The decomposition of organic nitrogen compounds by microorganisms and the denitrification reaction by denitrifying bacteria occur under low CO2 conditions (Hamlinet al., Reference Hamlin, Michaels, Beaulaton, Graham, Dutt, Steinbach, Losordo, Schrader and Main2008). In addition, the denitrification reaction generated gas CO2, and NO3− was also reduced to N2 gas through denitrification at the same moment that HCO3− was produced (Martin, Reference Martin1999). Thus, the formation of HCO3− and the reduction of NO3− occurred simultaneously, and the formation of HCO3− contributes to the change in equilibrium of reaction (2) and the formation of CaCO3 precipitate by reaction (3).
Finally, it is also pertinent to include photos of the sprinklers and water traps of the ORS RNPP cooling towers taken during the planned outage (Figure 4). As the photos below demonstrate, it is visually noted that there is no existing CaCO3 scale in the sprinklers and water traps of the ORS RNPP cooling towers. Therefore, with the established water-chemical regime of the ORS RNPP, there is a minimal contribution to the formation of CaCO3 scale components of the CO32− system, accompanied by the effect of CO2 excretion from water.

Figure 4. Photos of ORS RNPP cooling tower elements for 2022 (a, b—condition of water traps; c, d—condition of sprinklers).
The case of CO2 uptake or excretion in water systems, particularly in the context of ORS in power plants, provides a clear example of the intricate interactions between water chemistry and environmental factors. This dynamic relationship highlights the importance of maintaining CO32− equilibrium in natural and engineered water systems. CO32− equilibrium is crucial because it dictates the concentration of different CO32− species HCO3−, CO32−, and dissolved CO2, which in turn influence the pH and scaling potential of water.
In natural systems, disturbances to CO32− equilibrium, such as changes in CO2 levels due to environmental or biological factors, are often self-correcting. For instance, when CO2 dissolves in water, it forms H2CO3, lowering the pH. As the pH decreases, the system tends to shift toward higher concentrations of dissolved CO2 and HCO3− at the expense of CO32− ions, as governed by the chemical equilibria involved. Over time, buffering mechanisms, such as the dissolution of CaCO3, help to restore equilibrium by neutralizing the acid and stabilizing the pH (Tobias and Böhlke, Reference Tobias and Böhlke2011). In technological systems like ORS, maintaining CO32− equilibrium is more challenging due to operational factors such as the use of cooling towers, make-up water chemistry, and evaporation (Biedunkova et al., Reference Biedunkova, Kuznietsov and Gandziura2024). When the pH of the system is altered, either through the addition of chemicals or changes in CO2 levels, counter-reactions often occur to restore equilibrium. For example, a deliberate lowering of pH in ORS to reduce scale formation may trigger a response where the system attempts to increase pH by re-equilibrating the CO32− species, potentially negating the intended effect (Kuznietsov and Biedunkova, Reference Kuznietsov and Biedunkova2023b). This complexity underscores the need for careful monitoring and control of pH, TH, TA, and TDS to prevent the formation of CaCO3 scale, a common issue in such systems.
The study conducted by Kontrec et al. (Reference Kontrec, Tomašić, Matijaković Mlinarić, Kralj and Njegić Džakula2021) and Kuznietsov and Biedunkova (Reference Kuznietsov and Biedunkova2023a) emphasizes the importance of using precise measurement techniques to track these parameters. Since pH directly affects the relative proportions of HCO3−, CO32−, and dissolved CO2, maintaining it within a specific range is critical for preventing scale formation and ensuring efficient system operation. The implications of this study extend beyond the specific case of the power plant ORS, as many industrial systems that rely on water recirculation face similar challenges. Thorough understanding of CO32− equilibrium can lead to substantial improvements in water management and scaling prevention across the energy sector. This approach could also contribute to reducing operational costs and improving the lifespan of equipment in other industries reliant on recirculating water systems. Power plants employing ORS can implement similar monitoring and water treatment strategies, such as lime softening and acidification, to maintain optimal cooling system efficiency and reduce energy consumption. Implementing control measures for CO32− equilibrium not only enhances operational efficiency but also minimizes the need for chemical treatments, which may have adverse environmental impacts. Reducing the use of acidifying reagents (Kuznietsov and Biedunkova, Reference Kuznietsov and Biedunkova2023b) and optimizing water treatment protocols (Kuznietsov et al., Reference Kuznietsov, Biedunkova, Yaroshchuk and Рryshchepa2024) can assist power plants in lowering chemical discharge into the environment, thereby improving their sustainability.
This study predominantly relies on water chemistry data from the RNPP. Consequently, the findings are inherently tied to the specific physicochemical characteristics of RNPP’s water sources. Variations in water composition, such as differences in TDS, pH, and CO2 concentrations at other locations, may limit the generalizability of the model to other power plants. Moreover, the study assumes stable environmental factors, such as temperature and humidity, which may not account for potential seasonal or climate-induced fluctuations in water chemistry. The model presented in this study, based on data from the RNPP, can be adapted to different climatic conditions by adjusting the temperature variables that affect water evaporation and concentration in ORS. Power plants operating in warmer or more humid climates can modify the model’s assumptions, thereby making it applicable to a broader range of geographical locations. However, given that the model is based on water chemistry data specific to the RNPP, its findings may differ when applied to power plants utilizing water from other sources. Variations in water composition, such as differences in TDS, pH, or CO2 concentrations, may limit the direct applicability of the study’s results to other facilities.
The study relies on several assumptions, including stable environmental factors and consistent water quality indicators. Significant deviations in temperature, humidity, or water supply conditions could affect the accuracy of the model’s predictions. For instance, considerable changes in the CoC might exhibit different behaviors under extreme environmental conditions. Additionally, the study focuses primarily on CaCO3 scaling and does not account for other types of deposits, such as silica scaling or biological fouling. Power plants located in regions where these other forms of scaling are more prevalent may need to complement this research with additional water chemistry control strategies.
Future studies could explore the influence of varying environmental factors, such as temperature shifts and increased atmospheric CO2 levels due to climate change, on CO32− equilibrium in other ORS. Comparative analyses across different power plants with diverse water chemistries could enhance the adaptability of the predictive model. Additionally, integrating advanced water treatment technologies, like membrane filtration or microbial inhibitors, could provide broader solutions to scale formation. Long-term studies on the cumulative impacts of sustained CO32− equilibrium management, along with investigations into the role of microbial activity in water chemistry dynamics, would add significant value to the understanding of these complex systems.
4. Conclusions
This study presents a novel data-driven approach to managing water chemistry in ORS, specifically focusing on CO32− equilibrium and CaCO3 scale formation. The proposed appraisal model, using data, provides predictive insights that enable power plant operators to optimize water treatment processes, reducing operational costs and preventing scale formation. The results show that fluctuations in pH between the make-up water and cooling water indicate a delicate balance in the CO32− equilibrium. Specifically, the pH of make-up water exhibited a wider range of fluctuations compared to the cooling water. This reflects the dynamic interaction of CO2 uptake and excretion, which are key drivers of pH changes and the subsequent precipitation of CaCO3. The cooling water’s pH changes align with CO2 uptake from the atmosphere, which leads to a reduction in pH and is indicative of ongoing CO32− equilibrium shifts. The processes of water heating in condensers, which drives CO2 excretion, and cooling in cooling towers, which results in CO2 uptake. This dynamic shift in CO32− equilibrium directly impacts CaCO3 scale formation. The study found that as the CoC increases beyond 4.2 units, CaCO3 begins to precipitate, leading to scale formation on heat exchange surfaces. Monitoring and controlling key water quality indicators such as pH, TA, TH, and TDS is crucial in preventing scale formation and maintaining operational efficiency. Power plants should continuously monitor water chemistry, particularly CoC, pH, TH, TA, and TDS, to predict and prevent CaCO3 scale formation. Implementing lime softening and acidification techniques can help manage CO32− equilibrium, reducing the likelihood of scaling and minimizing operational costs. Each power plant should adjust its water treatment practices based on its local water source characteristics and environmental conditions to achieve optimal control over the CO32− system. The benefits of this study are the possibility of extending its results to other power plants with ORS to better manage CO32− equilibrium to prevent the formation of CaCO3 scale, which will reduce operating costs and the environmental impact of chemical discharge.
Data availability statement
There is sufficient information for an independent researcher to reproduce the reported results.
Author contribution
Conceptualization: P.K.; Data curation: O.B.; Investigation: P.K.; Methodology: O.B.; Project administration: O.B.; Software: P.K.; Supervision: O.B.; Visualization: P.K.; Writing—original draft: P.K.; Writing—review and editing: O.B.
Funding statement
This research received no external funding.
Competing interest
The authors declare none.


 Open access
Comments
No Comments have been published for this article.