Leptin is a hormone released by the adipose tissue that assists in the regulation of body weight and energy homeostasis (Pelleymounter et al. Reference Pelleymounter, Cullen, Baker, Hecht, Winters, Boone and Collins1995). Plasma leptin concentration is directly proportional to adipose tissue mass and acts on the hypothalamus as a signal of the amount of energy stored as fat (Considine et al. Reference Considine, Sinha and Heiman1996; Friedman & Halaas, Reference Friedman and Halaas1998). Increasing fat mass results in higher leptin levels, which induce satiety (Mars et al. Reference Mars, de Graaf, de Groot, van Rossum and Kok2006) and a mild enhancement of basal energy expenditure (Considine et al. Reference Considine, Sinha and Heiman1996). Conversely, reducing the body fat stores through regular exercise and/or dieting results in a proportional reduction of circulating leptin (Perusse et al. Reference Perusse, Collier, Gagnon, Leon, Rae, Skinner, Wilmore, Nadeau, Zimmet and Bouchard1997; Houmard et al. Reference Houmard, Cox, MacLean and Barakat2000; Thong et al. Reference Thong, Hudson, Ross, Janssen and Graham2000), although exercise can also elicit changes in leptin concentration without an accompanying change in body composition (van Aggel-Leijssen et al. Reference van Aggel-Leijssen, van Baak, Tenenbaum, Campfield and Saris1999).
A circulating soluble form of the leptin receptor, soluble leptin receptor (sOB-R), is the main leptin-binding protein that determines the free fraction of the circulating hormone, presumably the biologically active form of leptin (Lammert et al. Reference Lammert, Kiess, Bottner, Glasow and Kratzsch2001; Chan et al. Reference Chan, Bluher, Yiannakouris, Suchard, Kratzsch and Mantzoros2002; Stein et al. Reference Stein, Vasquez-Garibay, Kratzsch, Romero-Velarde and Jahreis2006). sOB-R facilitates the transport of leptin from its peripheral site of production to the target tissues (Tartaglia, Reference Tartaglia1997; Maamra et al. Reference Maamra, Bidlingmaier, Postel-Vinay, Wu, Strasburger and Ross2001). The plasma sOB-R concentration increases with weight loss (van Dielen et al. Reference van Dielen, van 't Veer, Buurman and Greve2002; Stein et al. Reference Stein, Vasquez-Garibay, Kratzsch, Romero-Velarde and Jahreis2006). Thus, the concentration of free leptin may be reduced even more than the concentration of total leptin with weight loss. In children with protein energy malnutrition (PEM), the molar excess of sOB-R over leptin was about seventy times higher than in normal children (Stein et al. Reference Stein, Vasquez-Garibay, Kratzsch, Romero-Velarde and Jahreis2006). Two weeks after refeeding, the plasma leptin concentration was found to have increased by 31 % over the control group while the sOB-R was reduced by about 45 % in the PEM children, even though both weight and BMI mean values were still below those in the control group (Stein et al. Reference Stein, Vasquez-Garibay, Kratzsch, Romero-Velarde and Jahreis2006). An excess of sOB-R inhibits the bioactivity of leptin through its competition with the membrane receptor (Zastrow et al. Reference Zastrow, Seidel, Kiess, Thiery, Keller, Bottner and Kratzsch2003) and may reduce the availability of free leptin for transport to the cerebrospinal fluid (Landt et al. Reference Landt, Parvin and Wong2000).
Regular physical activity (i.e. exercise training) is associated with increased energy demand and changes in body composition that in turn could influence plasma leptin concentration (Landt et al. Reference Landt, Lawson, Helgeson, Davila-Roman, Ladenson, Jaffe and Hickner1997; Leal-Cerro et al. Reference Leal-Cerro, Garcia-Luna, Astorga, Parejo, Peino, Dieguez and Casanueva1998; van Aggel-Leijssen et al. Reference van Aggel-Leijssen, van Baak, Tenenbaum, Campfield and Saris1999; Reseland et al. Reference Reseland, Anderssen, Solvoll, Hjermann, Urdal, Holme and Drevon2001; Zaccaria et al. Reference Zaccaria, Ermolao, Roi, Englaro, Tegon and Varnier2002). It remains unknown, however, to what extent exercise training affects the plasma concentration of sOB-R and the balance between leptin and its soluble receptor.
Strength training increases muscle mass, strength and power while fat mass is reduced (Hakkinen, Reference Hakkinen1989; McCall et al. Reference McCall, Byrnes, Dickinson, Pattany and Fleck1996). In the short term, a strength-training session elicits a transient increase in basal plasma testosterone concentration in young men (Hakkinen et al. Reference Hakkinen, Pakarinen, Newton and Kraemer1998; Kraemer et al. Reference Kraemer, Staron and Hagerman1998). In the long term, strength training has also been associated with a small increase (8 %) in basal serum total testosterone concentration (Gorostiaga et al. Reference Gorostiaga, Izquierdo, Ruesta, Iribarren, Gonzalez-Badillo and Ibanez2004), although the free fraction seems not to be affected (Ahtiainen et al. Reference Ahtiainen, Pakarinen, Alen, Kraemer and Hakkinen2003; Gorostiaga et al. Reference Gorostiaga, Izquierdo, Ruesta, Iribarren, Gonzalez-Badillo and Ibanez2004). However, intensive strength training may be associated with a reduction in serum testosterone (Raastad et al. Reference Raastad, Glomsheller, Bjoro and Hallen2001), and this effect may be accentuated by energy deprivation (Bergendahl et al. Reference Bergendahl, Aloi, Iranmanesh, Mulligan and Veldhuis1998). Free plasma testosterone has been reported to be inversely related to sOB-R (Chan et al. Reference Chan, Bluher, Yiannakouris, Suchard, Kratzsch and Mantzoros2002) and leptin (Luukkaa et al. Reference Luukkaa, Pesonen, Huhtaniemi, Lehtonen, Tilvis, Tuomilehto, Koulu and Huupponen1998). Moreover, the weekly administration of 200 mg testosterone enanthate over 12 months has been associated with a 44 % decrease in mean serum leptin concentration (Luukkaa et al. Reference Luukkaa, Pesonen, Huhtaniemi, Lehtonen, Tilvis, Tuomilehto, Koulu and Huupponen1998), probably due to the suppressive effect of testosterone on leptin production (Wabitsch et al. Reference Wabitsch, Blum, Muche, Braun, Hube, Rascher, Heinze, Teller and Hauner1997). Thus, strength training may cause changes in the relationship between fat mass and the plasma levels of leptin, sOB-R and the molar excess of sOB-R over leptin, an estimation of the free leptin index (FLI; Misra et al. Reference Misra, Miller, Almazan, Ramaswamy, Aggarwal, Herzog, Neubauer, Breu and Klibanski2004; Stein et al. Reference Stein, Vasquez-Garibay, Kratzsch, Romero-Velarde and Jahreis2006), which may be modulated in part by alterations in the androgenic status.
The aims of the present study were therefore: (1) to determine whether a 6-week strength-training programme has an effect on circulating levels of leptin, sOB-R, the FLI and testosterone; (2) to determine to what extent strength training-induced changes in body composition are associated with changes in serum plasma concentrations of leptin, its soluble receptor, and free leptin; (3) to determine whether changes in total or free testosterone influence the response of leptin, sOB-R, and the FLI to strength training.
Methods
Subjects
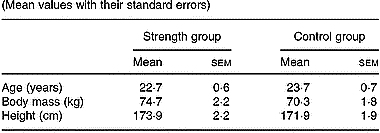
Eighteen healthy men (age 23 (sd 2) years, height 173 (sd 5) cm, body mass 73 (sd 6) kg, body fat 17 (sd 6) %) participated in this investigation. Written informed consent was obtained from all subjects after they had received a full explanation of the study procedures. The subjects were randomly assigned to two groups: one performed a strength-training (ST, n 12) programme and the other was a control group (CON, n 6). Their physical characteristics are presented in Table 1. All of the subjects were healthy and physically active and were familiar with strength training. In addition, they all answered a questionnaire providing information about personal data, sports participation (including the number of training hours per week) and medical history (including past injuries and medication). The study was performed in accordance with the Helsinki Declaration of 1975, and was approved by the Ethical Committee of the University of Las Palmas de Gran Canaria.
Table 1 Characteristics of subjects at the beginning of the study (Mean values with their standard errors)
Study design
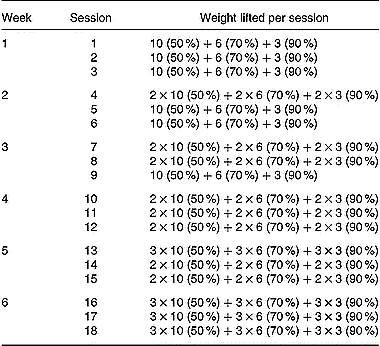
Each subject performed two test sessions, one before and one after strength training. In both test sessions body composition was determined by dual-energy X-ray absorptiometry (DXA) and by the maximum weight that could be lifted at least once for each exercise (one-repetition maximum, 1RM) used during the training period. Before testing and training, subjects were familiarized with the experimental procedures. The total duration of the study was 8 weeks. Baseline testing was completed during the first week. This was followed by a 6-week period of supervised experimental strength training (Table 2). Resting blood samples were drawn at baseline and at the end of the study, 48–72 h after the last training session. Venous blood samples were taken between 07.00 and 08.00 hours, after 12 h overnight fasting. The blood samples were allowed to clot at 4°C and then centrifuged at the same temperature (Allegra 21R, Beckman Instruments Inc, Fullerton, CA, USA). The serum obtained was separated and frozen at − 80°C for later analysis.
Table 2 Strength-training programme (sets×repetitions). Percentage of 1RM 000 (the maximum weight that could be lifted at least once for each excercise) lifted during training is given in parentheses. A 90-s rest period was given between exercise sets
Anthropometry and body composition
Anthropometric measurements were obtained on each subject. Height was measured in the upright position to the nearest millimetre (Atlántida, Añó Sayol, Barcelona, Spain). Body mass was determined using a balance with a 50 g imprecision (Atlántida), calibrated with M1 calibration masses (tolerance < 0·005 % in mass).
Total and regional body composition was assessed by DXA (Hologic QDR-1500, Hologic Corp., software version 7.10, Waltham, MA, USA) as described elsewhere (Calbet et al. Reference Calbet, Moysi, Dorado and Rodriguez1998; Ara et al. Reference Ara, Vicente-Rodriguez, Jimenez-Ramirez, Dorado, Serrano-Sanchez and Calbet2004, Reference Ara, Vicente-Rodriguez, Perez-Gomez, Jimenez-Ramirez, Serrano-Sanchez, Dorado and Calbet2006). Lean body mass (g) and body fat were calculated from whole-body scans. Whole-body scans were submitted to a regional analysis to determine the composition of the arm, leg and trunk regions. The arm region included the hand, forearm and arm, and was separated from the trunk by an inclined line crossing the scapulo-humeral joint, such that the humeral head was located in the arm region. The leg region included the foot, the lower leg and the upper leg, and was separated from the trunk by an inclined line passing just below the pelvis, which bisected the femoral neck crossing the neck of the femur. The trunk region included the rest of the body minus the arm, leg and head regions. The head region comprised all skeletal parts of the skull and cervical vertebra above a horizontal line passing just below the jawbone. With this analysis, regional body fat and lean mass can be assessed with a coefficient of variation below 5 % (Calbet et al. Reference Calbet, Moysi, Dorado and Rodriguez1998). Lean mass of the upper and lower extremities was assumed to be equivalent to the muscle mass of the upper and lower extremities (Shih et al. Reference Shih, Wang, Heo, Wang and Heymsfield2000; Kim et al. Reference Kim, Wang, Heymsfield, Baumgartner and Gallagher2002).
Strength assessment and strength-training programmes
Maximum strength (1RM) for all exercises used during training (parallel squat, leg extension, inclined leg press, leg curl and hip flexors) was assessed immediately before and at the end of the strength-training period. These exercises were performed on weight-lifting equipment (Technogym Ltd, Barcelona, Spain). The parallel squat and the inclined leg press were performed with a range of motion between full extension and a knee angle of 90°. All the available range of motion was used during the leg extension and leg curl exercises. The hip flexors exercise was carried out from the standing position by flexing the knee of one of the extremities, trying to bring it into contact with the chest while a pulley was attached at the ankle. Both limbs were trained alternatively. The 1RM values obtained were subsequently used to calculate the relative loads for the training protocols. The relative loads for each exercise ranged between 50 % and 90 % of the 1RM load (Table 2). Subjects completed a total of 414 sets (parallel squats: 102 sets, leg extension: 102 sets, inclined leg press: 102 sets, leg flexors: 54 sets, hip flexors: 54 sets). A 90-s rest period was taken between exercise sets. All subjects completed the training programme. The energy expenditure during the strength-training sessions was estimated according to the formula of McArdle et al. (Reference McArdle, Katch and Katch1991), energy expenditure (kJ) = (0·36) × (body mass in kg) × (duration of exercise in minutes), and ranged between 1047 and 1424 kJ per session.
Leptin, soluble leptin receptor and testosterone assays
Serum leptin, sOB-R and total and free testosterone were determined by ELISA (ELx800 Universal Microplate Reader, Bioteck Instruments Inc., VT, USA). Serum leptin, sOB-R and free testosterone were measured by using reagent kits from Diagnostic Systems Laboratories (Webster, TX, USA), and total testosterone with reagent kits from Diagnostics Biochemical Canada (London, ON, Canada). The sensitivity of the total leptin and sOB-R assays was 0·05 and 0·2 ng/ml, respectively. The intra-assay CVs were 3·8 % and 4·1 % and the interassay CVs were 4·4 % and 4·9 % for leptin and sOB-R, respectively. For the total and free testosterone assays, the sensitivity was 1·74 nmol/l and 0·66 pmol/l, respectively, and the intra- and inter-assay CVs were 10·8 % and 11·4 % for total testosterone and 6·5 % and 3·1 % for free testosterone, respectively. The FLI, the molar excess of sOB-R over leptin, was calculated as sOB-R divided by leptin multiplied by 0·13 (Stein et al. Reference Stein, Vasquez-Garibay, Kratzsch, Romero-Velarde and Jahreis2006).
Statistical analyses
The statistical analyses was performed using the Statistical Package for the Social Sciences version 11.0 (SPSS Inc., Chicago, IL, USA). All data are reported as means with their standard errors. The effect of strength training on the dependent variables was assessed using ANOVA for repeated measures. The Mauchly's test of sphericity was run before the ANOVA and in case of violation of the sphericity assumption, the degrees of freedom were adjusted according to the Huynh–Feldt test. Pairwise comparisons were carried out with Tukey's test. To determine whether changes in fat mass accounts for the effects observed in leptin, sOB-R and the FRI, ANCOVA was run using the changes in total fat mass as a covariant. Pearson's correlation coefficients were used to assess associations between leptin, sOB-R, the FLI, testosterone and body composition changes. A statistical test was considered significant at the P ≤ 0·05 level (two-tailed).
Results
Body composition
Total body mass was not significantly modified either in the control or in the strength-training group (Table 3). The strength training resulted in a 3·1 % increase in the muscle mass of trained muscles (P < 0·05). Total fat mass decreased by 7 % (P < 0·05) and the fat mass in the trunk, lower and upper extremities was reduced by 8, 7 and 13 %, respectively (all P < 0·05), following strength training. Consequently, at the end of the study, the percentage of body fat was 1·3 units lower in the strength-training group (P < 0·05). Likewise, the percentage of body fat in the trunk, lower and upper extremities was significantly reduced following strength training.
Table 3 Total and regional soft-tissue composition before and after the resistance-training period in all groups (Mean values with their standard errors)
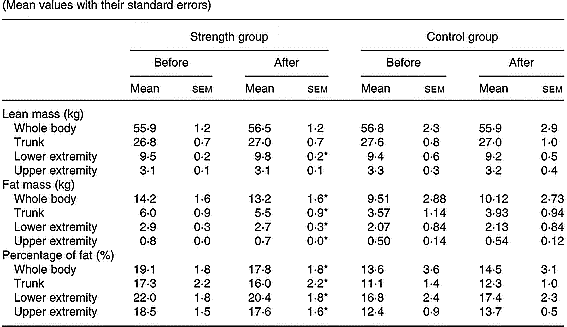
* P < 0·05 compared to pre-training values.
Maximal strength
The strength-training group significantly improved 1RM values in all exercises [inclined leg press (13 %), squats (27 %) leg extension (16 %), leg flexion (12 %) and hip flexors (29 %)] compared with initial 1RM values (all P < 0·05; Fig. 1).
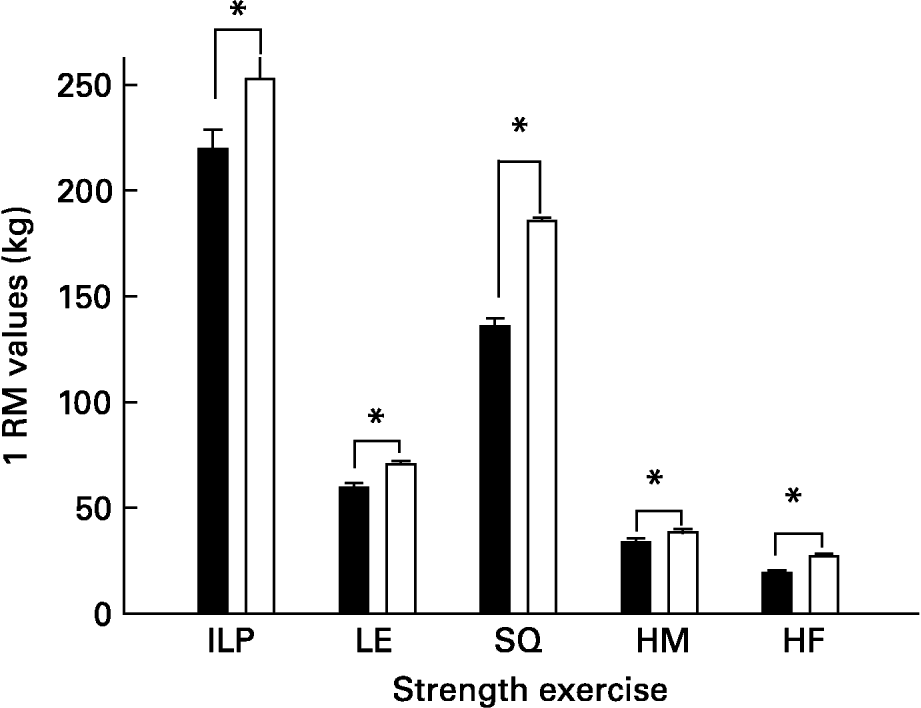
Fig. 1 Effects of strength training. ILP, inclined leg press; LE, leg extension; SQ, parallel squat; HM, leg curl (hamstrings) HF, hip flexors; 1 RM, one-repetition maximum. ■, Before training; □, after training. *P < 0·05 compared to pre-training values
Leptin, sOB-R, the FLI and testosterone changes
Strength training did not significantly alter the basal concentrations of serum leptin, sOB-R, and the FLI or mean total testosterone levels (Table 4). Free testosterone concentration was reduced by 17 % in the strength-training group (P < 0·05). However, for a given fat mass, sOB-R was increased by 13 % (P < 0·05).
Table 4 Leptin, soluble leptin receptor (sOB-R), molar excess of sOB-R over leptin and total and free testosterone values in both groups before and after training (Mean values with their standard errors)

* P < 0·05 compared to pre-training values.
There was no relationship between the changes in leptin, sOB-R, the FLI, total and free testosterone, on the one hand, and the changes in body composition on the other. However, the change in leptin correlated with the change in sOB-R concentration (r − 0·50, P < 0·05). The change in sOB-R concentration correlated inversely with the changes in total testosterone (r − 0·56, P < 0·05).
When all subjects were pooled together, a close relationship was observed between leptin concentrations (Table 5) and the molar excess of sOB-R over leptin (Fig. 2) with fat mass and the waist circumference. However, no relationship was observed between the sOB-R and fat mass before training. At the end of the follow-up, sOB-R was inversely related to the hip circumference (r − 0·59, P < 0·05) and a trend for a negative correlation was also observed with the waist circumference (r − 0·48, P = 0·07).
Table 5 Relationship between leptin, sOB-R, testosterone and fat mass

WB, whole body; sOB-R, leptin soluble receptor; WHR, waist-to-hip ratio.
* P < 0·05.
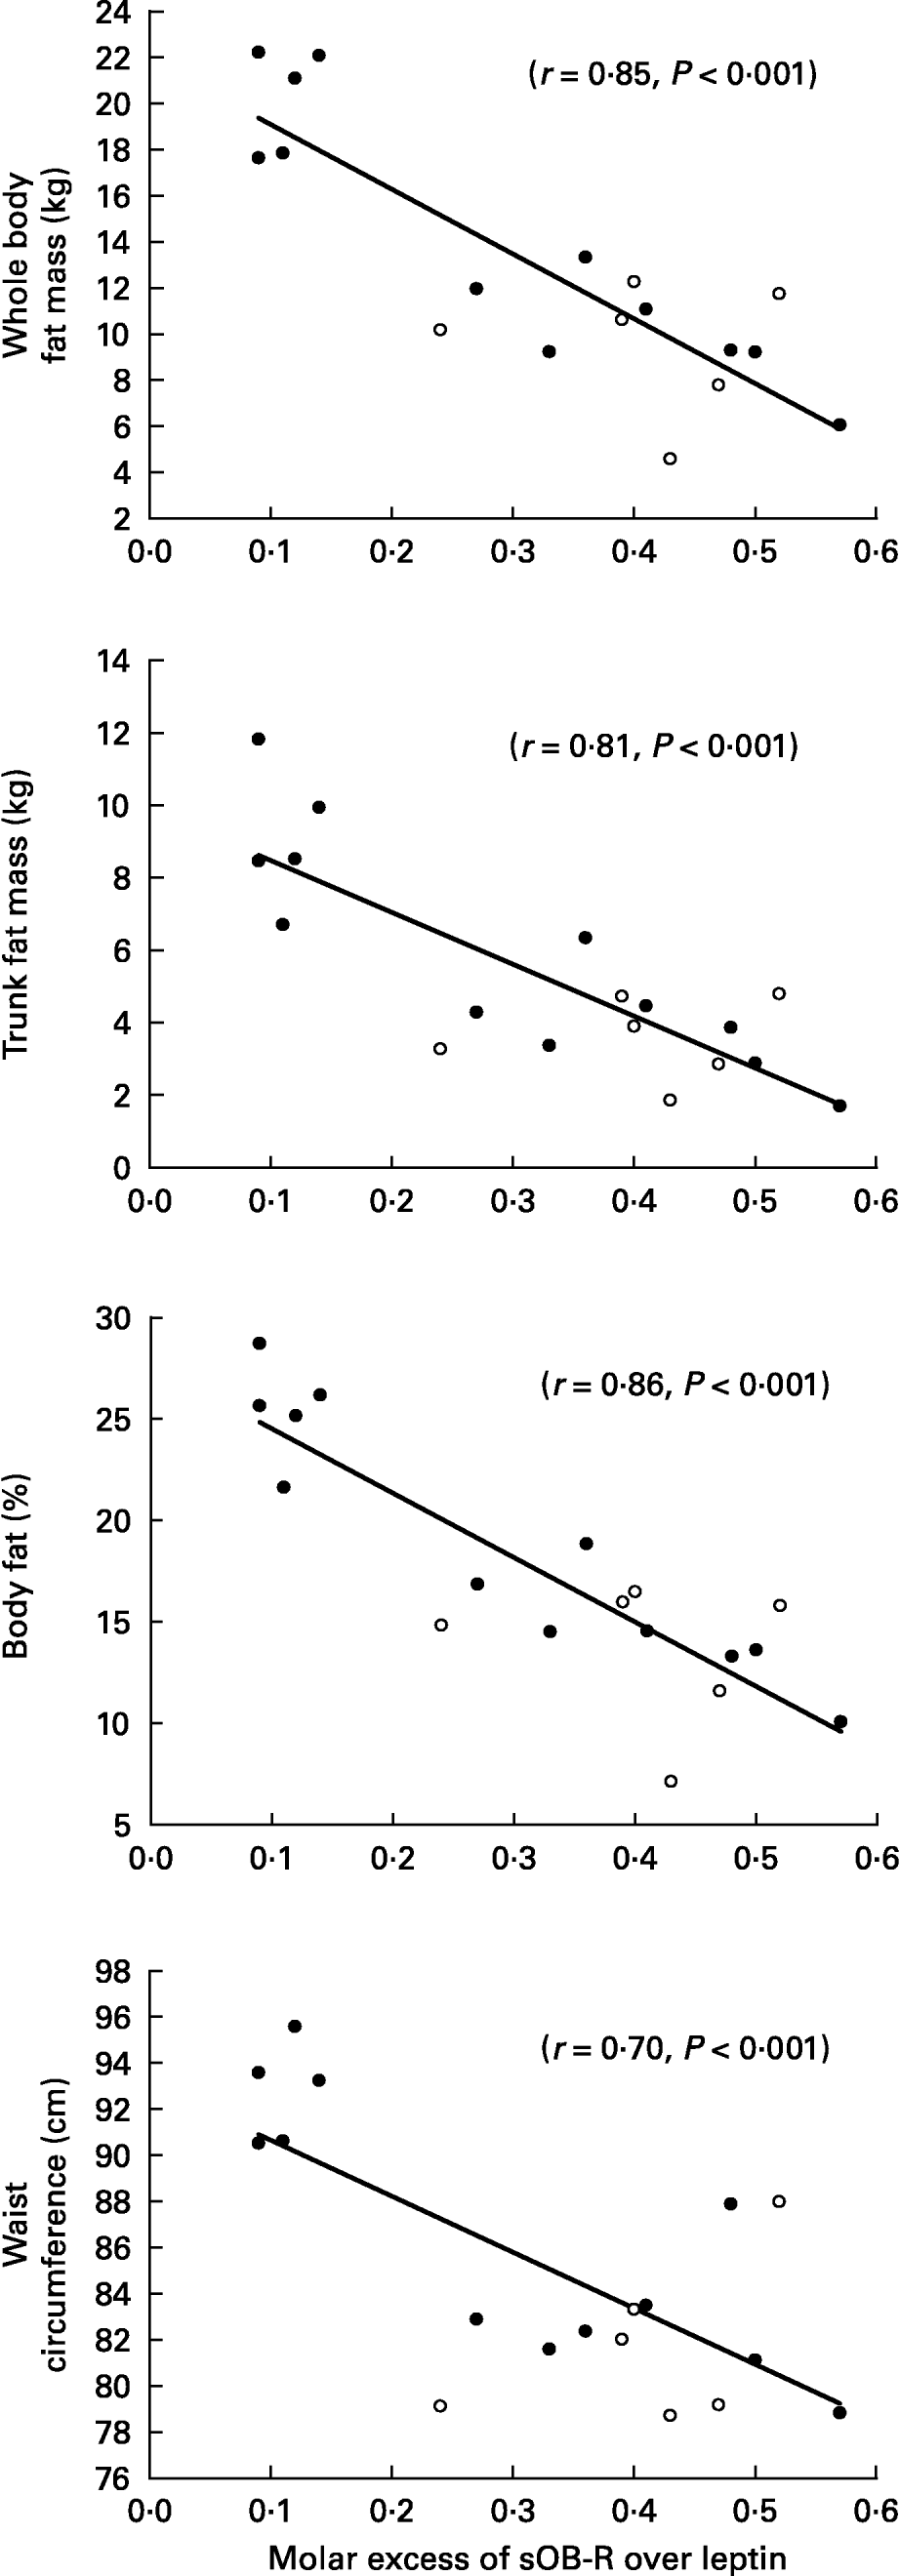
Fig. 2 Relationship between the molar excess of soluble leptin receptor (sOB-R) over leptin and adiposity.
Discussion
Although 6 weeks of strength training resulted in a significant reduction in fat mass, an improvement in dynamic muscle strength and an increase in lean body mass of the trained extremities, the present investigation shows that strength training is not associated with significant changes in basal concentration in serum of leptin, sOB-R or the molar excess of sOB-R over leptin (as an estimation of the FLI). Even after adjusting the hormonal response for changes in whole-body fat mass, no effect of strength training was observed.
Lean mass increases of around 3 % have been reported following a 6-month whole-body strength-training programme in young people (Lemmer et al. Reference Lemmer, Ivey, Ryan, Martel, Hurlbut, Metter, Fozard, Fleg and Hurley2001; Ryan et al. Reference Ryan, Ivey, Hurlbut, Martel, Lemmer, Sorkin, Metter, Fleg and Hurley2004). However, in the present study the effect at the whole-body level was smaller, probably because only the muscles of the lower extremities were trained. However, the lean mass of the lower extremities was increased by 3 %, showing that despite being of shorter duration than other studies (Lemmer et al. Reference Lemmer, Ivey, Ryan, Martel, Hurlbut, Metter, Fozard, Fleg and Hurley2001; Ryan et al. Reference Ryan, Ivey, Hurlbut, Martel, Lemmer, Sorkin, Metter, Fleg and Hurley2004), our strength-training programme was efficient, in agreement with previous studies, as reviewed by Nissen & Sharp (Reference Nissen and Sharp2003).
In accordance with the present results, Kanaley et al. (Reference Kanaley, Fenicchia, Miller, Ploutz-Synder, Weinstock, Carhart and Azevedo2001) did not observe any change in basal serum leptin concentration following 6 weeks of strength training in middle-aged men. However, in contrast to the present investigation, no reduction in body fat mass or increase in muscle mass was observed with strength training in the study by Kanaley et al. (Reference Kanaley, Fenicchia, Miller, Ploutz-Synder, Weinstock, Carhart and Azevedo2001). Sixteen weeks of strength training resulted in lower basal serum leptin levels in obese postmenopausal women who lost body fat, while leptin was not altered in the group of women without changes in their body fat mass during the training period (Ryan et al. Reference Ryan, Pratley, Elahi and Goldberg2000). The authors suggested that the change in basal serum leptin concentration was mediated by the loss of body fat.
The changes observed in whole-body composition with strength training in the present investigation clearly show that our subjects were in negative energy balance. The energy deficit (at least 37 680 kJ, or about 834 kJ/day, assuming no changes in the overall efficiency of the energy metabolism during this period) was covered by the oxidation of part of the fat deposits, as reflected by a 7 % reduction in fat mass. Despite this decrease in fat mass, basal serum leptin concentration was not altered. This could be interpreted as meaning that our subjects developed a state of relatively elevated basal serum leptin concentration by comparison to the fat mass that they had before the start of the training programme. However, we can rule out this possibility because after accounting for the changes in fat mass, no significant effects were observed in leptin concentration. We also explored the possibility of an increase in the concentration of the bioavailable form of leptin, which may change independently of the total serum leptin concentration (Misra et al. Reference Misra, Miller, Almazan, Ramaswamy, Aggarwal, Herzog, Neubauer, Breu and Klibanski2004; Stein et al. Reference Stein, Vasquez-Garibay, Kratzsch, Romero-Velarde and Jahreis2006). An inverse relationship was in fact observed in the present investigation between serum sOB-R and some indexes of adiposity, as reported previously (Sandhofer et al. Reference Sandhofer, Laimer, Ebenbichler, Kaser, Paulweber and Patsch2003). A high serum concentration of sOB-R, combined with reduced leptin and leptin/sOB-R index, has been reported in anorexic girls (Misra et al. Reference Misra, Miller, Almazan, Ramaswamy, Aggarwal, Herzog, Neubauer, Breu and Klibanski2004). Body weight gain resulted in a reduction in sOB-R and an increase in leptin and leptin/sOB-R index in the anorexic girls (Misra et al. Reference Misra, Miller, Almazan, Ramaswamy, Aggarwal, Herzog, Neubauer, Breu and Klibanski2004). In agreement, sOB-R increases with weight loss, probably due to the reduction in fat mass (Laimer et al. Reference Laimer, Ebenbichler, Kaser, Sandhofer, Weiss, Nehoda, Aigner and Patsch2002; van Dielen et al. Reference van Dielen, van 't Veer, Buurman and Greve2002). An inverse relationship between leptin and sOB-R changes has been reported (Chan et al. Reference Chan, Bluher, Yiannakouris, Suchard, Kratzsch and Mantzoros2002; Gavrila et al. Reference Gavrila, Peng, Chan, Mietus, Goldberger and Mantzoros2003) and confirmed in the present investigation. Thus, sOB-R is somewhat sensitive to changes in body composition (Chan et al. Reference Chan, Bluher, Yiannakouris, Suchard, Kratzsch and Mantzoros2002; Reinehr et al. Reference Reinehr, Kratzsch, Kiess and Andler2005; Stein et al. Reference Stein, Vasquez-Garibay, Kratzsch, Romero-Velarde and Jahreis2006). However, despite a 7 % reduction in whole-body fat mass with strength training, no significant effects were observed in sOB-R in the present investigation. However, a 13 % increase in sOB-R concentration adjusted for the whole-body fat mass was observed with strength training, meaning that for a given amount of fat mass, sOB-R is increased after strength training. An increase in sOB-R could decrease the quantity of free leptin available to interact with the target tissues, and with adipose tissue in particular. However, as the molar excess of sOB-R over leptin remained unchanged with strength training, such a possibility seems unlikely (Yang et al. Reference Yang, Ge, Boucher, Yu and Li2004).
In vitro studies indicate that gonadal hormones, such as testosterone, may be important regulators of leptin secretion (Luukkaa et al. Reference Luukkaa, Pesonen, Huhtaniemi, Lehtonen, Tilvis, Tuomilehto, Koulu and Huupponen1998). Androgens are reported to block adipogenesis (Lea-Currie et al. Reference Lea-Currie, Wen and McIntosh1998). This endocrine regulation is supported by the presence of specific sex steroid receptors in fat tissue (Wade & Gray, Reference Wade and Gray1978; Dieudonne et al. Reference Dieudonne, Pecquery, Boumediene, Leneveu and Giudicelli1998), indicating that adipocytes are targets for testosterone (Rebuffe-Scrive et al. Reference Rebuffe-Scrive, Enk, Crona, Lonnroth, Abrahamsson, Smith and Bjorntorp1985). Although not all published studies have found a significant relationship between serum testosterone and leptin, a strong inverse association has been reported (Behre et al. Reference Behre, Simoni and Nieschlag1997; Bhasin et al. Reference Bhasin, Storer, Berman, Yarasheski, Clevenger, Phillips, Lee, Bunnell and Casaburi1997; Luukkaa et al. Reference Luukkaa, Pesonen, Huhtaniemi, Lehtonen, Tilvis, Tuomilehto, Koulu and Huupponen1998). It has also been shown that 6 months of treatment with testosterone injections reduces fat mass by 16 % (Young et al. Reference Young, Baker, Liu and Seeman1993), probably because of a direct effect of testosterone at the level of adipocytes (Wabitsch et al. Reference Wabitsch, Blum, Muche, Braun, Hube, Rascher, Heinze, Teller and Hauner1997). However, the mechanism underlying testosterone influences in leptin secretion remains to be elucidated. In the whole group, the decrease in testosterone concentration was inversely correlated with the changes in sOB-R. In agreement, free plasma testosterone has been reported to be inversely associated with sOB-R (Chan et al. Reference Chan, Bluher, Yiannakouris, Suchard, Kratzsch and Mantzoros2002).
In summary, an intervention consisting of 6 weeks of strength training associated with a 1 kg reduction in fat mass and increases in lean body mass of the trained extremities did not result in significant changes in serum leptin concentration, even after accounting for the differences in body fat. By contrast, for a given fat mass, the sOB-R was increased at the end of the strength-training programme, although the molar excess of sOB-R over leptin (a measure of the FLI) remained unchanged. Thus, the present study indicates that the quantity of free leptin available to bind to the target tissues was not significantly affected by a short strength-training programme, which elicited a 7 % reduction in fat mass.
Acknowledgements
We thank José Navarro de Tuero for excellent technical assistance. Funding was provided by the Ministerio de Ciencia y Tecnología (BFI2003-09 638) and by the Dirección General de Universidades del Gobierno de Canarias (PI0422005/177).


