Almost all industrialised countries face epidemics of obesity, and Japan is no exception. A recent report from the WHO documented that the number of overweight adults worldwide has exceeded one billion, and that at least 300 million of these were clinically obese (World Health Organization, 2003). In Japan, the prevalence of overweight (BMI ≥ 25 kg/m2) in adult men has risen approximately 10 % in the last two decades according to the National Nutrition Survey of Japan (NNS-J) (Yoshiike et al. Reference Yoshiike, Seino, Tajima, Arai, Kawano, Furuhata and Inoue2002). One in every five men aged 20–29 years, and one in every three or four men aged over 30 years are now overweight (Ministry of Health, Labour and Welfare, 2004). However, the trend in Japanese women differs from men, because the prevalence of underweight is increasing, especially in young women (Ministry of Health, Labour and Welfare, 2004).
Overweight or obesity are known to be associated with an increased risk of chronic diseases, such as type 2 diabetes (Manson et al. Reference Manson, Colditz, Stampfer, Willett, Rosner, Monson, Speizer and Hennekens1990; Chan et al. Reference Chan, Rimm, Colditz, Stampfer and Willett1994), CVD (Manson et al. Reference Manson, Colditz, Stampfer, Willett, Rosner, Monson, Speizer and Hennekens1990; Wilson et al. Reference Wilson, D'Agostino, Sullivan, Parise and Kannel2002), and certain forms of cancer (Calle & Thun, Reference Calle and Thun2004), due to metabolic changes caused by excess fat. However, underweight is also associated with negative health consequences, such as nutritional deficiency (Russell et al. Reference Russell, Mira, Allen, Stewart, Vizzard, Arthur and Beumont1994), osteoporosis (Blum et al. Reference Blum, Harris, Must, Phillips, Rand and Dawson-Hughes2001), and unfavourable pregnancy outcomes in women of childbearing age (Edwards et al. Reference Edwards, Alton, Barrada and Hakanson1979). As in obesity, underweight is also an important risk factor to increased mortality risk in Japanese (Tsugane et al. Reference Tsugane, Sasaki and Tsubono2002).
In Japan, we have a 10-year national plan to promote the health of the Japanese population named ‘Health Japan 21’, which was released in 2000. One of the plan's objective aims to decrease the prevalence of underweight (BMI < 18·5 kg/m2) in women aged 20–29 years to less than 15 %, and to increase the proportion of individuals who are aware of their own optimal weight to 90 % or more by 2010 (Ministry of Health, Labour and Welfare, 2000a). However, the recent data from the NNS-J showed little change in the prevalence of underweight from the baseline (Ministry of Health, Labour and Welfare, 2004).
Most previous studies regarding desire for thinness in young women are from Western societies, where most women are at risk of overweight or obesity rather than underweight. Another limitation is that previous studies on body dissatisfaction or other related issues in Japanese women were from small convenient samples or specific age groups such as adolescents or college students (Watanabe et al. Reference Watanabe2003; Wardle et al. Reference Wardle, Haase and Steptoe2005). Even in the USA where many pioneering work in this area has been documented, a recent population-based study on the prevalence of overweight misperceptions and weight-control behaviours among normal-weight subjects included only adolescents, and used the self-reported height and weight measurements for the analyses (Talamayan et al. Reference Talamayan, Springer, Kelder, Gorospe and Joye2006). Other population-based studies were looking at misperceptions of body size as barriers to reducing overweight rather than underweight (Paeratakul et al. Reference Paeratakul, White, Williamson, Ryan and Bray2002; Kuchler & Variyam, Reference Kuchler and Variyam2003).
Takimoto et al. (Reference Takimoto, Yoshiike, Kaneda and Yoshita2004) reported that the decrease in BMI from 1976 to 2000 was prominent among young Japanese women they studied (15–19, 20–24 and 25–29 years of age). However, BMI changes and the prevalence of underweight of women aged 15–19 years living in metropolitan areas predominated those living in smaller towns. That is, there was a difference in the prevalence of underweight by geographical region. McLaren & Gauvin (Reference McLaren and Gauvin2003) reported that living among thinner women increases the likelihood of reporting dissatisfaction with body image. Therefore, we assumed that women living in metropolitan areas and large cities were more likely to misperceive their body size and report stronger desire for thinness compared with women living in smaller towns.
In accordance with the result of the previous studies and assumptions we made, the objective of the present study was to describe the situation of perceived body size and desire for thinness among young Japanese women, by using datasets from a population-based survey. Furthermore, we evaluated relationships of perceived body size and desire for thinness with age and residential areas.
Methods
Survey sample and methodology
Datasets of the NNS-J in 1998 were used in the present study (Ministry of Health, Labour and Welfare, 2000b). The NNS-J was initiated in 1945 to assess the nutritional status and socio-economic status of the Japanese population to obtain urgently needed food supplies from other countries, but it now monitors and assesses the dietary intakes and health outcomes of the population. Each November, approximately 15 000 members from nearly 5000 households in randomly sampled census units are surveyed by the local public health centres under the supervision of the Japanese Ministry of Health, Labour, and Welfare. There are three major components in the NNS-J. One is the physical examination survey, in which all participants aged 1 year and older are invited to have their height and weight measured at local public health centres in the selected survey area. Blood pressure measurements and a 1 d step tests using a pedometer are recorded for participants aged 15 years and older. Blood tests of haematological parameters, lipid profiles, and glucose levels are only conducted for adults aged 20 years and older, and blood is drawn 3 h or more after the last meal. All physical measurements are conducted by trained public health nurses, according to the measurement protocol in the NNS-J (Ministry of Health, Labour and Welfare, 2000b). The second component is the 1 d weighed dietary record of all members of the survey household. The third component is the dietary questionnaire, which all participants aged 15 years and older are asked to fill in. The contents of the dietary questionnaires differ each year. Before the analyses, we received permission of the use of NNS-J datasets from the Ministry of Health, Labour and Welfare.
We evaluated 1731 non-pregnant and non-lactating women aged 15–39 years for whom information on height and weight measurements and dietary data were available. Although the role of family members of patients with disordered eating behaviours has been discussed in clinical settings, there is no consistent evidence that women with eating disorders were more likely to have sisters than brothers, or to have more females than males in their family (Dolan et al. Reference Dolan, Evans and Lacey1989; Britto et al. Reference Britto, Meyers, Smith and Palmer1997). Therefore no adjustment was made in the present study for the number of women in a household. The 1731 women were classified into 5-year age groups (15–19, 20–24, 25–29, 30–34 and 35–39 years of age) and then categorised by their current body size as determined by BMI percentiles (5th, 25th, 75th, 95th percentile) calculated for each age group (Table 1). Body-size categories are as follows: lean (BMI < 5th percentile); underweight (5th ≤ BMI < 25th percentile); normal (25th ≤ BMI < 75th percentile); overweight (75th ≤ BMI < 95th percentile); obese (BMI ≥ 95th percentile).
Table 1 Anthropometric characteristics of women by age groups and residential areas‡ (Mean values and standard deviations)

Mean value was significantly different from that of the 25–29-year age group: * P < 0·05, ** P < 1155.
† Mean value was significantly different from that of ‘towns’ (P < 0·05).
‡ For details of definition of terms, see p. 1155.
Outcome measures
Body-size perception was determined by the woman's response to the question: ‘Which best describes your current body size: lean, underweight, normal, overweight, or obese?’ We defined ‘overestimation’ of body size as being a woman's perception of being ‘overweight’ or ‘obese’ when her actual current body size was lean, underweight or normal. Therefore, the analyses were only focused on non-obese and non-overweight subjects. We then compared the ‘overestimators’ with the ‘non-overestimators’ for the measured and desired BMI, as well as the difference between measured and desired weight, by age and residential area.
Each woman also gave a response regarding her desired weight. To evaluate the desired body size of these women, we calculated the ‘desired BMI’ of each woman by applying her desired weight and her measured height. The desired BMI was categorised according to the BMI percentiles of her current age group. ‘Desire for thinness’ was defined as a woman having a desired BMI in the ‘lean’ or ‘underweight’ range.
Residential areas were defined by the population size of the woman's current residence. We considered a ‘town’ ( < 50 000 residents) as the base reference area, and compared it with ‘metropolitan areas’ ( ≥ 1 000 000 residents), ‘large cities’ (150 000–1 000 000 residents) and ‘small cities’ (50 000–150 000 residents).
Statistical analysis
All numerical variables including age, height, weight and BMI values were expressed as mean values and sd. One-way ANOVA were used to compare numerical data across different age categories. To compare categorical data, χ2 tests were applied. Logistic regression analyses with multivariate models were used to estimate the adjusted odds ratio OR of ‘overestimation’ of body size and ‘desire for thinness’. P < 0·05 was considered to be statistically significant. All data were analysed with the SAS statistical package (version 8; SAS Institute Inc., Cary, NC, USA).
Results
The characteristics of the study participants by age group are presented in Table 1. When we compared the measured weight with the desired weight for each age group, the difference between these two variables was smallest in women aged 25–29 years. Therefore, we considered this group as a reference for the following analyses. In regard to height, women aged 35–39 years showed a significantly lower value (P < 0·05) compared with the reference group. In regard to mean desired weight, it was significantly lower (P < 0·01) in the youngest group (15–19 years), but was significantly higher (P < 0·05) in women aged 35–39 years. Mean desired BMI was significantly lower (P < 0·01) in women aged 15–19 years, but it was significantly higher in women aged 30–34 years (P < 0·05), as well as in women aged 35–39 years (P < 0·01). In regard to the difference between current and desired weight, there were no significant differences across age groups.
Table 1 also shows the characteristics of the study participants by residential areas. The mean age of the women was similar in the four residential areas. When compared with women residing in towns, BMI values were significantly lower in women from metropolitan areas and large cities (P < 0·05). The mean desired BMI was significantly lower (P < 0·05) in women from metropolitan areas than in women residing in towns. The mean difference between measured and desired weight was smallest in women from large cities, but this was not statistically significant.
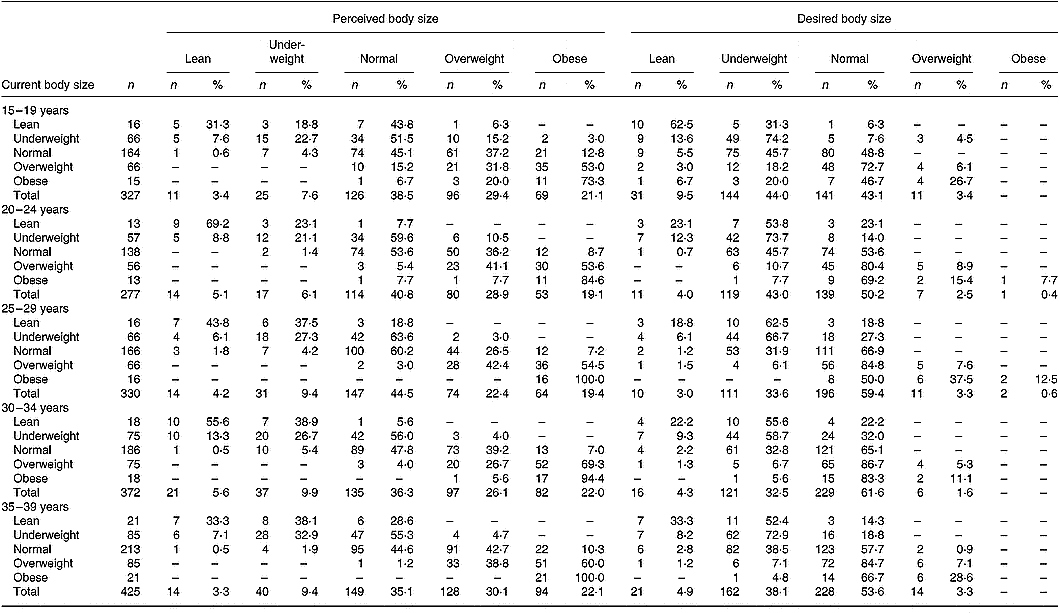
Table 2 shows the distributions of perceived body size and desired body size according to actual body size by age groups: 48·4 % of all women perceived themselves as being ‘overweight’ or ‘obese’. In women whose actual body sizes were neither overweight nor obese, the proportion of women who believed that they were ‘overweight’ or ‘obese’ (overestimation) was lowest (23·4 %) in the 25–29-year age group: 38·6 % of non-overweight, non-obese women in the 15–19-year age group overestimated their body sizes. The prevalence of overestimation was 32·7, 31·9 and 36·7 % in non-overweight, non-obese women in the 20–24-year, 30–34-year and 35–39-year age groups, respectively. In all age groups, underweight women were more likely to perceive themselves as being ‘normal’ than women in the normal category. The proportion of women who had the desire to be in the ‘lean’ or the ‘underweight’ category was 53·5, 46·9, 36·7, 36·8 and 43·1 % in the five age groups. Most women who were currently lean or underweight desired their body size to be ‘lean’ or ‘underweight’.
Table 2 Distributions of perceived and desired body size according to actual body size by age groups*
* For details of definition of terms, see p. 1155.
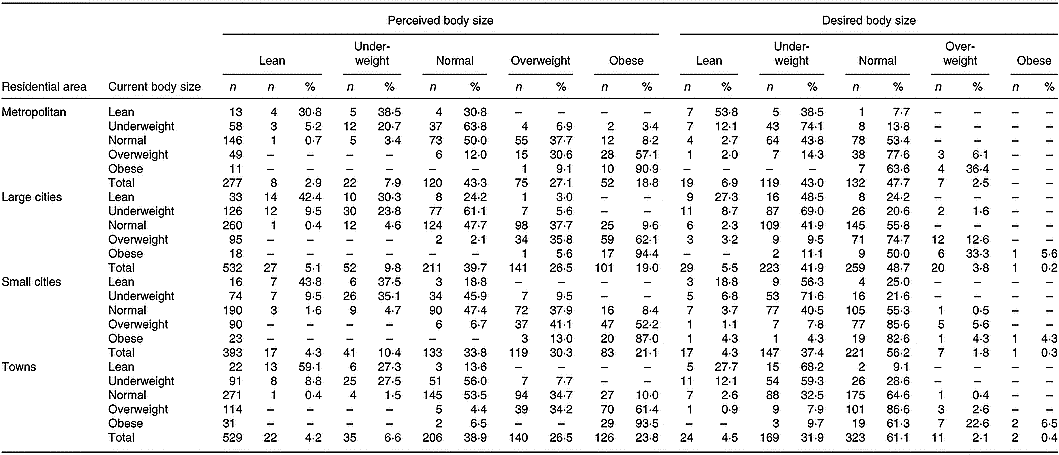
Table 3 shows the distribution of perceived body size and desired body size according to current body-size categories grouped by the residence area. The proportion of obese women was 4·0 % in metropolitan areas, 3·4 % in large cities, 5·9 % in small cities and 5·9 % in towns. In women who were neither overweight nor obese, the proportion of overestimation was 33·6 % in metropolitan areas, 31·3 % in large cities, 33·9 % in small cities and 33·3 % in towns. The proportion of women whose desired body size was in the ‘lean’ or the ‘underweight’ category was 49·8 % in metropolitan areas, 47·4 % in large cities, 41·7 % in small cities and 36·5 % in towns.
Table 3 Distributions of perceived and desired body size according to actual body size by residential area*
For details of definition of terms, p. 1155.
Table 4 shows the measured and desired BMI, as well as the difference between measured and desired weight by the degree of ‘overestimation’. In regard to age, the proportion of ‘overestimators’ in women aged 25–29 years was the smallest (23·4 %) among all age groups, compared with the 15–19-year group where 38·6 % were ‘overestimators’. In regard to residential areas, there were fewer ‘overestimators’ in large cities (31·3 %) than in small cities (33·3 %). In total, 32·8 % of women were considered as ‘overestimators’. In regard to the difference between the measured and desired BMI, the measured BMI of ‘overestimators’ was significantly higher than that of ‘non-overestimators’ (P < 0·01) regardless of age or residential areas. The mean desired BMI was also higher in the ‘overestimators’, but the difference between the two groups was relatively small compared with the differences in the measured BMI between the two groups across all age groups and residential areas. The desired BMI was similar in ‘overestimators’ and ‘non-overestimators’ in women in the 15–19-year age group, and their desired BMI was below 18·5 kg/m2 in both ‘overestimators’ and ‘non-overestimators’. Differences between measured and desired weight in ‘overestimators’ were similar across all age groups, and were significantly (P < 0·01) larger compared with ‘non-overestimators’. Significant differences (P < 0·01) in the gap between measured and desired weight between ‘overestimators’ and ‘non-overestimators’ were seen in all residential areas.
Table 4 Comparisons of the measured and desired body mass index, and ‘difference between measured and desired weight’ between ‘overestimators’ and ‘non-overestimators’ by age group and residential area†
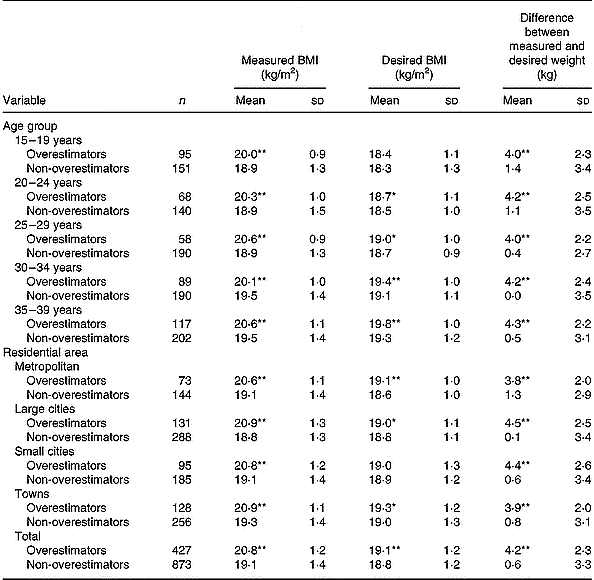
Mean value was significantly different from that of ‘non-overestimators’ in the same category: * P < 0·05, ** P < 0·01.
† For details of definition of terms, see p. 1155.
We calculated the OR for the related variables to ‘overestimation’ in non-obese, non-overweight women using a multivariate logistic regression model adjusted for the current BMI (Table 5). In this analysis, 427 women were defined as ‘overestimators’. The OR for ‘overestimation’ were 2·79 (95 % CI 1·76, 4·43; P < 0·01) in the 15–19-year age group and 0·75 (95 % CI 0·47, 1·18; P = 0·21) in the 35–39-year age group, compared with the 25–29-year age group. The OR for ‘overestimation’ increased with the population size of the residence area, but was not significant.
Table 5 Multivariate logistic regression analyses for ‘overestimation’ by age group and residential area*(OR and 95 % CI)
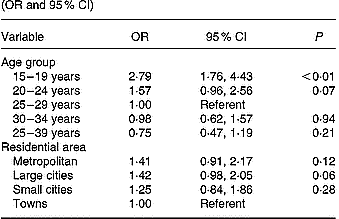
* Analyses were adjusted for the current BMI; subjects were restricted to non-obese and non-overweight women in the analyses. For details of definition of terms, see p. 1155.
We calculated the OR for the related variables for ‘desire for thinness’ with all subjects, using a multivariate logistic regression model adjusted for the current BMI (Table 6). In regard to age group, 756 were defined as having ‘desire for thinness’ in the analyses. The OR for ‘desire for thinness’ were 2·26 (95 % CI 1·57, 3·24; P < 0·01) in the 15–19-year age group and 2·74 (95 % CI 1·93, 3·89; P < 0·01) in the 35–39-year age group, compared with the 25–29-year age group. In regard to residential area, 747 women were defined as having ‘desire for thinness’. The OR for ‘desire for thinness’ increased as the population size increased. The OR was significantly higher in women who resided in metropolitan areas (OR 1·47 (95 % CI 1·05, 2·07); P = 0·03). In addition, women who had overestimated their body size (n 427) were 1·33 times more likely to have ‘desire for thinness’ than those who did not (OR 1·33 (95 % CI 1·03, 1·70); P = 0·03).
Table 6 Multivariate logistic regression analyses for ‘desire for thinness’ by age group, residential area and overestimation of body size*(OR and 95 % CI)
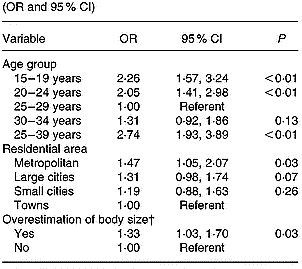
* Analyses were adjusted for the current BMI. For details of definition of terms, see p. 1155.
† Subjects were restricted to non-obese and non-overweight women in the analyses.
Discussion
The present results clearly demonstrated that (1) both measured and desired BMI of women living in metropolitan areas were significantly lower compared with towns, (2) body-size perception was the most accurate in women aged 25–29 years, (3) significant ‘overestimation’ of body size was observed in women aged 15–19 years, (4) both young and middle-aged women had significantly higher ‘desire for thinness’, (5) women living in metropolitan areas had significantly higher ‘desire for thinness’, and (6) women who overestimated their body sizes were more likely to desire thinner body sizes than those who did not. However, findings from our present study did not support one of our hypotheses that women living in larger cities were more likely to overestimate their body size than women living in smaller towns. Women living in larger cities tended to overestimate their body sizes, but no significant association was observed.
The present study demonstrated that ‘desire for thinness’ is not only observed in young Japanese women, but also in middle-aged women. Pubertal changes and weight gains in young women have a significant effect on the development of one's body image and body satisfaction (Cash & Pruzinsky, Reference Cash and Pruzinsky2002; Suka et al. Reference Suka, Sugimori, Yoshida, Kanayama, Sekine, Yamagami and Kagamimori2005). This is also observed in teenage girls and female college students in Japan, who have the strong ‘desire for thinness’, despite the fact that they are not overweight (Kaneda et al. Reference Kaneda, Sugano, Sano, Nishida, Yoshiike and Yamamoto2004; Wardle et al. Reference Wardle, Haase and Steptoe2005). Our findings on increased ‘desire for thinness’ in young women are in accordance with these existing studies. However, research on middle-aged Japanese women in relation to weight perceptions and ‘desire for thinness’ has been limited. In the UK, for example, ‘desire for thinness’ of elderly women was reported to be equivalent to that of young women (Hetherington & Burnett, Reference Hetherington and Burnett1994). In addition, Allaz et al. (Reference Allaz, Bernstein, Rouget, Archinard and Morabia1998) found that many older women in Switzerland continued to engage in dieting, despite the fact that they were of normal weight, reflecting the continued pressure felt by women to lose weight. In the present study, the measured body weight in women aged 35–39 years was significantly higher compared with the reference group of 25–29 years. Therefore, we assume that weight gain due to ageing brings dissatisfaction in current body size, because thinness is a standard definition of attractiveness for women at all ages.
There are several points that should be considered when interpreting the present results. First, the present study is a cross-sectional observation which makes it difficult to determine the causal relationships even though the results were generated from nationally representative samples. Second, the BMI cut-off points we applied in the present study were neither the international standard nor the Japanese standard developed by the Japan Society for the Study of Obesity (Matsuzawa et al. Reference Matsuzawa, Inoue and Ikeda2000). These standards were both established based on risks of chronic diseases or mortality. In other words, these are more obesity-oriented. The present study, on the other hand, is aimed at identifying extravagant weight-control behaviours of young Japanese women, in which the increased prevalence of underweight (BMI < 18·5 kg/m2) and extreme underweight (BMI < 17·0 kg/m2) has been the major public health problem (Takimoto et al. Reference Takimoto, Yoshiike, Kaneda and Yoshita2004). The number of overweight women in the young generation are rather scarce, contrary to the worldwide obesity epidemic. These facts raised the assumption that the BMI distribution curve of this population group was likely to skew to the lower end than the upper. In addition, we had to consider significant change in the BMI distribution curve with advancing age. We assume that the application of neither the international nor the Japanese standard cut-off points disables quantitative comparisons with corresponding studies from other population groups. However, the increase in the prevalence of underweight is specific to this population group in the first place. Therefore, the use of relative BMI cut-off points to define body-size categories is an appropriate approach to learn specific characteristics of this particular population group. The findings suggest the nature of excessive weight concerns of young women in Japan. Underweight was also evident in this population group; thus efforts to control such health-risk behaviours of young women at a national level are urgent.
Women are more likely to experience less bodily satisfaction and are more likely to have lower self esteem and negative consequences (i.e. eating disorders) compared with men, regardless of age (Cash & Pruzinsky, Reference Cash and Pruzinsky2002). In the present study, despite the fact that a large proportion of women were not overweight, they overestimated their body size and wanted to become even leaner. According to the 2002 NNS-J report, 12·9 % of underweight (BMI < 18·5 kg/m2) women aged 15 years and older were actually trying to lose weight. Dieting behaviours among underweight women were prominent in women aged 15–19 years (41·0 %), and the rate decreased with advanced age. Furthermore, 52·0 % of normal-weight (BMI 18·5–24·9 kg/m2) women were trying to lose weight, and the prevalence rate of women aged 15–19 years, 20–29 years and 30–39 years were 68·6, 63·8 and 55·4 %, respectively. These results suggest that the increase in the prevalence of underweight among young Japanese women is partly due to unnecessary weight control of non-obese individuals. It has been reported that body image concerns during adolescence are related to lower self esteem and are related to increased risks for eating disorders (Cash & Pruzinsky, Reference Cash and Pruzinsky2002). In addition, weight-concerned mothers have an impact on their child's behaviours, such as negative weight concerns and unhealthy dieting behaviours (Francis & Birch, Reference Francis and Birch2005). Health professionals need to disseminate information on the risks of unhealthy weight-control behaviours and the benefits of a healthy diet, especially to women of reproductive age. Further studies are needed to identify how overestimation of body sizes and strong ‘desire for thinness’ observed in this very lean population group are related to poor health of young Japanese women.
Acknowledgements
The present study is funded by Research on Children and Families (the Ministry of Health, Labour and Welfare) and a research grant for Surveys on Nutrition and Diet of the Japanese People (National Institute of Health and Nutrition).


