Introduction
Human population growth rates in Africa are among the highest in the world (Haub and Kent Reference Haub and Kent1989). This population growth is putting unprecedented pressure on the natural environment; amongst those pressures are the intensification and expansion of farming, increased development and an increase in the legal and illegal trade of dead and live wild animals (Balmford et al. Reference Balmford, Moore and Brooks2001, Brashares and Sam Reference Brashares and Sam2005). The impacts of these increased pressures are beginning to be detected in wild animal populations and declines in a variety of taxa have been reported, with species belonging to higher trophic guilds being particularly at risk (Thiollay Reference Thiollay2006, Henschel et al. Reference Henschel, Coad, Burton, Chataigner, Dunn, MacDonald, Saidu and Hunter2014, Bauer et al. Reference Bauer, Chapron, Nowell, Henschel, Funston, Hunter, Macdonald and Packer2015, Ogada et al. Reference Ogada, Shaw, Beyers, Buij, Murn, Thiollay, Beale, Holdo, Pomeroy, Baker, Krüger, Botha, Virani, Monadjem and Sinclair2015). Protected areas have become vital for the preservation of biodiversity in Africa (Bauer et al. Reference Bauer, Chapron, Nowell, Henschel, Funston, Hunter, Macdonald and Packer2015), but even in these areas, species are not always immune to anthropogenic impacts (Woodroffe and Ginsberg Reference Woodroffe and Ginsberg1998, Herremans and Herremans-tonnoeyr 2000, Western et al. Reference Western, Russell and Cuthil2009). In order to mitigate the negative impacts of these pressures on wild animal species it is important to understand the patterns of these declines, which can help identify the factors driving population change (Amar et al. Reference Amar, Grant, Buchanan, Sim, Wilson, Pearce-Higgins and Redpath2011).
Comprehensive monitoring programmes, involving systematic repeat surveys over time, have played a crucial role in documenting and elucidating the cause of national biodiversity declines in many developed countries (Buckland et al. Reference Buckland, Magurran, Green and Fewster2005, Hewson et al. Reference Hewson, Amar, Lindsell, Thewlis, Butler, Smith and Fuller2007, Bled et al. Reference Bled, Nichols and Altwegg2013). Such monitoring schemes have often been supported by governments or large NGOs. However, within Africa these types of monitoring programmes are generally non-existent. The few re-surveys which have occurred are generally small scale (i.e. covering specific protected areas (Lindsell et al. Reference Lindsell, Klop and Siaka2016)) or have involved repeats of historic road transects (Thiollay Reference Thiollay2006, Virani et al. Reference Virani, Kendall, Njoroge and Thomsett2011). One exception to this situation in Africa is the Southern African Bird Atlas Project (SABAP); these national surveys were carried out in several Southern African countries over a 5-year period (1987–1992), and within South Africa have been repeated, recommencing in 2007 and are still on-going. These surveys therefore present a unique opportunity to examine changes in bird populations in South Africa over a period of time where there has been considerable development (Odhiambo Reference Odhiambo2009).
Birds of prey are known to be particularly vulnerable to environmental change and may therefore act as good indicators of changes in environmental quality (Sergio et al. Reference Sergio, Newton, Marchesi and Pedrini2006). Only a few re-surveys of raptor populations have occurred in Africa over a sufficiently long temporal scale, but these have documented large declines for many species with particularly large declines recorded for large eagles and vultures (Thiollay Reference Thiollay2006, Virani et al. Reference Virani, Kendall, Njoroge and Thomsett2011). These species may be particularly vulnerable to changes in habitat quality or direct persecution because of their slow reproductive rate and particularly their low mortality rates (Ortega et al. Reference Ortega, Manosa, Margalida, Sanchez, Oria and Gonzalez2009, Murgatroyd et al. Reference Murgatroyd, Underhill, Rodrigues and Amar2016). For example, Virani et al. (Reference Virani, Kendall, Njoroge and Thomsett2011) found declines of many large raptors from repeat road survey carried out in southern Kenya. Similarly, Thiollay (Reference Thiollay2006), found large declines in raptor communities in West Africa from road surveys between the 1980s and 2000s, particularly for vultures and large eagles. One of these species, the Martial Eagle Polemaetus bellicosus declined to almost extinction outside of protected areas and in many areas of Africa the species is now heavily reliant on these protected areas for its continued existence (Herremans and Herremans-tonnoeyr 2000, Thiollay Reference Thiollay2006).
The Martial Eagle is the largest eagle species in Africa, where it is widely distributed throughout sub-Saharan Africa (BirdLife International 2016). The species is considered to be declining throughout much of its range (Brown Reference Brown1991, Thiollay Reference Thiollay2006) and as a result the species has recently been uplisted to ‘Vulnerable’ by IUCN (BirdLife International 2016). Within South Africa the species has recently been uplisted to regionally ‘Endangered’, due to suspected population declines (Underhill Reference Underhill2012, Taylor et al. Reference Taylor, Peacock and Wanless2015). Various causes for declines have been proposed and appear to vary from region to region. Within West Africa, Thiollay (Reference Thiollay2006) attributed these declines to loss of prey species, particularly large birds and medium sized mammals, which have declined to near extinction outside of protected areas. In contrast, Brown (Reference Brown1991) attributed declines in his region of Namibia to persecution by livestock farmers.
In this paper, we take advantage of the unique data provided through SABAP to explore whether there have been declines of Martial Eagles in South Africa over a two-decade period using reporting rates from SABAP 1 (1987–1992) and SABAP 2 (2007–2012). Furthermore, in the hope of better understanding the processes that may be driving population changes, we examine whether changes have occurred equally between provincial regions, between habitat types and inside and outside of protected areas.
Methods
Martial Eagle survey data
We used data on Martial Eagle occurrence from the first and second Southern African Bird Atlas Project (SABAP 1, 1987–1992; Harrison and Underhill Reference Harrison, Underhill, Harrison, Allan, Underhill, Herremans, Tree, Parker and Brown1997; and SABAP 2, 1997–ongoing; http://sabap2.adu.org.za/). SABAP is a citizen science survey, based on checklists (cards), which record the species of birds seen in a given area for a given period of time. In SABAP 2 improvements were made to the SABAP 1 protocol. Spatially, SABAP 1 was implemented at quarter-degree grid cell (QDGC) resolution which, in South Africa, translates to an area c.26 km x 27 km. SABAP 2 is spatially more refined, being surveyed at the pentad scale (9 pentads in one QDGC; c.9 km x 9 km each). Temporally, SABAP 1 used checklists that could be carried out over a maximum period of one month, whereas for SABAP 2 surveys cover a maximum period of five days (Bonnevie Reference Bonnevie2011). These spatial and temporal differences introduce several difficulties, which are not insurmountable, in comparing SABAP 1 with SABAP 2 (see Bonnevie Reference Bonnevie2011, Bled et al. Reference Bled, Nichols and Altwegg2013 for more details). Although the protocols for data collection differ between the two survey periods, SABAP 2 was designed to allow comparison with SABAP 1 and to examine changes in reporting rates as a means to investigate population changes across the range (ADU 2013). To match the two surveys spatially, the SABAP 2 pentad data were combined for each QDGC. Most importantly, for our study species, a study validating the use of SABAP 1 and 2 comparisons has been undertaken; Amar et al. (Reference Amar, Cloete and Whittington2016) found similar estimates of population change comparing SABAP surveys with independent field nest surveys. This suggests that, despite discrepancies between SABAP 1 and SABAP 2 protocols, SABAP comparisons do enable the documentation of population changes in an accurate manner (Hofmeyr Reference Hofmeyr2012, Shaw Reference Shaw2013).
SABAP 1 data were collected between 1987 and 1992. SABAP 2 data collection began in 2007 and we used SABAP 2 data from July 2007 to August 2012. For each QDGC, we used data on the total number of cards and the number of cards recording Martial Eagles (‘positive cards’) to calculate a reporting rate for each cell in each period (number of positive cards / total cards). We assumed no false positives, i.e. that the species was always correctly identified. This was a reasonable assumption, as the species is large and highly distinctive. For the analyses, we only used QDGCs which had at least five completed cards in both SABAP periods.
Environmental and geographical data – classification of each QDGC
We extracted geographical data which was applicable to each QDGC. To achieve this, relevant data sources were extracted using ArcGIS 9.3 (ESRI 2011). The QDGC grid was re-projected to Albers Equal Area to minimise distortion. Data were extracted only for grid cells clipped to the South African geopolitical boundary and, as such, cells that border the coast or neighbouring countries would only be partial cells. The area for each QDGC (and used to extract covariates) was tabulated using zonal statistics, setting the processing cell size at 100 m.
Geopolitical boundaries and biomes
Each QDGC was assigned a provincial category using National and Provincial boundaries obtained from the Municipal Demarcation Board of South Africa (MDB 2013). Where a QDGC was present in more than one Province, the proportion of each Province was calculated, and the Province with the greatest area coverage assigned to the QDGC. Similarly, data on the nine South African biomes (Albany Thicket, Desert, Forest, Fynbos, Grassland, Indian Ocean Coastal Belt, Nama Karoo, Savanna and Succulent Karoo), sourced from Mucina and Rutherford (Reference Mucina and Rutherford2006), were assigned to each QDGC. For ease of analysis any biome type that was dominant in less than 10 cells was reclassified to the second most dominant biome in the cell or to the dominant biome in the surrounding cells if there was no other biome in that cell. This approach reclassified all Desert and Forest biome QDGC’s.
Protected areas
Information on the amount of protected land within each QDGC was derived from the following datasets: National Protected Area Expansion Strategy 2002 (updated in June 2006; BGIS 2008); World Database of Protected Areas (www.protectedplanet.org); and the National Biodiversity Assessment (SANBI 2012). These databases therefore included both formal protected areas (i.e. statutory protected areas) and informal protected areas (i.e. statutorily non-gazetted private nature reserves, game reserves and game farms). QDGC were then classified as protected if ≥ 50% of their area was covered by these formal or informal protected areas. Additionally, we also examined changes within three of South Africa’s largest National Parks which were known to be important areas for Martial Eagles; these were Kruger National Park, Kalahari National Gemsbok Park and Hluhluwe-iMfolozi. For this we therefore subset the data to include only QDGCs that were located (i.e >50%) within the boundaries of these parks (see Amar et al. Reference Amar, Cloete and Whittington2016 for further details).
Statistical analysis
Generalised linear models (GLM) were used to quantify changes in reporting rates between the two SABAP projects. QDGCs where Martial Eagles were never reported were excluded from all subsequent analysis. Our analysis aimed to quantify changes in reporting rates at various levels: 1) nationally, 2) within each province, 3) between biomes and 4) within or outside of protected areas.
GLMs were fitted with a binomial error structure and logit link function. Our response variable was the reporting rate of Martial Eagles in each QDGC for each period (SABAP 1 or SABAP 2), as a two-vector variable consisting of the number of positive cards and the number of negative cards in each QDGC in each period (Amar et al. Reference Amar, Grant, Buchanan, Sim, Wilson, Pearce-Higgins and Redpath2011, Cunningham et al. Reference Cunningham, Madden, Barnard and Amar2016). In this way, our analysis explicitly accounted for differences in survey effort (i.e. number of cards) between cells and also within cells between survey periods.
The factor of “Period” (SABAP 1 or SABAP 2) was fitted as a categorical fixed effect in the model, as an explanatory variable, to examine the change nationally, and within three specific national parks (by analysing only the subset of QDGCs located within these parks) (Amar et al. Reference Amar, Cloete and Whittington2016), and as an interaction to examine the change in reporting rate for each of the other variables fitted as a main effect (e.g. province, biome, protected area status), run as separate models for each term. This interaction therefore tested whether the reporting rate change differed between the two survey periods in different provinces, biomes or depending on whether QDGCs were dominated by protected areas. Thus, on the full dataset, we ran a total of four models. The questions the models were addressing and the terms used in the models were as follows: 1) national changes: explanatory variable = Period; 2) changes between provinces: explanatory variables = Period + Province + Period*Province; 3) changes between biomes: explanatory variables = Period + Biome + Period*Biome; 4) changes by protected areas status: explanatory variables = Period + PAstatus + Period*PAstatus. Additionally, to explore changes in the three national parks selected, we ran three models which used the structure of model 1 (above) but only on a subset of data which included the QDGCs located in each park.
The significance (Chi-square test statistic and P-values) of the explanatory terms in the models were explored using the ‘anova’ function applied to the output from the GLMs. Pairwise comparisons were made using the ‘lsmeans’ package (Lenth and Hervé, Reference Lenth and Hervé2013), with corresponding t-test statistics and P-values. All analyses were conducted in R (R Core Team, 2015).
Results
From the 1,245 quarter-degree grid cells (QDGC) considered for this analysis (those containing at least five cards in each SABAP survey), 475 QDGCs (38.2%) contained no Martial Eagle records during either SABAP survey and were excluded from further analyses. From the remaining 770 QDGCs used in our analysis, the species disappeared (i.e. only recorded in SABAP 1 surveys) from 381 QDGCs (49.5%), declined in 198 QDGCs (25.7%), increased in 113 QDGCs (14.7%) and colonised (i.e. only recorded in SABAP 2) 78 QDGCs (10.1%) (Figure 1).
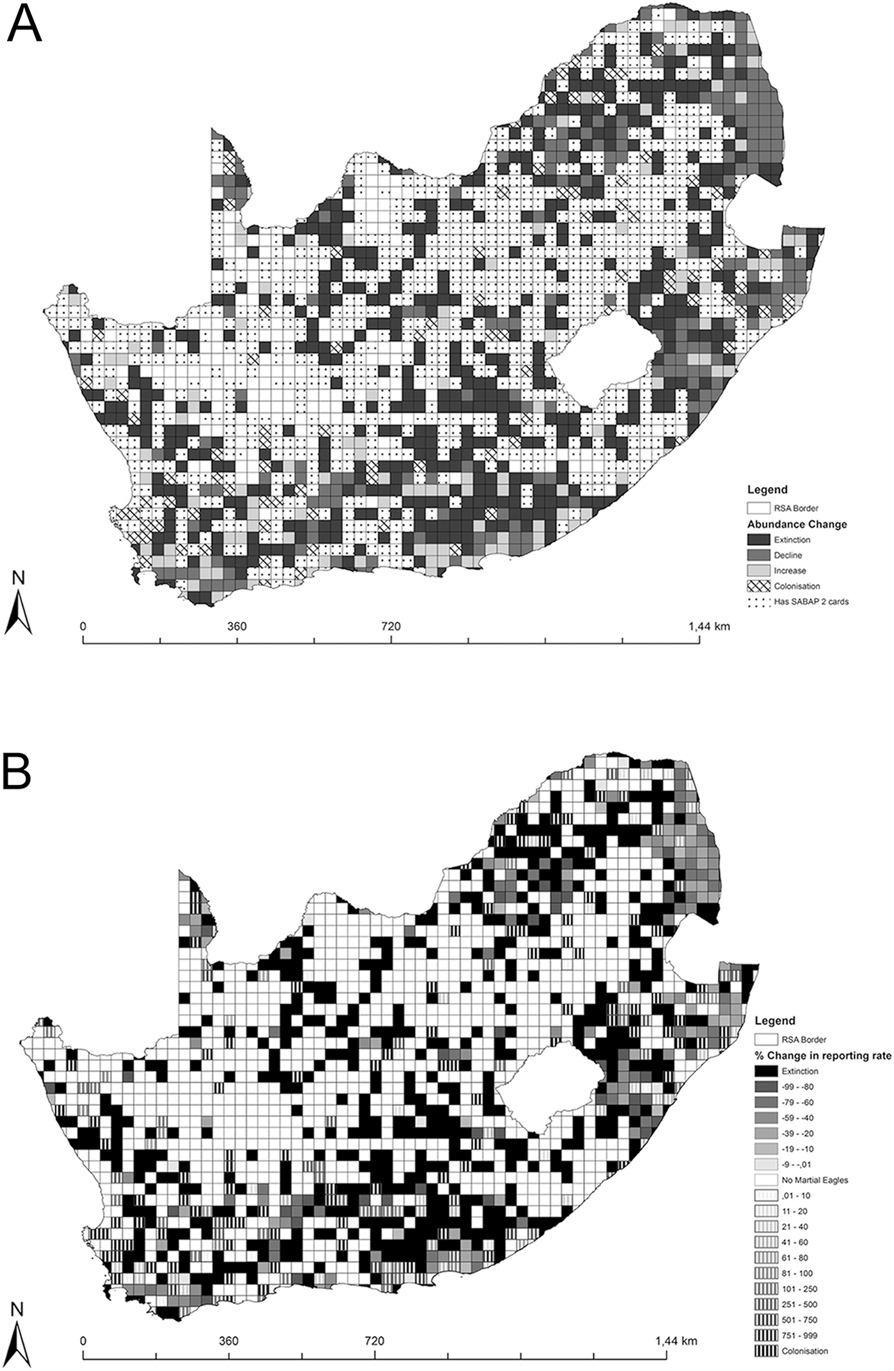
Figure 1. Map showing the Martial Eagle reporting rate changes in South Africa. Map [A] shows changes in four categories (Extinction, Decline, Increase, Colonisation) plus those squares with and without SABAP 2 cards. Map [B] shows the percentage change for each QDGC ranging from decreases being shown through the solid darker colours and increases being shown by the dashed fill. Blank cells are those which had < 5 cards submitted in either period or where Martial Eagles were not recorded in either survey period.
Across South Africa we found a significant decrease in the reporting rates of Martial Eagles between the two SABAP survey periods (mean reporting rates: SABAP 1, 7.3% (95% CI: 6.6–8%; SABAP 2, 3.0% (95% CI: 2.5–3.6%); χ2 = 83.7, df = 1, P < 0.0001). Thus, the reporting rate declined by around 59% overall across South Africa (Figure 2). No significant interaction between province and survey period was found, indicating that the changes in reporting rates for MEs between the two SABAP surveys were similar between provinces (χ2 = 10.1, df = 8, P = 0.25; Figure 3).
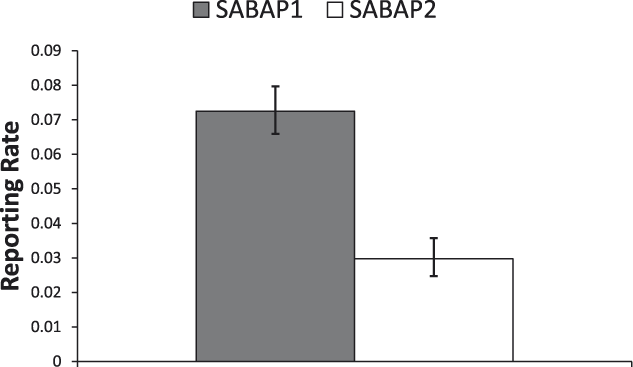
Figure 2. The overall difference in South Africa in the probability of reporting Martial Eagles between SABAP 1 (1987–1992) and SABAP 2 (2007–2012) (mean ± 95% confidence limit). Data come from the lsmeans output from the general linear model used in the analysis. Differences were highly significant (χ2 = 83.7, df = 1, P < 0.0001).
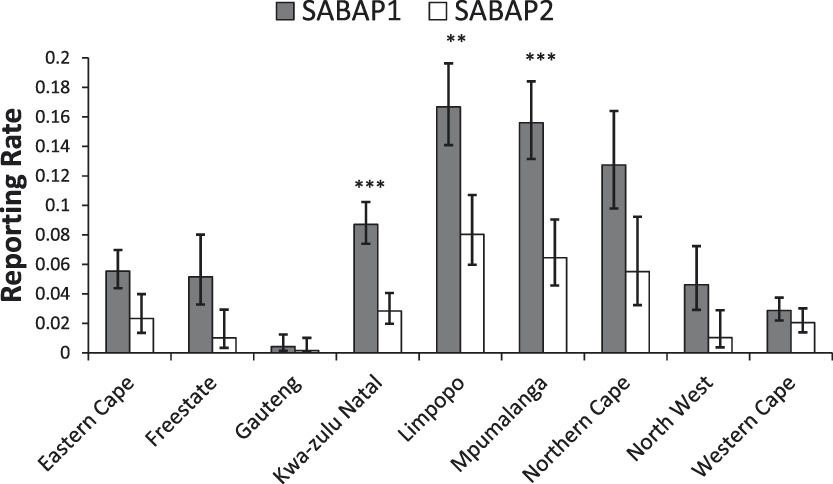
Figure 3. Reporting rates of Martial Eagles across the nine South African provinces between the SABAP projects (mean ± 95% confidence limit). Significant changes are marked as follows: *P < 0.05, **P < 0.01, ***P < 0.001.
Changes in reporting rates differed between biomes, with a significant interaction between biomes and period (Figure 4; χ2 = 25.2, df = 6, P < 0.0001). Pairwise comparisons revealed significant decreases in the Grassland (-77.9%, n = 184, t = 5.08, P < 0.001), Indian Ocean Coastal Belt (-81.5%, n = 27, t = 3.87, P < 0.001), Nama Karoo (-76%, n = 83, t = 4.36, P < 0.01) and Savanna (-60.9%, n = 289, t = 9.22, P < 0.001) biomes (Figure 4). Whereas no significant changes were found in Albany Thicket and Succulent Karoo, and non-significant increases were detected in the Fynbos biome (Figure 4).
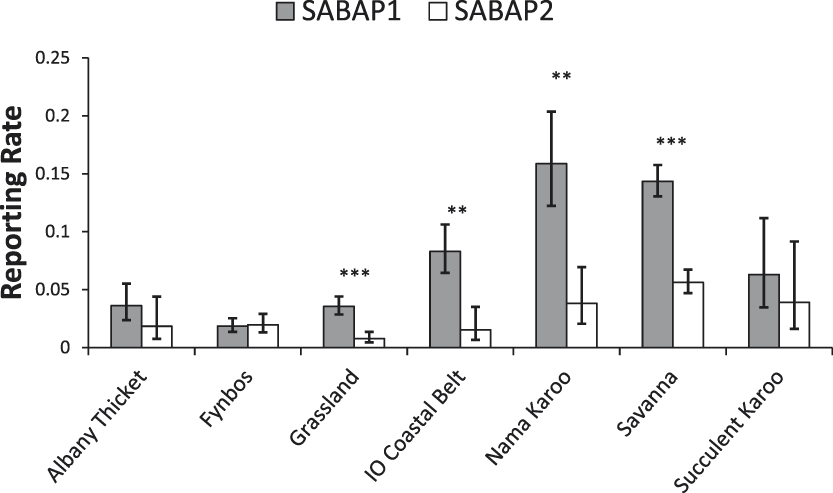
Figure 4. Reporting rates of Martial Eagles across the dominant biomes in South Africa between the SABAP projects (mean ± 95% confidence limit). Significant changes are marked as follows: *P <0 .05, **P < 0.01, ***P < 0.001. IO=Indian Ocean.
There were significant differences in the changes of reporting rates inside and outside of protected areas (Figure 5), with a significant interaction between PA status and period (χ2 = 4.3, df = 1, P < 0.05). Pairwise comparison revealed significant decreases in both areas, but with a larger decline of 64% outside of protected areas (n = 691, t = 8.39, P < 0.001) compared with a 42% decline inside protected areas (n = 79, t = 3.80, P < 0.001) (Figure 5).
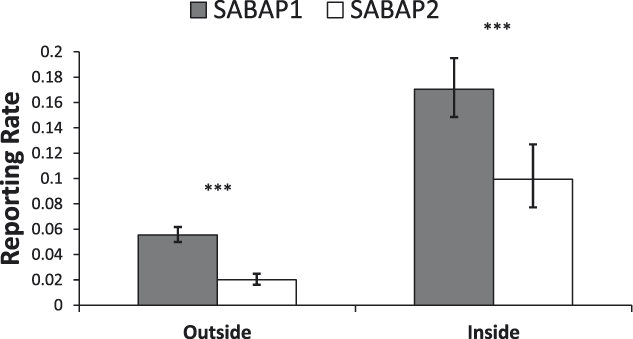
Figure 5. Reporting rates of MEs outside and inside of protected areas in South Africa between the SABAP projects (mean ± 95% confidence limit). Significant changes are marked as follows: *P < 0.05, **P < 0.01, ***P < 0.001.
We also examined changes in reporting rates inside three of South Africa’s larger protected areas. Significant declines were apparent for both Kruger and Kalahari Gemsbok National Parks, with a near significant (P < 0.1) decline for Hluhluwe-iMfolozi Park. In Kruger National Park, a decline of 54.1% was recorded dropping from on average reporting rate of 32.2% (28.2–36.5%) per QDGC during SABAP 1 to only 14.8% (11.5–18.9%) during SABAP 2. In the Kalahari National Gemsbok Park the reporting rates declined by 44% with a drop from 32.1% (25.7–39.2%) to 17.9% (11.6–26.8%), while for Hluhluwe-iMfolozi a decline of 54.4% was observed with a drop from 17.8% (10.4–28.6%) to 8.1% (3.5–17.4%) between the two SABAP projects.
Discussion
Our analysis revealed large declines in the reporting rates of Martial Eagles across South Africa, with a decline of c.60% recorded over the last two decades. Declines were apparent in most provinces and were significant in three provinces (Limpopo, Mpumalanga, KwaZulu-Natal) all of which are located in the east and northeast of the country (Figure 3). The Western Cape was the only province where there appeared to be little change or declines in reporting rates, although the reporting rate in both SABAP surveys was quite low in this region, being only around 2% (Figure 3). Differences were also found between biomes, with declines detected in all biomes, except Albany Thicket, Succulent Karroo and Fynbos biomes. These largely treeless biomes are the dominant habitats in the south-west of the country, mainly in the Western Cape and the west of the Eastern Cape.
Despite the fact that protocols changed between the two SABAP surveys, an analysis by Amar et al. (Reference Amar, Cloete and Whittington2016) suggests these changes detected between the comparisons of SABAP surveys were indeed reflective of population changes in this species, a result which has also been found for several other species (Hofmeyr Reference Hofmeyr2012, Shaw Reference Shaw2013). Thus, the declines detected by the analyses in our study are likely to represent real declines in this species, rather than simply reflecting a change in methodology.
Declines in large raptors, including eagle species, have been recorded in other areas of Africa (Thiollay Reference Thiollay2006, Virani et al. Reference Virani, Kendall, Njoroge and Thomsett2011). However, these surveys have usually relied on repeats of a limited number of road transects and therefore cover a relatively limited area. Road transects across regions in West Africa showed considerable declines in many large eagle species (Thiollay Reference Thiollay2006). For Martial Eagles, Thiollay (Reference Thiollay2006) reported the complete disappearance of Martial Eagles in Burkina Faso, Mali and Niger outside of protected areas, over a 30-year period, and a 50% decline within protected areas. However, there have been very few comprehensive national analysis of abundance changes for any raptor species in Africa (Krüger et al. Reference Krüger, Allan, Jenkins and Amar2014), and our study therefore shows the benefit of SABAP for such analyses (Cunningham et al. Reference Cunningham, Madden, Barnard and Amar2016). The findings from this analysis, together with other information at a more local scale from elsewhere in Africa, have resulted in the Martial Eagle being uplisted to ‘Vulnerable’ (BirdLife International, 2016).
One of the most important finding from this study is that reporting rates of Martial Eagles declined both inside and outside protected areas. Even within some of our larger protected parks declines were recorded, with significant declines recorded for both the Kalahari (Amar et al. Reference Amar, Cloete and Whittington2016) and Kruger National Park. However, populations within protected areas did appear to be buffered to a degree, with declines being on average 22% less within protected areas than in non-protected areas. This result suggests that the driving forces for the declines are operating both inside and outside protected areas to some degree. Given the edge effects on wide-ranging species (Woodroffe and Ginsberg Reference Woodroffe and Ginsberg1998) and the fact that this species is highly mobile and can range outside protected areas (e.g. dispersing juveniles), individuals inside protected areas will not be immune to factors operating outside of these areas (Penteriani et al. Reference Penteriani, Otalora, Sergio and Ferrer2005). Recent research has also indicated that a proportion of seemingly resident adult Martial Eagles may also make long-distance movements outside large protected areas, increasing their exposure to multiple threats that are present outside protected areas (van Eeden et al. Reference van Eeden, Whitfield, Botha and Amar2017).
Potential causes of the decline
What are the potential factors driving the decline of this species in South Africa? The lack of interaction between province and period, suggests that whatever is driving these declines is potentially happening across the country at a very large scale, rather than resulting from local processes. However, different levels of declines were detected between biomes, with lower levels of decline in the three biomes (Fynbos, Succulent Karoo and Albany Thicket) located within the extreme south-west of the country. Additionally, the lower declines within protected areas may also help identify the causes of the decline. Some of the main threats previously identified for the species include electrocution (van Rooyen and Ledger 1999, Machange et al. Reference Machange, Jenkins and Navarro2005) and human persecution (Brown Reference Brown1991), and these factors may be lower in these areas.
Recent research on this species within Kruger National Park has identified at least three birds killed by electrocution on powerlines (R. van Eeden unpubl. data), including one of eight GPS tracked birds (van Eeden et al. Reference van Eeden, Whitfield, Botha and Amar2017). However, within the west of the country the species is also known to nest on electric power lines (Boshoff Reference Boshoff1993, Machange et al. Reference Machange, Jenkins and Navarro2005, Berndt Reference Berndt2015). Indeed, Berndt (Reference Berndt2015) estimated the population nesting on the transmission network to be around 150 pairs. The sustainability of the pylon-nesting population remains unknown, in terms of either productivity or survival. For example, it could be that this population represents a sink and suffers from higher mortality rates due to increased collisions or electrocutions (Hernandez-Matias et al. 2013), although the lack of decline detected in the Western Cape (and Fynbos biome) from this study, where a large proportion of the birds nest on pylons, argues against this idea. The density of powerlines is also not noticeably lower within the south-west of the country (Cunningham et al. Reference Cunningham, Madden, Barnard and Amar2016) where we recorded lower declines of Martial Eagles. Nevertheless, powerlines have been identified as being an important factor in the mortality of large eagles elsewhere (Guil et al. Reference Guil, Fernández-Olalla, Moreno-Opo, Mosqueda, García, Aranda, Arredondo, Guzmán, Oria, Margalida and González2011, Reference Guil, Colomer, Moreno-Opo and Margalida2015, Hernández-Matías et al. 2015) and should be investigated further as to whether they are an important driver of the decline in this species.
Other known threats to the species include deliberate killing and inadvertent poisoning (Brown Reference Brown1991, Anderson Reference Anderson2000). Despite having full legal protection in South Africa, this species is known to be targeted and killed by farmers who blame the species for predation of their livestock, or may be accidentally killed by poison left to kill other predator species (Anderson Reference Anderson2000). Perhaps the type of farming within the south-west of the country (mainly arable crops and large scale extensive sheep farming) means that the species is less persecuted. Poisoning has been flagged as one of the main drivers of vulture declines, currently occurring throughout Africa (Ogada et al. Reference Ogada, Shaw, Beyers, Buij, Murn, Thiollay, Beale, Holdo, Pomeroy, Baker, Krüger, Botha, Virani, Monadjem and Sinclair2015) and these same drivers are likely to be affecting other large eagles as well. Illegal killing and poisoning have certainly featured prominently in the declines of large raptor in other parts of the world (Margalida Reference Margalida2010, Smart et al. Reference Smart, Amar, Sim, Etheridge, Cameron, Christie and Wilson2010). The species may also be deliberately killed for the use of its body parts in traditional medicine (Msimanga Reference Msimanga2016).
Conclusions
Despite different levels of declines in some biomes and between protected and non-protected areas, the differences between these areas and areas with larger declines are not obvious, and so the likely driving mechanism behind these declines remains unexplained. Future research should focus specifically on identifying the main threats to adult and juvenile survival and on which factors influence breeding productivity. These questions are currently the focus of ongoing research in Kruger National Park (van Eeden et al. Reference van Eeden, Whitfield, Botha and Amar2017) and future research should also extend these questions to other regions, including non-declining regions. Such research would then allow a meaningful Population Viability Analysis to be undertaken to identify the key demographic features driving the decline.
The study shows the value of using SABAP data to quantify changes in abundance of bird species across South Africa. Other studies have explored changes in species abundance in relation to covariates (Cunningham et al. Reference Cunningham, Madden, Barnard and Amar2016) and such an exercise could be valuable for this and other declining species to identify the potential drivers of change. Future research is urgently required to identify which demographic parameters might be responsible for the population declines described in this study, in order to allow appropriate conservation actions to be implemented to reverse or arrest the decline of this apex predator. Such work is currently being undertaken in Kruger National Park, which is regarded as a stronghold of the South African population (Herholdt and Kemp Reference Herholdt and Kemp1997).
These results contribute to the growing appreciation that many populations of African animal species are declining (Thiollay Reference Thiollay2006, Ogada et al. Reference Ogada, Shaw, Beyers, Buij, Murn, Thiollay, Beale, Holdo, Pomeroy, Baker, Krüger, Botha, Virani, Monadjem and Sinclair2015). Unfortunately, unlike many other more developed regions of the world (Magurran et al. Reference Magurran, Baillie, Buckland, Dick, Elston, Scott, Smith, Somerfield and Watt2010), wildlife monitoring programmes at a national scale are rare in African countries. The results from this study show the value of such surveys in an African context and should be encouraged in other African countries to allow further comprehensive monitoring of changes in wildlife populations to be undertaken.
Acknowledgements
Thomas Slingsby and Nicholas Lingenberg from the GIS support lab at UCT are thanked for their assistance in processing and preparing the spatial data for this project. Thanks also to Dr Doug Harebottle and his South African Birding Atlas Project colleagues from the Animal Demography Unit, UCT, for providing the core datasets that made this project possible. Thanks to Chrissie Madden and Rowen van Eeden for help and advice.


