Skip to main content Accessibility help
×
Hostname: page-component-cd9895bd7-gvvz8 Total loading time: 0 Render date: 2024-12-27T06:46:21.915Z Has data issue: false hasContentIssue false

References and Further Reading

Published online by Cambridge University Press:  21 May 2024

Stephen Burt
Affiliation:
Fellow of the Royal Meteorological Society
Get access

Summary

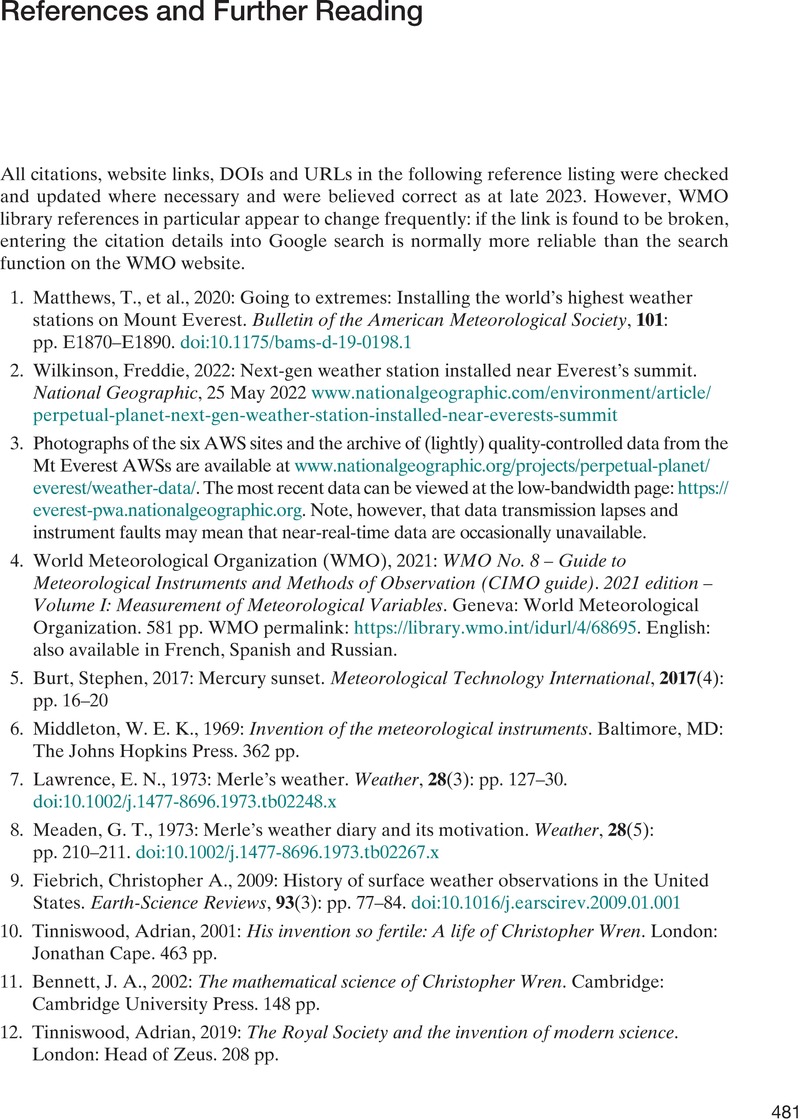
Image of the first page of this content. For PDF version, please use the ‘Save PDF’ preceeding this image.'
Type
Chapter
Information
Publisher: Cambridge University Press
Print publication year: 2024

Access options

Get access to the full version of this content by using one of the access options below. (Log in options will check for institutional or personal access. Content may require purchase if you do not have access.)

References

References and Further Reading

Matthews, T., et al., 2020: Going to extremes: Installing the world’s highest weather stations on Mount Everest. Bulletin of the American Meteorological Society, 101: pp. E1870E1890. doi:10.1175/bams-d-19-0198.1CrossRefGoogle Scholar
Wilkinson, Freddie, 2022: Next-gen weather station installed near Everest’s summit. National Geographic, 25 May 2022 www.nationalgeographic.com/environment/article/perpetual-planet-next-gen-weather-station-installed-near-everests-summitGoogle Scholar
Photographs of the six AWS sites and the archive of (lightly) quality-controlled data from the Mt Everest AWSs are available at www.nationalgeographic.org/projects/perpetual-planet/everest/weather-data/. The most recent data can be viewed at the low-bandwidth page: https://everest-pwa.nationalgeographic.org. Note, however, that data transmission lapses and instrument faults may mean that near-real-time data are occasionally unavailable.Google Scholar
World Meteorological Organization (WMO), 2021: WMO No. 8 – Guide to Meteorological Instruments and Methods of Observation (CIMO guide). 2021 edition – Volume I: Measurement of Meteorological Variables. Geneva: World Meteorological Organization. 581 pp. WMO permalink: https://library.wmo.int/idurl/4/68695. English: also available in French, Spanish and Russian.Google Scholar
Burt, Stephen, 2017: Mercury sunset. Meteorological Technology International, 2017(4): pp. 1620Google Scholar
Middleton, W. E. K., 1969: Invention of the meteorological instruments. Baltimore, MD: The Johns Hopkins Press. 362 pp.Google Scholar
Lawrence, E. N., 1973: Merle’s weather. Weather, 28(3): pp. 127–30. doi:10.1002/j.1477-8696.1973.tb02248.xGoogle Scholar
Meaden, G. T., 1973: Merle’s weather diary and its motivation. Weather, 28(5): pp. 210211. doi:10.1002/j.1477-8696.1973.tb02267.xCrossRefGoogle Scholar
Fiebrich, Christopher A., 2009: History of surface weather observations in the United States. Earth-Science Reviews, 93(3): pp. 7784. doi:10.1016/j.earscirev.2009.01.001CrossRefGoogle Scholar
Tinniswood, Adrian, 2001: His invention so fertile: A life of Christopher Wren. London: Jonathan Cape. 463 pp.Google Scholar
Bennett, J. A., 2002: The mathematical science of Christopher Wren. Cambridge: Cambridge University Press. 148 pp.Google Scholar
Tinniswood, Adrian, 2019: The Royal Society and the invention of modern science. London: Head of Zeus. 208 pp.Google Scholar
Gribbin, John, 2006: The fellowship: The story of the Royal Society and a scientific revolution. London: Allen Lane. 336 pp.Google Scholar
Mills, A., 2009: Dr Hooke’s ‘Weather-Clock’ and its self-emptying bucket. Bulletin of the Scientific Instrument Society, 102: pp. 2930: see also Mihailescu, I., 2021: Graphical details: the secret life of Christopher Wren’s drawing of the weather clock. Notes and Records of the Royal Society, 77: pp. 355–378Google Scholar
Folland, C. K. and Wales-Smith, B. G., 1977: Richard Towneley and 300 years of regular rainfall measurement. Weather, 32(12): pp. 438445. doi:10.1002/j.1477-8696.1977.tb04501.xCrossRefGoogle Scholar
Biswas, A. K., 1967: The automatic rain-gauge of Sir Christopher Wren, F.R.S. Notes and Records of the Royal Society of London, 22(1): pp. 94104. doi:10.1098/rsnr.1967.0009Google Scholar
Inwood, Stephen, 2002: The man who knew too much: The strange and inventive life of Robert Hooke 1635–1703. London: Macmillan. 497 pp.Google Scholar
Bennett, J. A., 1980: Robert Hooke as mechanic and natural philosopher. Notes and Records of the Royal Society of London, 35(1): pp. 3348. doi:10.1098/rsnr.1980.0003Google Scholar
Austin, Jillian F. and McConnell, Anita, 1980: James Six F.R.S.: Two hundred years of the Six’s self-registering thermometer. Notes and Records of the Royal Society of London, 35(1): pp. 4965Google Scholar
Hamblyn, Richard, 2001: The invention of clouds: How an amateur meteorologist forged the language of the skies. New York: Farrar, Straus and Giroux. 403 pp.Google Scholar
Blench, B. J. R., 1963: Luke Howard and his contribution to meteorology. Weather, 18(3): pp. 8392. doi:10.1002/j.1477-8696.1963.tb01977.xCrossRefGoogle Scholar
Details of the Alexander Cumming barometer in the Royal Collection, including photographs and a full description, can be found online at www.royalcollection.org.uk/eGallery. King George III paid the enormous sum of £1,178 for this instrument in 1763, to which he added a payment of £150 and an annual retainer to Cumming of £37 10s for maintaining the barograph. The king kept the Cumming barograph with the Pinchbeck astronomical clock in the Passage Room of his apartments at Buckingham House; today it is displayed in the Throne Room at Buckingham Palace. Luke Howard’s instrument is in the Science Museum in London.Google Scholar
Middleton, W. E. K., 1966: A history of the thermometer and its use in meteorology. Baltimore, MD: Johns Hopkins Press. 249 pp. Historical details regarding aspirated thermometers are given on pp. 234238. Middleton rightly credits the pioneering work of Aitken and Assman in the 1880s, who were more than a century ahead of their time in this area.CrossRefGoogle Scholar
Bathurst, Bella, 1999: The Lighthouse Stevensons. London: HarperCollins. 284 pp.Google Scholar
Morrison-Low, A. D., 2010: Northern Lights: The age of Scottish lighthouses. Edinburgh: NMSE Publishing Ltd. 262 pp.Google Scholar
Stevenson, Thomas, 1864: New description of box for holding thermometers. Journal of the Scottish Meteorological Society, 1: p. 122.Google Scholar
Burt, Stephen, 2013: An unsung hero in meteorology: Charles Higman Griffith (1830–1896). Weather, 68(5): pp. 135138. doi:10.1002/wea.2059CrossRefGoogle Scholar
Council of the Royal Meteorological Society, 1884: Report of the Council for the year 1883: Appendix 1, Report of the thermometer screen committee. Quarterly Journal of the Royal Meteorological Society, 10(50): pp. 9294. doi:10.1002/qj.4970105003Google Scholar
Multhauf, R. P., 1961: The introduction of self-registering meteorological instruments. Washington DC: United States National Museum Bulletin, 228: pp. 95116. Multhauf made the interesting speculation that the technology of the 1880s (mechanical sensors, levers to magnify small movements and a clock mechanism to drive a paper chart) was largely available in the 1660s, and that Hooke could probably have built a ‘modern’ clock-driven single-element recorder, such as a thermograph, had he instead progressed his ideas along those lines.Google Scholar
Strangeways, I. C. and Smith, S. W., 1985: Development and use of automatic weather stations. Weather, 40(9): pp. 277285 . doi:10.1002/j.1477-8696.1985.tb06900.xCrossRefGoogle Scholar
Camuffo, Dario and Bertolin, Chiara, 2012: The earliest temperature observations in the world: the Medici Network (1654–1670). Climatic Change, 111(2): pp. 335363. doi:10.1007/s10584-011-0142-5CrossRefGoogle Scholar
Camuffo, D., Bertolin, C., Jones, P. D., Cornes, R. and Garnier, E., 2010: The earliest daily barometric pressure readings in Italy: Pisa AD 1657–1658 and Modena AD 1694, and the weather over Europe. The Holocene, 20(3): pp. 337349CrossRefGoogle Scholar
Cornes, Richard C., et al., 2012: A daily series of mean sea-level pressure for Paris, 1670–2007. International Journal of Climatology, 32(8): pp. 11351150 doi:10.1002/joc.2349.CrossRefGoogle Scholar
Cornes, Richard C., et al., 2012: A daily series of mean sea-level pressure for London, 1692–2007. International Journal of Climatology, 32(5): pp. 641656. doi:10.1002/joc.2301: also Cornes, Richard C., et al., 2023: The London, Paris and De Bilt sub‐daily pressure series. Geoscience Data Journal., online version doi: 10.1002/gdj3.226CrossRefGoogle Scholar
Manley, Gordon, 1953: The mean temperature of central England, 1698–1952. Quarterly Journal of the Royal Meteorological Society, 79(342): pp. 558567 doi:10.1002/qj.49707934222CrossRefGoogle Scholar
Manley, Gordon, 1974: Central England temperatures: Monthly means 1659 to 1973. Quarterly Journal of the Royal Meteorological Society, 100(425): pp. 389405 doi:10.1002/qj.49710042511CrossRefGoogle Scholar
The Central England Temperature (CET) database and the England and Wales Precipitation (EWP) series (and others) are available from the Hadley Centre website: metoffice.gov.uk/hadobs/index.htmlGoogle Scholar
Parker, D. E., Legg, T. P., and Folland, C. K., 1992: A new daily central England temperature series, 1772–1991. International Journal of Climatology, 12(4): pp. 317342. doi:10.1002/joc.3370120402CrossRefGoogle Scholar
For more information on the Centennial Observing Stations and an updated list (nominations are sought and reviewed every two years), see https://wmo.int/centennial-observing-stationsGoogle Scholar
Bergström, Hans and Moberg, Anders, 2002: Daily air temperature and pressure series for Uppsala (1722–1998). Climatic Change, 53(1): pp. 213252 doi:10.1023/a:1014983229213. Further information is available on the University of Uppsala’s website at www.uu.se/en/about-uu/celsius-300CrossRefGoogle Scholar
Burt, Stephen, 2023: The Celsius Symposium: 300 years of weather statistics. Weather, 78(1): pp. 3031 doi:10.1002/wea.4325CrossRefGoogle Scholar
Cocheo, Claudio and Camuffo, Dario, 2002: Corrections of systematic errors and data homogenisation in the daily temperature Padova series (1725–1998). Climatic Change, 53(1): pp. 77100CrossRefGoogle Scholar
Moberg, Anders and Bergström, Hans, 1997: Homogenization of Swedish temperature data. Part III: the long temperature records from Uppsala and Stockholm. International Journal of Climatology, 17(7): pp. 667-699 doi: 10.1002/(SICI)1097-0088(19970615)17:7<667::AID-JOC115>3.0.CO;2-J. Also: Moberg, Anders, et al., 2002: Daily Air Temperature and Pressure Series for Stockholm (1756–1998). Climatic Change, 53(1): pp. 171–212 doi: 10.1023/A:1014966724670.CrossRefGoogle Scholar
Böhm, Reinhard, et al., 2010: Early instrumental warm-bias: a solution for long central European temperature series 1760–2007. Climatic Change, 101(1–2): pp. 4167. doi:10.1007/s10584-009-9649-4CrossRefGoogle Scholar
Maugeri, Maurizio, Buffoni, Letizia, and Chlistovsky, Franca, 2002: Daily Milan temperature and pressure series (1763–1998): History of the observations and data and metadata recovery. Climatic Change, 53(1): pp. 101117. doi:10.1023/A:1014970825579CrossRefGoogle Scholar
Maugeri, M., et al., 2002: Daily Milan temperature and pressure series (1763–1998): Completing and homogenising the data. Climatic Change, 53: pp. 119149CrossRefGoogle Scholar
Czech Hydrometeorological Institute. Meteorological observations at the Prague Clementinum. Available from: http://portal.chmi.cz/historicka-data/pocasi/praha-klementinum?l=enGoogle Scholar
Prague Klementinum details – on the Czech Hydrometeorological Institute site at www.chmi.cz/historicka-data/pocasi/praha-klementinum?l=enGoogle Scholar
Winkler, P., 2009: Revision and necessary correction of the long-term temperature series of Hohenpeissenberg, 1781–2006. Theoretical and Applied Climatology, 98(3): pp. 259268 doi: 10.1007/s00704-009-0108-y.CrossRefGoogle Scholar
Deutscher Wetterdienst. Meteorological Observatory Hohenpeissenberg. Available from: www.dwd.de/EN/aboutus/locations/observatories/mohp/mohp.htmlGoogle Scholar
Pappert, Duncan, et al., 2021: Unlocking weather observations from the Societas Meteorologica Palatina (1781–1792). Climate of the Past, 17(6): pp. 23612379 doi:10.5194/cp-17-2361-2021CrossRefGoogle Scholar
Bennett, J. A., 1990: Church, state and astronomy in Ireland: 200 years of Armagh Observatory. Armagh: The Armagh Observatory. 277 pp.Google Scholar
Butler, C. J., et al., 2005: Air temperatures at Armagh Observatory, Northern Ireland, from 1796 to 2002. International Journal of Climatology, 25(8): pp. 10551079. doi:10.1002/joc.1148CrossRefGoogle Scholar
Butler, C. J. and García-Suárez, A. M., 2012: Relative humidity at Armagh Observatory, 1838–2008. International Journal of Climatology, 32(5): pp. 657668. doi:10.1002/joc.2302CrossRefGoogle Scholar
Butler, John and Hoskin, Michael, 1987: The archives of Armagh Observatory. Journal for the History of Astronomy, 18: pp. 295307. (List of meteorological records on page 9 of the paper.)CrossRefGoogle Scholar
Guest, Ivor, 1991: Dr John Radcliffe and his Trust. London: The Radcliffe Trust. 595 pp. PDF copy available from The Radcliffe Trust websiteGoogle Scholar
Burt, Stephen and Burt, Timothy, 2019: Oxford weather and climate since 1767. Oxford: Oxford University Press. 544 pp.CrossRefGoogle Scholar
Burt, Stephen, 2021: Two hundred years of thunderstorms in Oxford. Weather, 76: pp. 212222. doi:10.1002/wea.3884CrossRefGoogle Scholar
Wallace, J. G., 1997: Meteorological observations at the Radcliffe Observatory, Oxford: 1815–1995. Oxford: University of Oxford – School of Geography. 77 pp.Google Scholar
Manley, Gordon, 1941: The Durham meteorological record, 1847–1940. Quarterly Journal of the Royal Meteorological Society, 67(292): pp. 363380. doi:10.1002/qj.49706729209CrossRefGoogle Scholar
Burt, Stephen and Burt, Timothy, 2022: Durham weather and climate since 1841. Oxford: Oxford University Press. 580 pp.CrossRefGoogle Scholar
Details of the Minneapolis records can be found at www.climatestations.com/minneapolis-2Google Scholar
Slonosky, Victoria, 2018: Climate in the age of empire: weather observers in colonial Canada. American Meteorological Society, Boston, MA. 325 pp.Google Scholar
Slonosky, Victoria C., 2015: Daily minimum and maximum temperature in the St Lawrence Valley, Quebec: two centuries of climatic observations from Canada. International Journal of Climatology, 35(7): pp. 16621681. doi:10.1002/joc.4085CrossRefGoogle Scholar
Details of the New York Central Park historical records can be found at www.weather.gov/okx/CentralParkHistoricalGoogle Scholar
The Blue Hill Meteorological Observatory website contains much interesting information about the Observatory and its climate record since 1885: see https://bluehill.org/climate-weather.Google Scholar
Wang, Pao K. and De’er, Zhang, 1988: An introduction to some historical governmental weather records of China. Bulletin of the American Meteorological Society, 69(7): pp. 753758. doi:10.1175/1520-0477(1988)069<0753:aitshg>2.0.co;22.0.CO;2>CrossRefGoogle Scholar
Brönnimann, Stefan, et al., 2019: Unlocking Pre-1850 instrumental meteorological records: A global inventory. Bulletin of the American Meteorological Society, 100(12): pp. ES389–ES413. doi:10.1175/bams-d-19-0040.1CrossRefGoogle Scholar
Ren, Yuyu, Guoyu Ren, Rob Allan, Jiao Li et al., 2022: The 1757–62 temperature observed in Beijing. Bulletin of the American Meteorological Society, 103(11): pp. E2470E2483. doi:10.1175/bams-d-21-0245.1CrossRefGoogle Scholar
Ashcroft, Linden, 2018: Meteorology at Sydney Observatory, in The story of Sydney Observ-atory. Ultimo, New South Wales, Australia: Museum of Applied Arts and Sciences. 61 pp.Google Scholar
Ashcroft, Linden, et al., 2021: The world’s longest known parallel temperature dataset: A comparison between daily Glaisher and Stevenson screen temperature data at Adelaide, Australia, 1887–1947. International Journal of Climatology. doi:10.1002/joc.7385CrossRefGoogle Scholar
Gergis, Joëlle, et al., 2021: A historical climate dataset for southwestern Australia, 1830–1875. International Journal of Climatology, 41(10): pp. 48984919. doi:10.1002/joc.7105CrossRefGoogle Scholar
Diamond, Howard J., et al., 2013: US Climate Reference Network after one decade of operations: Status and assessment. Bulletin of the American Meteorological Society, 94(4): pp. 485498. doi:10.1175/bams-d-12-00170.1CrossRefGoogle Scholar
Hubbard, K. G., Lin, X., and Baker, C. B., 2005: On the USCRN temperature system. Journal of Atmospheric and Oceanic Technology, 22: pp. 10951100CrossRefGoogle Scholar
Hubbard, K. G., et al., 2004: Air temperature comparison between the MMTS and the USCRN temperature systems. Journal of Atmospheric and Oceanic Technology, 21: pp. 159015972.0.CO;2>CrossRefGoogle Scholar
Body, D. and Kuik, F., 2021: Generic Automatic Weather Station (AWS) tender specifications. Geneva: World Meteorological Organization (WMO). Available from https://library.wmo.int/records/item/57830-generic-automatic-weather-station-aws-tender-specifications.Google Scholar
Vuerich, E., et al., 2009: WMO field intercomparison of rainfall intensity gauges. Geneva, Switzerland: World Meteorological Organization: Instruments and observing methods report no. 99, WMO/TD‐No. 1504. Available from https://library.wmo.int/records/item/50453-wmo-field-intercomparison-of-rainfall-intensity-gauges. 290 pp.Google Scholar
Coney, Jonathan, et al., 2022: How useful are crowdsourced air temperature observations? An assessment of Netatmo stations and quality control schemes over the United Kingdom. Meteorological Applications, 29(3): doi:10.1002/met.2075CrossRefGoogle Scholar
Burt, Stephen. 2013: User review of the Davis Vantage Vue automatic weather station. Available from: www.measuringtheweather.netGoogle Scholar
Burt, Stephen. 2009: User review of the Davis Vantage Pro2 automatic weather station. Available from: www.measuringtheweather.netGoogle Scholar
Sun, B., et al., 2005: A comparative study of ASOS and USCRN temperature measurements. Journal of Atmospheric and Oceanic Technology, 22(6): pp. 679686. doi:10.1175/jtech1752.1CrossRefGoogle Scholar
More information, and access to current USCRN observations, is available at www.ncei.noaa.gov/access/crn/.Google Scholar
Leeper, Ronald D., Rennie, Jared, and Palecki, Michael A., 2015: Observational perspectives from U.S. Climate Reference Network (USCRN) and Cooperative Observer Program (COOP) network: Temperature and precipitation comparison. Journal of Atmospheric and Oceanic Technology, 32(4): pp. 703721. doi:10.1175/jtech-d-14-00172.1CrossRefGoogle Scholar
Trewin, B. 2018: Station catalogue – Australian Climate Observations Reference Network – Surface Air Temperature (ACORN-SAT). Available from www.bom.gov.au/metadata/catalogue/19115/ANZCW0503900725Google Scholar
Ren, Yuyu and Ren, Guoyu, 2011: A remote-sensing method of selecting reference stations for evaluating urbanization effect on surface air temperature trends. Journal of Climate, 24(13): pp. 31793189. doi:10.1175/2010jcli3658.1CrossRefGoogle Scholar
Strangeways, Ian, 2015: A global climate reference network. Weather, 70(4): pp. 124129 doi:10.1002/wea.2460CrossRefGoogle Scholar
Thorne, P. W., et al., 2018: Towards a global land surface climate fiducial reference measurements network. International Journal of Climatology, 38(6): pp. 27602774. doi:10.1002/joc.5458CrossRefGoogle Scholar
Doesken, N., 2005: The National Weather Service MMTS (Maximum-Minimum Temperature System) – 20 years after, in American Meteorological Society conference papers – available online at ams.confex.com/ams/pdfpapers/91613.pdfGoogle Scholar
Quayle, Robert G., et al., 1991: Effects of recent thermometer changes in the cooperative station network. Bulletin of the American Meteorological Society, 72(11): pp. 17181723. doi:10.1175/1520-0477(1991)072<1718:EORTCI>2.0.CO;22.0.CO;2>CrossRefGoogle Scholar
The data for Table 4.2 came from NCEI’s HOMR database, March 2023 (with grateful thanks to Shelley McNeill, NOAA). Lists of current stations can be extracted from the website www.ncei.noaa.gov/access/homr. Of the 4,472 ‘temperature’ sites listed in Table 4.2, 89% are MMTS sites suggesting that the remainder (11%, 495 sites) continue to use Cotton Region Shelters (CRS). Unsurprisingly, this represents a continuing decline from 31% in February 2009 (data from that date from the website weather.gov/coop) when there were 4,300 listed sites within the continental United States, of which 1,337 were CRS sites (namely 31%).Google Scholar
Meyer, Steven J. and Hubbard, Kenneth G., 1992: Nonfederal automated weather stations and networks in the United States and Canada: A preliminary survey. Bulletin of the American Meteorological Society, 73(4): pp. 449457. doi:10.1175/1520-0477(1992)073<0449:nawsan>2.0.co;22.0.CO;2>CrossRefGoogle Scholar
Mahmood, Rezaul, et al., 2019: A technical overview of the Kentucky Mesonet. Journal of Atmospheric and Oceanic Technology, 36(9): pp. 17531771. doi:10.1175/jtech-d-18-0198.1CrossRefGoogle Scholar
Mahmood, Rezaul, et al., 2020: The Total Solar Eclipse of 2017: Meteorological observations from a statewide mesonet and atmospheric profiling systems. Bulletin of the American Meteorological Society, 101(6): pp. E720E737. doi:10.1175/BAMS-D-19-0051.1CrossRefGoogle Scholar
Details of the Met Office land surface observing network, and a map of the locations, is available at www.metoffice.gov.uk/weather/guides/observations/uk-observations-networkGoogle Scholar
Details of the Met Office synoptic and climate station network, including map of the locations and a table of their location, is available at www.metoffice.gov.uk/research/climate/maps-and-data/uk-synoptic-and-climate-stationsGoogle Scholar
A list of, and links to, the world’s national weather services is available on the WMO website: https://community.wmo.int/membersGoogle Scholar
Preston-Thomas, H., 1990: International Practical Temperature Scale of 1990. Metrologia, 27: pp. 310CrossRefGoogle Scholar
The basic requirements were set out over a century ago: see, for example, Gaster, F. (1882) Report on experiments made at Strathfield Turgiss in 1869 with stands or screens of various patterns, devised and employed for the exposing of thermometers, in order to determine the temperature of the air. Quarterly Weather Report for 1879, Meteorological Office, London: also Köppen, W. (1913) Uniform thermometer set-up for meteorological stations for the determination of air temperature and humidity. Meteorol. Zeitschr., 30, pp. 474–88 and 514–23: English translation in Monthly Weather Review, August 1915.Google Scholar
Foken, Thomas, ed. 2022. Springer handbook of atmospheric measurements. doi:10.1007/978-3-030-52171-4. Springer International Publishing, 1748 pp.Google Scholar
Park, Jae-Woo, et al., 2022: Air temperature dependencies on the structure of thermometer screens in summer at Daejeon, South Korea. Meteorological Applications, 29(3): doi: 10.1002/met.2064.CrossRefGoogle Scholar
Barnett, A., Hatton, D. B., and Jones, D. W., 1998: Recent changes in thermometer [screen] design and their impact. World Meteorological Organization, Geneva: Instruments and Observing Methods Report no. 66Google Scholar
Strangeways, Ian, 2010: Measuring global temperatures: Their analysis and interpretation. Cambridge: Cambridge University Press.Google Scholar
Oke, T. R., et al., 2017: Urban Climates, in Urban Climates: Cambridge: Cambridge University Press. 525 pp.CrossRefGoogle Scholar
Chandler, T. J., 1965: The climate of London. London: Hutchinson. 292 pp.Google Scholar
Sparks, W. R. 1972: The effect of thermometer screen design on the observed temperature. World Meteorological Organization, Geneva, Publication No. 315. Available online at https://library.wmo.int/doc_num.php?explnum_id=8131Google Scholar
International Organization for Standardization (ISO), 2007: ISO 17714 Meteorology – Air temperature measurements – Test methods for comparing the performance of thermometer shields/screens and defining important characteristics. Geneva: International Organization for Standardization (ISO)Google Scholar
Gaster, Frederick, 1882: Report on experiments made at Strathfield Turgiss in 1869 with stands or screens of various patterns, devised and employed for the exposing of thermometers, in order to determine the temperature of the air. Meteorological Office Quarterly Weather Report, Addendum for 1879 [dated May 1880, published 1882].Google Scholar
Bilham, E. G., 1937: A screen for sheathed thermometers. Quarterly Journal of the Royal Meteorological Society, 63(271): pp. 309322. doi:10.1002/qj.49706327104CrossRefGoogle Scholar
Specifications and drawings to construct Cotton Region shelters are available at several places on the web – try https://drive.google.com/drive/folders/1vHg5oUZMQ5iqmM2iC73PK70dMQiZ4qaQ?usp=sharing. Cotton Region Shelters come in ‘medium’ and ‘large’ sizes, the main difference being that the large size usually had a wooden post on which the maximum and minimum thermometers were mounted, with a baffle within the shelter to avoid the readings being affected by the aspirator fan used to ventilate the dry and wet bulb thermometers (source: Grant Goodge, ex NOAA, personal communication March 2023). In the US, NovaLynx sell self-assembly Cotton Region shelter kits (Small Instrument shelter, model no. 380–601 and Large, model no. 380–605) – see https://novalynx.com/brochures/380-shelters.pdf. A copy of the 1960 Met Office/HMSO publication Instructions for making thermometer screens of the Stevenson type (Met O No. 670, 19 pages) is available online from the National Meteorological Library: www.metoffice.gov.uk/research/library-and-archive, item Miscellaneous Met Office Publications METDLA/3/4. Another option, with less complicated carpentry involved, is described in McConnell, D. (1988) Making a simple thermometer screen. Weather, 43, pp. 198–203; other do-it-yourself plans can be found on the web.Google Scholar
Perry, M. C., Prior, M. J., and Parker, D. E., 2007: An assessment of the suitability of a plastic thermometer screen for climatic data collection. International Journal of Climatology, 27(2): pp. 267276. doi:10.1002/joc.1381CrossRefGoogle Scholar
Hubbard, K.G., Lin, X., and Walter-Shea, E.A., 2001: The effectiveness of the ASOS, MMTS, Gill, and CRS air temperature radiation shields. Journal of Atmospheric and Oceanic Technology, 18: pp. 8518642.0.CO;2>CrossRefGoogle Scholar
Burt, Stephen, 2022: Measurements of natural airflow within a Stevenson screen and its influence on air temperature and humidity records. Geoscientific Instrumentation, Methods and Data Systems, 11(2): pp. 263277. doi:10.5194/gi-11-263-2022CrossRefGoogle Scholar
Burt, Stephen and de Podesta, Michael, 2020: Response times of meteorological air temperature sensors. Quarterly Journal of the Royal Meteorological Society, 146: pp. 27892800. doi:10.1002/qj.3817CrossRefGoogle Scholar
Harrison, R. G., 2010: Natural ventilation effects on temperatures within Stevenson screens. Quarterly Journal of the Royal Meteorological Society, 136(646): pp. 253259. doi:10.1002/qj.537CrossRefGoogle Scholar
Lopardo, G., et al., 2014: Comparative analysis of the influence of solar radiation screen ageing on temperature measurements by means of weather stations. International Journal of Climatology, 34(4): pp. 12971310. doi:10.1002/joc.3765CrossRefGoogle Scholar
Harrison, R. G., 2011: Lag-time effects on a naturally ventilated large thermometer screen. Quarterly Journal of the Royal Meteorological Society, 137(655): pp. 402408. doi:10.1002/qj.745CrossRefGoogle Scholar
Richardson, Scott J., et al., 1999: Minimizing errors associated with multiplate radiation shields. Journal of Atmospheric and Oceanic Technology, 16(11): pp. 18621872. doi:10.1175/1520-0426(1999)016<1862:meawmr>2.0.co;22.0.CO;2>CrossRefGoogle Scholar
Differences in air temperature between identical sensors housed in a Stevenson screen and an aspirated radiation shelter (RM Young model 43502). Daylight only, 10 year period (49 853 hourly observations) at Stratfield Mortimer Observatory in southern England (51°N, 1°W), minimum class size 5 entriesGoogle Scholar
Aitken, John, 1884: Thermometer screens. Proceedings of the Royal Society of Edinburgh, 12: pp. 661696CrossRefGoogle Scholar
Aitken, John, 1913: The Stevenson screen. Symons’s Meteorological Magazine, 48: pp. 232233Google Scholar
Miller, Samuel H., 1877: On the aspiration of the dry and wet bulb thermometers. Quarterly Journal of the Royal Meteorological Society, 3(19): pp. 150158. doi:10.1002/qj.4970031906.CrossRefGoogle Scholar
Assmann, Richard, 1887: Das Aspirationspsychrometer, ein neuer Apparat zur Ermittlung der wahren Temperatur und Feuchtigkeit der Luft. Wetter, 4: pp. 245286Google Scholar
Daily maximum, minimum and mean daily temperatures over the period midnight to midnight UTC from calibrated platinum resistance sensors in adjacent RM Young and Apogee aspirated radiation shields were logged over the two year period November 2016 to December 2018 (765 daily observations) at Stratfield Mortimer Observatory in southern England (51°N, 1°W)Google Scholar
Lacombe, M., D. Bousri, M. Leroy and M. Mezred, 2011: Instruments and observing methods report no. 106: WMO field intercomparison of thermometer screens/shields and humidity measuring instruments, Ghardaïa, Algeria, November 2008 – October 2009. Instruments and Observing Methods Report No. 106, WMO/TD-No. 1579. Geneva: World Meteorological Organization (WMO) https://library.wmo.int/records/item/50488-wmo-field-intercomparison-of-thermometer-screens-shields-and-humidity-measuring-instruments.Google Scholar
Apogee Instruments aspirated radiation shield: www.apogeeinstruments.com/aspirated-radiation-shieldGoogle Scholar
One minute mean temperatures in a Stevenson screen and nearby aspirated screen observed at Stratfield Mortimer Observatory in southern England (51°N, 1°W), 0700 to 1000 UTC on 3 September 2022Google Scholar
Details of the Hong Kong King’s Park meteorological site are available from www.hko.gov.hk/en/wxinfo/aws/100_Upper_Air/kings-park-past-and-present.htmlGoogle Scholar
Hatton, D. B., 2002: Results of an intercomparison of wooden and plastic thermometer screens. In Papers presented at the WMO Technical Conference on Meteorological Instruments and Methods of Observation (TECO-2002), Bratislava, Slovak Republic, 23–25 September 2002. WMO, Geneva, Instruments and Observing Methods Report No. 75 (WMO/TD – No 1123)Google Scholar
Lin, X., Hubbard, K. G., and Meyer, G. E., 2001: Airflow characteristics of commonly used temperature radiation shields. J. Atmospheric and Oceanic Technology, 18: pp. 3293392.0.CO;2>CrossRefGoogle Scholar
Assessment of the Campbell Scientific ‘Met 21’ passive thermometer screen. Unpublished report, available at www.measuringtheweather.netGoogle Scholar
Warne, Jane, 1998: A preliminary investigation of temperature screen [sic] design and their impacts on temperature measurements. Bureau of Meteorology, Australia: Instrument Test Report No. 649Google Scholar
Buisan, Samuel T., Azorin‐Molina, Cesar, and Jimenez, Yolanda, 2015: Impact of two different sized Stevenson screens on air temperature measurements. International Journal of Climatology, 35(14): pp. 44084416. doi:10.1002/joc.4287CrossRefGoogle Scholar
Brandsma, T. and van der Meulen, J. P., 2008: Thermometer screen intercomparison in De Bilt (the Netherlands) – Part II: description and modeling of mean temperature differences and extremes. International Journal of Climatology, 28(3): pp. 389400. doi:10.1002/joc.1524CrossRefGoogle Scholar
Aoshima, Tadayoshi, et al., 2010: RIC-Tsukuba (Japan) Intercomparison of Thermometer Screens/Shields in 2009, in WMO TECO 2010 conference paper, available at https://community.wmo.int/en/teco-2010-programmeGoogle Scholar
Nordli, P. Ø., et al., 1997: The effect of radiation screens on Nordic time series of mean temperature. International Journal of Climatology, 17(15): pp. 16671681. doi: 10.1002/(SICI)1097-0088(199712)17:15<1667::AID-JOC221>3.0.CO;2-D3.0.CO;2-D>CrossRefGoogle Scholar
Andersson, T. and Mattison, I., 1991: A field test of thermometer screens. SMHI Report No. RMK 62, Norrkoping, SwedenGoogle Scholar
Hourly averages by month of Stevenson screen warming vs aspirated screen, over 10 years 2013–22, Stratfield Mortimer Observatory in southern England (51°N, 1°W): 87,608 observations, from possible 87,672 (data availability 99.93%)Google Scholar
One minute mean temperatures in a Stevenson screen and nearby aspirated screen observed at Stratfield Mortimer Observatory, southern England (51°N, 1°W). Figure 5.10 dataset 1130-1430 UTC on 16 December 2022: Figure 5.11 1200-1500 UTC on 13 August 2022: Figure 5.12 0300-0600 UTC on 28 November 2022.Google Scholar
Brock, Fred V. and Richardson, Scott J., 2001: Meteorological Measurement Systems. Oxford: Oxford University Press. 290 pp. doi:10.1093/oso/9780195134513.001.0001.CrossRefGoogle Scholar
Harrison, R. Giles, 2014: Meteorological measurements and instrumentation. Wiley: Advancing weather and climate science series. doi:10.1002/9781118745793CrossRefGoogle Scholar
de Podesta, Michael, Bell, Stephanie, and Underwood, Robin, 2018: Air temperature sensors: Dependence of radiative errors on sensor diameter in precision metrology and meteorology. Metrologia, 55: pp. 229244CrossRefGoogle Scholar
Trewin, Blair, 2022: A climatology of short-period temperature variations at Australian observation sites. Journal of Southern Hemisphere Earth Systems Science. doi:10.1071/es21027CrossRefGoogle Scholar
Ayers, G. P. and Warne, J. O., 2020: Response time of temperature measurements at automatic weather stations in Australia. Journal of Southern Hemisphere Earth Systems Science, 70(1): pp. 160165. doi:10.1071/es19032CrossRefGoogle Scholar
Miller, Ronald J. and Bair, Andrea, 2022: NOAA State Climate Extremes Committee Memorandum: New value for Washington maximum temperature record at Hanford, WA. Available from www.ncei.noaa.gov/monitoring-content/extremes/scec/reports/20220210-Washington-Maximum-Temperature.pdfGoogle Scholar
International Organization for Standardization (ISO), 2021: BS ISO 23350 2021 Hydrometry – Catching-type liquid precipitation measuring gauges. Geneva: International Organization for Standardization (ISO)Google Scholar
Lanza, L. G., et al., 2021: Calibration of non‐catching precipitation measurement instruments: A review. Meteorological Applications, 28(3): doi:10.1002/met.2002CrossRefGoogle Scholar
British Standards Institution, 2024: BS 7843:2024 Acquisition and management of meteorological precipitation data from a gauge network. British Standards InstitutionGoogle Scholar
Sevruk, B. and Klemm, S., 1989: Catalogue of national standard precipitation gauges. Vol. Instruments and Observing Methods, Report no. 39: WMO/TD-No. 313. Geneva: World Meteorological OrganizationGoogle Scholar
Goble, Peter E., et al., 2020: Who received the most rain today?: An analysis of daily precipitation extremes in the contiguous United States using COCORAHS and COOP reports. Bulletin of the American Meteorological Society, 101(6): pp. E710E719. doi:10.1175/bams-d-18-0310.1CrossRefGoogle Scholar
Doesken, N. and Reges, Henry, 2010 The value of the citizen weather observer. Weatherwise, 63: pp. 3037. doi:10.1080/00431672.2010.519607CrossRefGoogle Scholar
The CoCoRaHS website at www.cocorahs.org includes maps of precipitation totals across the United States and Canada updated daily, as well as information on how to join, observing methods, how to buy and site the CoCoRaHS raingauge, and much moreGoogle Scholar
Reges, Henry and Doesken, Nolan, 2020: A day in the life of the CoCoRaHS network. Weatherwise, 73(4): pp. 3239. doi:10.1080/00431672.2020.1762416CrossRefGoogle Scholar
Reges, Henry W., et al., 2016: CoCoRaHS: The evolution and accomplishments of a volunteer rain gauge network. Bulletin of the American Meteorological Society, 97(10): pp. 18311846. doi:10.1175/bams-d-14-00213.1CrossRefGoogle Scholar
The excellent Australian Government Bureau of Meteorology climate website is updated daily at www.bom.gov.au/climateGoogle Scholar
Table 6.1 sources: Information on raingauge site numbers were sought from the various national meteorological services, updated to May 2023. Australia: Current rainfall station numbers (6652) were taken from the stations list at www.bom.gov.au/climate/cdo/about/sitedata.shtml selecting for all sites still open at the date accessed (6 March 2023). The same list was used to count all sites still open whose records commenced in 1920 or earlier to count those with > 100 years record (total 1927) although this does include some with breaks in their record. Australian-run sites in Antarctica were excluded from these counts. Switzerland: MeteoSwiss site at www.meteoswiss.admin.ch/services-and-publications/applications/measurement-values-and-measuring-networks.html#param=messnetz-partner&lang=en&table=true, selecting aviation, climate, precipitation and partner stations and de-duplicating sites that appear in more than one category. Republic of Ireland: Met Eireann rainfall site numbers at end 2022 (enquiries team email 10 March 2023). USA NOAA – NOAA/NWS network: see also Table 4.2 and references therein. USA CoCoRaHS numbers are sites in US GCHN daily dataset from Table 4.2. UK: information provided by Melyssa Wright, Climate and Pollen Networks Manager, Met Office. Germany (Deutscher Wetterdienst, DWD): personal communication from Stegfan Gilge and Carola Grundmann 22 March 2023: see also websites ‘Bodenmessnetzkarte des DWD – automatische Niederschlagsstationen (Nst A)’ which shows the automatic precipitation sites, and the ‘Bodenmessnetzkarte des DWD – konventionelle Niedrschlagsstationen (Nst k)’, the conventional ones. Together with the main and aviation sites and the German army ones ‘Hauptamtliches Messntz, GeoInfoDBW und Aerologie’ and automatic weather stations ‘automatische Wetterstationen [WST III]’ there are 1868 precipitation sites in Germany. The Netherlands: 336 raingauges plus 34 synoptic AWS – thanks to Gerard van der Schrier (KNMI). India (India Meteorological Department): information provided by Sreejith Op. The total includes 209 climate stations (Synoptic Observatory) managed by India Meteorological Department and 338 part-time observatories. No reply was received to my enquiries to France (MeteoFrance), and the numbers are those supplied for the first edition of this book in 2012.+100+years+record+(total+1927)+although+this+does+include+some+with+breaks+in+their+record.+Australian-run+sites+in+Antarctica+were+excluded+from+these+counts.+Switzerland:+MeteoSwiss+site+at+www.meteoswiss.admin.ch/services-and-publications/applications/measurement-values-and-measuring-networks.html#param=messnetz-partner&lang=en&table=true,+selecting+aviation,+climate,+precipitation+and+partner+stations+and+de-duplicating+sites+that+appear+in+more+than+one+category.+Republic+of+Ireland:+Met+Eireann+rainfall+site+numbers+at+end+2022+(enquiries+team+email+10+March+2023).+USA+NOAA+–+NOAA/NWS+network:+see+also+Table+4.2+and+references+therein.+USA+CoCoRaHS+numbers+are+sites+in+US+GCHN+daily+dataset+from+Table+4.2.+UK:+information+provided+by+Melyssa+Wright,+Climate+and+Pollen+Networks+Manager,+Met+Office.+Germany+(Deutscher+Wetterdienst,+DWD):+personal+communication+from+Stegfan+Gilge+and+Carola+Grundmann+22+March+2023:+see+also+websites+‘Bodenmessnetzkarte+des+DWD+–+automatische+Niederschlagsstationen+(Nst+A)’+which+shows+the+automatic+precipitation+sites,+and+the+‘Bodenmessnetzkarte+des+DWD+–+konventionelle+Niedrschlagsstationen+(Nst+k)’,+the+conventional+ones.+Together+with+the+main+and+aviation+sites+and+the+German+army+ones+‘Hauptamtliches+Messntz,+GeoInfoDBW+und+Aerologie’+and+automatic+weather+stations+‘automatische+Wetterstationen+[WST+III]’+there+are+1868+precipitation+sites+in+Germany.+The+Netherlands:+336+raingauges+plus+34+synoptic+AWS+–+thanks+to+Gerard+van+der+Schrier+(KNMI).+India+(India+Meteorological+Department):+information+provided+by+Sreejith+Op.+The+total+includes+209+climate+stations+(Synoptic+Observatory)+managed+by+India+Meteorological+Department+and+338+part-time+observatories.+No+reply+was+received+to+my+enquiries+to+France+(MeteoFrance),+and+the+numbers+are+those+supplied+for+the+first+edition+of+this+book+in+2012.>Google Scholar
Personal communication from Christopher C. Burt, e-mail dated 26 August 2011Google Scholar
I am indebted to Michael Kendon from the UK Met Office National Climate Information Centre for this figure, and the detailed rationale that went in to defining it (personal communication, 21 March 2023)Google Scholar
Burt, Stephen, et al., 2016: Cumbrian floods, 5/6 December 2015. Weather, 71(2): pp. 3637. doi:10.1002/wea.2704CrossRefGoogle Scholar
Groisman, Pavel Ya and Legates, David R., 1994: The accuracy of United States precipitation data. Bulletin of the American Meteorological Society, 75(2): pp. 215227. doi:10.1175/1520-0477(1994)075<0215:taousp>2.0.co;2. Xref 3135a2.0.CO;2>CrossRefGoogle Scholar
Pan, Xicai, et al., 2016: Bias corrections of precipitation measurements across experimental sites in different ecoclimatic regions of western Canada. The Cryosphere, 10(5): pp. 23472360. doi:10.5194/tc-10-2347-2016CrossRefGoogle Scholar
Essery, Charles I. and Wilcock, David N., 1991: The variation in rainfall catch from standard UK Meteorological Office raingauges: a twelve year case study. Hydrological Sciences Journal, 36(1): pp. 2334. doi:10.1080/02626669109492482CrossRefGoogle Scholar
Green, M.J., 1970: Some factors affecting the catch of raingauges. Meteorological Magazine, 99: pp. 1020Google Scholar
Groisman, Pavel Ya, l. Peck, Eugene, and Quayle, Robert G., 1999: Intercomparison of recording and standard nonrecording U.S. gauges [raingauges]. Journal of Atmospheric and Oceanic Technology, 16: pp. 6026092.0.CO;2>CrossRefGoogle Scholar
Kurtyka, J. C., 1953: Precipitation measurement study. Report of investigation No 20. Illinois, USA: State Water Survey. 178. Available from https://citeseerx.ist.psu.edu/viewdoc/download?doi=10.1.1.461.3364&rep=rep1&type=pdfGoogle Scholar
Heberden, William, 1769: XLVII. Of the different quantities of rain, which appear to fall, at different heights, over the same spot of ground. Philosophical Transactions, 59: pp. 359362. doi:10.1098/rstl.1769.0047Google Scholar
Muchan, Katie and Dixon, Harry, 2019: Insights into rainfall undercatch for differing raingauge rim heights. Hydrology Research, 50(6): pp. 15641576. doi:10.2166/nh.2019.024CrossRefGoogle Scholar
Daly, Christopher, et al., 2007: Observer bias in daily precipitation measurements at United States Cooperative Network Stations. Bulletin of the American Meteorological Society, 88(6): pp. 899912. doi:10.1175/bams-88-6-899CrossRefGoogle Scholar
BBC News, 18 January 2024: Anglesey man has measured the rainfall every day since 1948. www.bbc.co.uk/news/uk-wales-68005382Google Scholar
More information on the US SRG can be found at www.weather.gov/iwx/coop_8inch.Google Scholar
Liu, X. C., Gao, T. C., and Liu, L., 2013: A comparison of rainfall measurements from multiple instruments. Atmospheric Measurement Techniques, 6(7): pp. 15851595. doi:10.5194/amt-6-1585-2013CrossRefGoogle Scholar
Peck, E. L., 1993: Biases in precipitation measurements: an American experience, in American Meteorological Society: Eighth symposium on meteorological observations and instrumentation. Anaheim, CA, 17–22 January 1993Google Scholar
Strangeways, Ian 2007: Precipitation: Theory, measurement and distribution. Cambridge: Cambridge University Press. 290 pp.Google Scholar
Lanza, Luca G. and Cauteruccio, Arianna, 2022: Chapter 1 – Accuracy assessment and intercomparison of precipitation measurement instruments, in Precipitation Science, S. Michaelides, Editor: Elsevier. pp. 335CrossRefGoogle Scholar
Acreman, Mike, 1989: Extreme rainfall in Calderdale, 19 May 1989. Weather, 44(11): pp. 438446. doi:10.1002/j.1477-8696.1989.tb04980.x.Xref1032CrossRefGoogle Scholar
Collinge, V. K., et al., 1990: Radar observations of the Halifax storm, 19 May 1989. Weather, 45(10): pp. 354365. doi:10.1002/j.1477-8696.1990.tb05554.xCrossRefGoogle Scholar
Burt, Stephen, 2005: Cloudburst upon Hendraburnick Down: The Boscastle storm of 16 August 2004. Weather, 60(8): pp. 219227. doi:10.1256/wea.26.05CrossRefGoogle Scholar
Holley, Dan, Dent, James, and Clark, Colin, 2021: Thunderstorms and extreme rainfall in south Norfolk, 16 August 2020: meteorological analysis. Weather. doi:10.1002/wea.4038CrossRefGoogle Scholar
Dent, James, Clark, Colin, and Holley, Dan, 2022: The Brettenham, East Anglia storm of 25 July 2021: hydrological response and implications for PMP. Weather. doi: 10.1002/wea.4206CrossRefGoogle Scholar
Holley, Dan, Dent, James, and Clark, Colin, 2022: The Brettenham storm of 25 July 2021. Weather. doi:10.1002/wea.4145CrossRefGoogle Scholar
Burt, Christopher, 2007: Extreme weather: A guide and record book. Second ed.: W W Norton & Co, New York. 303 pp.Google Scholar
Burt, Christopher. 2019: A summary of U.S. State historical precipitation extremes. Available from www.wunderground.com/cat6/Summary-US-State-Historical-Precipitation-ExtremesGoogle Scholar
Quetelard, Hubert, et al., 2009: Extreme Weather: World-Record rainfalls during tropical cyclone Gamede. Bulletin of the American Meteorological Society, 90(5): pp. 603608. doi:10.1175/2008bams2660.1CrossRefGoogle Scholar
Costello, T. A. and Williams, H. J., 1991: Short duration rainfall intensity measured using calibrated time-of-tip data from a tipping bucket raingage [raingauge]. Agricultural and Forest Meteorology, 57: pp. 147155. Xref 3134CrossRefGoogle Scholar
Table 6.4 and Figure 6.13: rainfall record from EML ARG314 0.1 mm resolution TBR within Stratfield Mortimer Observatory in southern England (51°N, 1°W), 31 October 2022Google Scholar
EML’s field calibration kit for raingauges is described at www.emltd.net/rfvk.htmlGoogle Scholar
Sušin, Nejc and Peer, Peter, 2018: Open-source tool for interactive digitisation of pluviograph strip charts. Weather, 73(7): pp. 222226. doi:10.1002/wea.3001CrossRefGoogle Scholar
Burt, Stephen, 2016: Field test: Lambrecht rain[e] high-precision precipitation sensor. Envirotech-Online. Available from www.envirotech-online.com/article/air-monitoring/6/lambrecht/field-test-lambrecht-raine-high-precision-precipitation-sensor/2045Google Scholar
Figure 6.19: Rainfall record from Stratfield Mortimer Observatory in southern England (51°N, 1°W) on 23 October 2022Google Scholar
Figure 6.20: Rainfall record from Stratfield Mortimer Observatory in southern England (51°N, 1°W) on 10 January 2023Google Scholar
EML SW120R precipitation detector www.emltd.net/sw120r.htmlGoogle Scholar
Pollock, M. D., et al., 2018: Quantifying and mitigating wind‐induced undercatch in rainfall measurements. Water Resources Research, 54(6): pp. 38633875. doi:10.1029/2017wr022421CrossRefGoogle Scholar
Strangeways, Ian, 2004: Improving precipitation measurement. International Journal of Climatology, 24(11): pp. 14431460. doi:10.1002/joc.1075CrossRefGoogle Scholar
Cauteruccio, Arianna and Lanza, Luca G., 2020: Parameterization of the collection efficiency of a cylindrical catching-type rain gauge based on rainfall intensity. Water, 12(12): pp. 3431. doi:10.3390/w12123431CrossRefGoogle Scholar
British Standards Institution, 2010: BS EN 13798:2010 Hydrometry – Specification for a reference raingauge pit.Google Scholar
Hudleston, F., 1933: A summary of seven years’ experiments with raingauge shields in exposed positions, 1926–32 at Hutton John, Penrith. British Rainfall 1933: pp. 274293.Google Scholar
Goodison, B. E., Louie, P. Y. T., and Yang, D., 1998: WMO solid precipitation measurement intercomparison – final report. Geneva: World Meteorological Organization (WMO), TD No. 872Google Scholar
Goodison, B. E., Sevruk, B., and Klemm, S., 1989: WMO solid precipitation measurement intercomparison: Objectives, methodology and analysis. International Association of Hydrological Sciences, 1989: Atmospheric deposition. Proceedings, Baltimore Symposium (May 1989). IAHS Publication No. 179, Wallingford, Oxon, UKGoogle Scholar
Kochendorfer, John, et al., 2022: How well are we measuring snow post-SPICE? Bulletin of the American Meteorological Society, 103(2): pp. E370E388. doi:10.1175/bams-d-20-0228.1CrossRefGoogle Scholar
Nitu, R., et al., 2021: WMO Solid Precipitation Intercomparison Experiment (SPICE) (2012–2015). Geneva: World Meteorological Organization. 451 pp. Available from https://library.wmo.int/viewer/56317?medianame=iom_131_en_1_#page=1&viewer=picture&o=bookmark&n=0&q=.Google Scholar
Smith, Craig D., et al., 2020: Evaluation of the WMO Solid Precipitation Intercomparison Experiment (SPICE) transfer functions for adjusting the wind bias in solid precipitation measurements. Hydrology and Earth System Sciences, 24(8): pp. 40254043. doi:10.5194/hess-24-4025-2020CrossRefGoogle Scholar
World Meteorological Organization (WMO), 1992: Snow cover measurements and areal assessment of precipitation and soil moisture (WMO-No. 749), ed. B. Sevruk, . Geneva: World Meteorological Organization (WMO). 312 pp. Available from https://library.wmo.int/records/item/33781-snow-cover-measurements-and-areal-assessment-of-precipitation-and-soil-moisture.Google Scholar
Doesken, Nolan and Judson, Arthur, 1996: The Snow booklet: A guide to the science, climatology and measurement of snow in the United States. Colorado Climate Center, Colorado State UniversityGoogle Scholar
Whipple, G. M., 1881: The relative frequency of given heights of the barometer readings at the Kew Observatory, during the ten years, 1870 to 1879. Quarterly Journal of the Royal Meteorological Society, 7(37): pp. 5259. doi:10.1002/qj.4970073710CrossRefGoogle Scholar
Smith, John, 1688: A compleat Discourse of the Nature, Use and Right Managing of that wonderful instrument the Baroscope. or Quicksilver Weather-Glass. London, printed for Joseph Watts, at the Angel in St Paul’s Churchyard. Reference from Whipple, 1881 q.v.Google Scholar
Middleton, W. E. K., 1964: The history of the barometer. Baltimore, MD: Johns Hopkins Press. 489 pp.CrossRefGoogle Scholar
Lamb, H. H., 1986: Ancient units used by the pioneers of meteorological measurements. Weather, 41(7): pp. 230233. doi:10.1002/j.1477-8696.1986.tb03842.xCrossRefGoogle Scholar
Cornes, Richard, 2010: Early meteorological data from London and Paris. PhD thesis – University of East Anglia, 233 pp.Google Scholar
Harrison, R. Giles, 2020: Make your own met measurements: build a digital barometer for about £10. Weather, 76: pp. 4547. doi:10.1002/wea.3857CrossRefGoogle Scholar
Amores, Angel, et al., 2022: Numerical simulation of atmospheric Lamb Waves generated by the 2022 Hunga‐Tonga volcanic eruption. Geophysical Research Letters, 49(6): doi:10.1029/2022gl098240CrossRefGoogle Scholar
Burt, Stephen, 2022: Multiple airwaves crossing Britain and Ireland following the eruption of Hunga Tonga–Hunga Ha’apai on 15 January 2022. Weather, 77: pp. 7681CrossRefGoogle Scholar
Li, Chunyan, 2022: Global shockwaves of the Hunga Tonga-Hunga Ha’apai volcano eruption measured at ground stations. iScience, 25(11): pp. 105356. doi:10.1016/j.isci.2022.105356CrossRefGoogle ScholarPubMed
Matoza, Robin S., et al., 2022: Atmospheric waves and global seismoacoustic observations of the January 2022 Hunga eruption, Tonga. Science. doi: 10.1126/science.abo7063. (Published online, 12 May 2022)CrossRefGoogle Scholar
Terry, James P., et al., 2022: Tonga volcanic eruption and tsunami, January 2022: globally the most significant opportunity to observe an explosive and tsunamigenic submarine eruption since AD 1883 Krakatau. Geoscience Letters, 9(1): doi:10.1186/s40562-022-00232-zCrossRefGoogle Scholar
Harrison, Giles, 2022: Pressure anomalies from the January 2022 Hunga Tonga‐Hunga Ha’apai eruption. Weather, 77(3): pp. 8790. doi:10.1002/wea.4170CrossRefGoogle Scholar
Smart, David, 2022: The first hour of the paroxysmal phase of the 2022 Hunga Tonga-Hunga Ha’apai volcanic eruption as seen by a geostationary meteorological satellite. Weather, 77(3): pp. 8182. doi:10.1002/wea.4173CrossRefGoogle Scholar
Meteorological Office, 1980: Handbook of Meteorological Instruments: Volume 1, Measurement of atmospheric pressure, in Handbook of Meteorological Instruments: London: Her Majesty’s Stationery OfficeGoogle Scholar
Meteorological Office, 1956: Handbook of Meteorological Instruments: Part 1, Instruments for surface observations. Fifth impression 1969 ed. London: Her Majesty’s Stationery Office. PDF copy available in Met Office Archive at https://digital.nmla.metoffice.gov.uk/SO_3c42ff4e-ac2a-4f5c-9d8c-1d7716f3c211Google Scholar
A variety of online humidity calculators are available – for example, www.omnicalculator.com/physics/absolute-humidity. There are also numerous smartphone apps providing similar functionality available for both Android and Apple devicesGoogle Scholar
Harrison, R. G. and Wood, C. R., 2012: Ventilation effects on humidity measurements in thermometer screens. Quarterly Journal of the Royal Meteorological Society, 138(665): pp. 11141120. doi:10.1002/qj.985CrossRefGoogle Scholar
McIlveen, Robin, 2010: Fundamentals of weather and climate. Second ed, Oxford: Oxford University Press. 632 pp., specifically Chapter 5.4; also Bolton, D., 1980: The computation of equivalent potential temperature. Mon. Weather Rev., 108: pp. 10461053Google Scholar
Farahani, Hamid, Wagiran, Rahman, and Hamidon, Mohd, 2014: Humidity sensors principle, mechanism, and fabrication technologies: a comprehensive review. Sensors, 14(5): pp. 78817939. doi:10.3390/s140507881CrossRefGoogle ScholarPubMed
Burt, Stephen, 2011: Exceptionally low relative humidity in northern England, 2–3 March 2011. Weather, 66(7): pp. 197199. doi:10.1002/wea.833CrossRefGoogle Scholar
Malyon, Charles, 2015: Comparative performance of surface relative humidity measurements using commercially–available sensors within an automatic weather screen. MSc dissertation, University of Reading Department of MeteorologyGoogle Scholar
One minute mean relative humidity records, comparing a digital sensor and RH derived from dry and wet bulb psychrometer readings within a Stevenson screen: Stratfield Mortimer Observatory in southern England (51°N, 1°W), 17 August 2022Google Scholar
Burt, Stephen and Hawkins, Ed, 2019: Near-zero humidities on Ben Nevis, Scotland, revealed by pioneering nineteenth century observers and modern volunteers. International Journal of Climatology, 39: pp. 44514466. doi:10.1002/joc.6084CrossRefGoogle Scholar
One minute mean dry and wet bulb temperatures, and relative humidity measured using a digital sensor and derived from dry and wet bulb psychrometer readings, in a Stevenson screen observed at Stratfield Mortimer Observatory, southern England (51°N, 1°W), 9–10 December 2022Google Scholar
The US Heat Index is given (in °F only) at www.nsis.org/weather/heatindex.html (accessed 29 November 2022)Google Scholar
The Canadian humidex index can be found at www.csgnetwork.com/canhumidexcalc.html, which gives an online humidity calculator for temperatures in °C and relative humidity as % (accessed 29 November 2022)Google Scholar
Burt, Stephen, 2022: The gust that never was: a meteorological instrumentation mystery. Weather, 77: pp. 123126CrossRefGoogle Scholar
Strangeways, Ian, 2003: Measuring the natural environment. Second Edition ed. Cambridge: Cambridge University Press. 534 pp.CrossRefGoogle Scholar
Meteorological Office, 1981: Handbook of Meteorological Instruments: Volume 4, Measurement of surface wind, in Handbook of Meteorological Instruments: London: Her Majesty’s Stationery OfficeGoogle Scholar
Jenkins, Geoff, 2014: A comparison between two types of widely used weather stations. Weather, 69(4): pp. 105110. doi:10.1002/wea.2158CrossRefGoogle Scholar
Beljaars, A. C. M., 1987: The influence on sampling and filtering on measured wind gusts. Journal of Oceanic and Atmospheric Technology, 4: pp. 613626. doi: 10.1175/1520-0426(1987)004<0613:TIOSAF>2.0.CO;22.0.CO;2>CrossRefGoogle Scholar
Beljaars, A. C. M., 1987: Instruments and Observing Methods Report No. 31: The measurement of gustiness at routine wind stations: a review. Instruments and Observing Methods Report No. 31. Geneva: World Meteorological Organization (WMO). Available from https://library.wmo.int/index.php?lvl=notice_display&id=15514Google Scholar
Curran, J. C., et al., 1977: Cairngorm summit automatic weather station. Weather, 32(2): pp. 6163. doi:10.1002/j.1477-8696.1977.tb04513.xCrossRefGoogle Scholar
Barton, J. S., 1984: Observing mountain weather using an automatic station. Weather, 39(5): pp. 140145. doi:10.1002/j.1477-8696.1984.tb07480.xCrossRefGoogle Scholar
Barton, J. S., 2020: The Cairngorm automatic weather station. Weather, 75(4): pp. 129130. doi:10.1002/wea.3514Google Scholar
The Cairngorm AWS is online at cairngormweather.eps.hw.ac.uk and the site contains some details of the instruments together with a multi-year data archive. The summit instruments and webcam were set up by funded research projects, which finished a number of years ago. Heriot-Watt University continues to support these facilities as much as possible, but regret that there may well be extended periods when they are unavailable.Google Scholar
Putnam, William Lowell, 1991: The worst weather on Earth: A history of the Mount Washington Observatory. New York: American Alpine Club. 265 pp.Google Scholar
Smith, Alan A., 1982: The Mount Washington Observatory—50 Years Old. Bulletin of the American Meteorological Society, 63(9): pp. 986995. doi: 10.1175/1520-0477(1982)063<0986:TMWOYO>2.0.CO;22.0.CO;2>CrossRefGoogle Scholar
Kelsey, Eric, et al., 2014: Blown Away: Interns experience science, research, and life on top of Mount Washington. Bulletin of the American Meteorological Society, 96(9): pp. 15331543. doi:10.1175/BAMS-D-13-00195.1CrossRefGoogle Scholar
Philippoff, K. 2023: Brutal cold on Mount Washington: A weather story. Available from www.mountwashington.org/experience-the-weather/observer-comments.aspx?id=59058Google Scholar
The Mount Washington Observatory website is at www.mountwashington.org/weatherGoogle Scholar
Rappaport, Edward N., 1994: Hurricane Andrew [August 1992]. Weather, 49(2): pp. 5161. doi:10.1002/j.1477-8696.1994.tb05974.xCrossRefGoogle Scholar
Details of the Barrow Island world wind speed extreme are available online at wmo.asu.edu/content/world-maximum-surface-wind-gust, along with other WMO ‘extremes’ investigation summariesGoogle Scholar
Meteorological Office, 1982: Observer’s Handbook. HMSOGoogle Scholar
Burt, Stephen, 2007: A comparison of traditional and modern methods of measuring earth temperatures. Weather, 62(12): pp. 331336. doi:10.1002/wea.165CrossRefGoogle Scholar
McIlveen, Robin, 2010: Fundamentals of weather and climate. Second ed. Oxford: Oxford University Press. 632 pp.Google Scholar
Vignola, Frank, Michalsky, Joseph, and Stoffel, Thomas, 2012: Solar and Infrared radiation measurements. Boca Raton, Florida: Taylor & Francis. 394 pp.Google Scholar
Figure 11.1 shows the American Society for Testing and Materials (ASTM) G-173–03 Reference Spectra (‘Standard Tables for Reference Solar Spectral Irradiance at Air Mass 1.5: Direct Normal and Hemispherical for a 37 Tilted Surface’), also known as ISO 9845–1, 2022 which is available at www.iso.org/obp/ui/#iso:std:iso:9845:-1:ed-2:v1:en. The two plots were prepared using the SMARTS model version 2.9.2 (SMARTS: Simple Model of the Radiative Transfer of Sunshine). More information about the SMARTS model is available online at www.nrel.gov/rredc/smarts; full details of the ASTM G-173–03 Reference Spectra standard and complete references can be found at http://rredc.nrel.gov/solar/spectra/am1.5 and linked references thereinGoogle Scholar
Gueymard, Christian A., 2018: A reevaluation of the solar constant based on a 42-year total solar irradiance time series and a reconciliation of spaceborne observations. Solar Energy, 168: pp. 29. doi:10.1016/j.solener.2018.04.001CrossRefGoogle Scholar
Wild, Martin, et al., 2019: The cloud-free global energy balance and inferred cloud radiative effects: an assessment based on direct observations and climate models. Climate Dynamics, 52(7–8): pp. 47874812. doi:10.1007/s00382-018-4413-yCrossRefGoogle ScholarPubMed
More information on the Australian Bureau of Meteorology’s use of satellite measurements for surface solar radiation estimates is given online at www.bom.gov.au/climate/austmaps/solar-radiation-glossary.shtml#globalexposureGoogle Scholar
Good, Elizabeth, 2010: Estimating daily sunshine duration over the UK from geostationary satellite data. Weather, 65(12): pp. 324328. doi:10.1002/wea.619CrossRefGoogle Scholar
Matuszko, Dorota, et al., 2020: Sunshine duration in Poland from ground‐ and satellite‐based data. International Journal of Climatology, 40(9): pp. 42594271. doi:10.1002/joc.6460CrossRefGoogle Scholar
For more detail the reader is referred to World Meteorological Organization (1984) Radiation and Sunshine Duration Measurements: Comparison of Pyranometers and Electronic Sunshine Duration Recorders of RA VI (Budapest, Hungary, 1984). WMO/TD No. 146: also WMO (1989) Automatic Sunshine Duration Measurement Comparison, Hamburg (Germany), IOM 42 (results not formally published but available from WMO). See also the reports of the WMO International Pyrheliometer Intercomparisons, conducted by the World Radiation Centre at Davos, Switzerland (www.pmodwrc.ch/en/ipc-xiii) and carried out at five-yearly intervals, also distributed by WMO. At the time of writing, the most recent intercomparison event took place in September-October 2021Google Scholar
Foster, N. B. and Foskett, L. W., 1953: A photoelectric sunshine recorder. Bulletin of the American Meteorological Society: pp. 212215CrossRefGoogle Scholar
Michalsky, J. J., 1992: Comparison of a National Weather Service Foster sunshine recorder and the World Meteorological Organization standard for sunshine duration. Solar Energy, 48(2): pp. 133141. doi:10.1016/0038-092X(92)90041-8CrossRefGoogle Scholar
See, for example, Olivieri, Jean (1998) Sunshine measurements using a pyranometer and Fiore, J. V. et al. (1998) A comparison between a proposed ASOS sunshine sensor and a pyrheliometer: both papers in Instruments and Observing Methods, Report No. 70: Papers presented at the WMO Technical Conference on meteorological and environmental instruments and methods of observation (TECO-98) held in Casablanca, Morocco, 13–15 May 1998: also Dyson, Paul (2005) Investigation of the accuracy of the Delta-T devices BF3 sunshine sensor. Australian Bureau of Meteorology, Instrument Test Report No. 700Google Scholar
Massen, Francis, 2016: Sunshine duration from pyranometer readings. doi:10.13140/RG.2.1.2255.7042CrossRefGoogle Scholar
Wang, Yuchang, et al., 2021: A review on sunshine recorders: Evolution of operation principle and construction. Measurement, 186: pp. 110138. doi:10.1016/j.measurement.2021.110138CrossRefGoogle Scholar
Slob, W. H. and Monna, W. A. A., 1991: Bepaling van directe en diffuse straling en van zonneschijndurr uit 10-minuutwaarden van globale straling [Determination of direct and diffuse radiation and of sunshine duration from 10-minute values of global radiation]. De Bilt, the Netherlands: Koninklijk Nederlands Meteorologisch Instituut (KNMI)Google Scholar
Groen, G., et al., 2011: Implementation of the Hinssen-Knap algorithm for the calculation of sunshine duration. De Bilt: KNMI. Technical report TR-319Google Scholar
Stokes, George Gabriel, 1880: Description of the card supporter for sunshine recorders adopted at the Meteorological Office. Quarterly Journal of the Royal Meteorological Society, 7: pp. 8394Google Scholar
Stanhill, G., 2003: Through a glass brightly: Some new light on the Campbell–Stokes sunshine recorder. Weather, 58(1): pp. 311. doi:10.1256/wea.278.01CrossRefGoogle Scholar
Sanchez-Lorenzo, A., et al., 2013: New insights into the history of the Campbell–Stokes sunshine recorder. Weather, 68(12): pp. 327331. Doi:10.1002/wea.2130CrossRefGoogle Scholar
Wood, Curtis R. and Giles Harrison, R., 2011: Scorch marks from the sky. Weather, 66(2): pp. 3941. Doi:10.1002/wea.657CrossRefGoogle Scholar
Painter, H. E., 1981: The performance of a Campbell–Stokes sunshine recorder compared with a simultaneous record of the normal incidence irradiance. Meteorological Magazine, 110: pp. 102109.Google Scholar
Baumgartner, D. J., et al., 2017: A comparison of long-term parallel measurements of sunshine duration obtained with a Campbell–Stokes sunshine recorder and two automated sunshine sensors. Theoretical and Applied Climatology. doi:10.1007/s00704-017-2159-9CrossRefGoogle Scholar
Kerr, Andrew and Tabony, Richard, 2004: Comparison of sunshine recorded by Campbell–Stokes and automatic sensors. Weather, 59(4): pp. 9095. Doi:10.1256/wea.99.03CrossRefGoogle Scholar
Legg, Tim, 2014: Comparison of daily sunshine duration recorded by Campbell–Stokes and Kipp and Zonen sensors. Weather, 69(10): pp. 264267. Doi: 10.1002/wea.2288CrossRefGoogle Scholar
Sanchez-Romero, A., et al., 2015: Using digital image processing to characterize the Campbell–Stokes sunshine recorder and to derive high-temporal resolution direct solar irradiance. Atmospheric Measurement Techniques, 8(1): pp. 183194. Doi:10.5194/amt-8-183-2015CrossRefGoogle Scholar
Shearn, P. D., 1999: Automatic sunshine sensor trial report. Bracknell, Met Office: Observations, Logistics and Automation Branch (unpublished internal report: copy available from National Meteorological Library, Exeter, UK)Google Scholar
Matuszko, Dorota, 2015: A comparison of sunshine duration records from the Campbell-Stokes sunshine recorder and CSD3 sunshine duration sensor. Theoretical and Applied Climatology, 119(3–4): pp. 401406. Doi:10.1007/s00704-014-1125-zCrossRefGoogle Scholar
Koninklijk Nederlands Meteorologisch Instituut – KNMI, 2002: Klimaatatlas van Nederland 1971–2000. De Bilt, the Netherlands: Koninklijk Nederlands Meteorologisch Instituut – KNMI. Zonneschijn, pp. 6870Google Scholar
Steurer, P. M. and Karl, T. R., 1991: Historical sunshine and cloud data in the United States. Office of Scientific and Technical Information, Oak Ridge National Laboratory, Oak Ridge, TN 37831. 158 pp.Google Scholar
For details, see Baker, D. C. and Haines, D. A., 1969: Solar radiation and sunshine duration relationships in the north-central region and Alaska. North Central Regional Research Publication 195, Technical Bulletin 262, Agricultural Experiment Station, University of Minnesota, Minneapolis (as quoted in Steurer and Karl, 1991, Oak Ridge National Laboratory): 0.12 cal cm–2 min–1 is about 87 W/m2. Note that the threshold for the Marvin sunshine recorder was determined as approximately 255 W/m2 (0.37 cal cm–2 min–1) in Brooks, C. F. and Brooks, E. S. (1947) Sunshine recorders: A comparative study of the burning-glass and thermometric systems. J. Meteorol, 4, pp. 105–115Google Scholar
Stanhill, Gerald and Cohen, Shabtai, 2005: Solar radiation changes in the United States during the twentieth century: Evidence from sunshine duration measurements. Journal of Climate, 18(10): pp. 15031512. Doi:10.1175/jcli3354.1CrossRefGoogle Scholar
Quinlan, F. T., 1985: A history of sunshine data in the United States, in Handbook of applied meteorology, Houghton, D. D., Editor., John Wiley and Sons, New York. 11991201Google Scholar
Cerveny, Randall S. and Balling, Robert C., 1990: Inhomogeneities in the long-term United States’ sunshine record. Journal of Climate, 3(9): pp. 104510482.0.CO;2>CrossRefGoogle Scholar
International Organization for Standardization (ISO), 2023: ISO 9847:2023 Solar energy – Calibration of field pyranometers by comparison to a reference pyranometerGoogle Scholar
World Meteorological Organization (WMO), 2019: Manual on Codes. International Codes, Volume I.1: Annex II to the WMO Technical Regulations, Part A – Alphanumeric Codes. Geneva, Switzerland: WMO. 480. Available from https://library.wmo.int/doc_num.php?explnum_id=10235Google Scholar
This information was collated from the Climatological Observers Link Bulletin for November 2022. Station terminal hours form one part of the station grading code for COL stations. Details are available at www.colweather.org.ukGoogle Scholar
Table 13.3 contains a short extract from the datalogger record of gust speeds at the Stratfield Mortimer Observatory in southern England (51°N, 1°W) during windstorm Eunice on 18 February 2022. Entries shown are the highest 3 s mean wind speeds, near-duplicate table entries within 3 s of those shown have been omitted for clarityGoogle Scholar
Bilham, E. G., 1948: Washington codes. Meteorological Magazine, 77: pp. 217–20. This is the first instance of the word ‘okta’ in the index of the Meteorological Magazine. The attribution of the term to Colonel Ernest Gold CB, DSO, OBE, FRS (1882–1976) is well known but apparently poorly documented: Gold was the Deputy Director of the Meteorological Office upon his retirement in 1947.Google Scholar
Hamblyn, Richard, 2021: The Cloud Book: how to understand the skies. Second ed. Exeter: David & Charles. 176 pp.Google Scholar
Pretor-Pinney, Gavin, 2006: The Cloudspotter’s guide. London: Hodder & Stoughton / Sceptre. 320 pp.Google Scholar
Dunlop, Storm, 2008: The Oxford dictionary of weather. Second ed.: Oxford University PressGoogle Scholar
Met Office, 1991: Meteorological glossary. Sixth ed. London: Her Majesty’s Stationery Office (HMSO)Google Scholar
Meaden, G. T., 1976: Practical hail gauges for climatological stations. Journal of Meteorology, UK, 1: pp. 313319Google Scholar
International Electrotechnical Commission, 2022: IEC 60751:2022: Industrial platinum resistance thermometers and platinum temperature sensors. Geneva: International Electrotechnical Commission. 22 pp.Google Scholar
McArthur, L. J. B, 2005: World Climate Research Programme – Baseline Surface Radiation Network (BSRN): Operations manual, version 2.1. Geneva: World Meteorological Organization. 176. Available from https://epic.awi.de/id/eprint/30644/Google Scholar
In the UK, the Climatological Observers Link (www.colweather.org.uk) archives all monthly and annual summaries submitted by members, together with numerous long runs of monthly station data added since. These datasets have been used to create and publish 10 and 30 year averages for all sites with sufficiently long records. Membership also includes free access to up to 1 GB for members’ weather and climate records on a commercial cloud storage facility.Google Scholar
Figure 18.2. Microsoft Excel scatterplot showing the relationship between daily sunshine duration and daily global solar radiation totals during 10 years in June. Records from Stratfield Mortimer Observatory in southern England (51°N, 1°W), period 2013–22Google Scholar
Hourly sunshine records from Stratfield Mortimer Observatory in southern England (51°N, 1°W), 20 years period 2003–22. Instromet sunshine recorder 2003–2011 inclusive, Kipp & Zonen CSD3 unit 2012 onwards. Open exposure at 10 m above ground. Data availability 100%, minor gaps filled with estimates from alternate instrumentsGoogle Scholar
Hourly rainfall and wind direction records from Stratfield Mortimer Observatory in southern England (51°N, 1°W), 20 year period 2003 –22. Wind direction and speed from instruments at 10 m above ground level, rainfall from a 0.2 mm tipping-bucket gauge located within the nearby instrument enclosureGoogle Scholar
Frequency of days with snow or sleet observed to fall, and thunder heard, at Stratfield Mortimer Observatory in southern England (51°N, 1°W), by week number over the 30 years standard averaging period 1991–2020Google Scholar
Hourly rainfall and 10 m wind speed data at Stratfield Mortimer Observatory (51°N, 1°W) over the 25 year period 1997 to 2022 inclusive. Wind speeds in m/sGoogle Scholar
Tufte, Edward R., 1983: The visual display of quantitative information. Cheshire, CT: Graphics Press. 197 pp.Google Scholar
Sunshine data for 2022 at Stratfield Mortimer Observatory in southern England (51°N, 1°W), 5 minute data in seconds plotted using an Excel pivot tableGoogle Scholar
Tufte, Edward R., 1990: Envisioning information. Cheshire, CT: Graphics Press. 126 pp.Google Scholar
Tufte, Edward R., 1997: Visual explanations. Cheshire, CT: Graphics Press. 157 pp.Google Scholar
Lakes Environmental Software: www.weblakes.com. WRPLOT view is free to use, although registration is requiredGoogle Scholar
Met Office. 2019: Met Office MIDAS Open: UK Land Surface Stations Data (1853–current). Centre for Environmental Data Analysis (CEDA). Available from http://catalogue.ceda.ac.uk/uuid/dbd451271eb04662beade68da43546e1Google Scholar
Hawkins, , Ed, et al., 2022: Rainfall Rescue: Millions of historical monthly rainfall observations taken in the UK and Ireland rescued by citizen scientists. Geoscience Data Journal, 10(2): pp. 246261. doi:10.1002/gdj3.157CrossRefGoogle Scholar
Burt, Stephen and Brugge, Roger, 2011: Climatological averages for 1981–2010 and 2001–2010 for stations appearing in the monthly bulletin of the Climatological Observers Link. Maidenhead, UK: Climatological Observers Link, 434 pp.Google Scholar
Climatological Observers Link (COL), 2021: Climatological averages for 1991–2020 and 2011–2020 for stations appearing in the monthly bulletin of the Climatological Observers Link (COL). 71 pp. Available from www.colweather.org.ukGoogle Scholar
Kirk, Peter J., Clark, Matthew R., and Creed, Ellie, 2021: Weather Observations Website. Weather, 76(2): pp. 4749 doi: 10.1002/wea.3856CrossRefGoogle Scholar
Burt, Stephen, 2020: The Climatological Observers Link (COL) at 50. Weather, 75(5): pp. 137144CrossRefGoogle Scholar
Details of the US voluntary COOP observers awards scheme (updated November 2019) can be found at www.nws.noaa.gov/directives/sym/pd01013014curr.pdfGoogle Scholar
Carter, H. E., 1948: Seventy-five years of rainfall recording. Meteorological Magazine: pp. 234235Google Scholar
More details on the US COOP programme can be found at www.weather.gov/coop/overviewGoogle Scholar
Ogden, R.J., 1978: Co-operating observers and the climatological network. Meteorological Magazine, 107: pp. 209218Google Scholar
Merlone, A., G. Lopardo, F. Sanna et al., 2015: The MeteoMet project – metrology for meteorology: challenges and results. Meteorological Applications, 22(S1): pp. 820829. doi: 10.1002/met.1528CrossRefGoogle Scholar
Burt, Stephen, 2014: Trials of the low-cost, high-accuracy CoCoRaHS raingauge. Climatological Observers Link Bulletin, 532: pp. 2930Google Scholar
Daily rainfall totals over the 12 months ending April 2023 at the Stratfield Mortimer Observatory in central southern England (51°N, 1°W). Minor breaks in record for maintenance purposes, and for periods of snowfall, have been estimated to complete the recordsGoogle Scholar
Bell, Simon, Cornford, Dan, and Bastin, Lucy, 2013: The state of automated amateur weather observations. Weather, 68(2): pp. 3641. doi:10.1002/wea.1980CrossRefGoogle Scholar
Bell, Simon, Cornford, Dan, and Bastin, Lucy, 2015: How good are citizen weather stations? Addressing a biased opinion. Weather, 70(3): pp. 7584. doi:10.1002/wea.2316CrossRefGoogle Scholar
Brooks, C. E. P. and Carruthers, N., 1953: Handbook of statistical methods in meteorology. London: HMSO. Vector mean winds, pp. 178191. More details on the method can be obtained from Webmet.com: www.webmet.com/met_monitoring/62.htmlGoogle Scholar

Save book to Kindle

To save this book to your Kindle, first ensure [email protected] is added to your Approved Personal Document E-mail List under your Personal Document Settings on the Manage Your Content and Devices page of your Amazon account. Then enter the ‘name’ part of your Kindle email address below. Find out more about saving to your Kindle.

Note you can select to save to either the @free.kindle.com or @kindle.com variations. ‘@free.kindle.com’ emails are free but can only be saved to your device when it is connected to wi-fi. ‘@kindle.com’ emails can be delivered even when you are not connected to wi-fi, but note that service fees apply.

Find out more about the Kindle Personal Document Service.

  • References and Further Reading
  • Stephen Burt, Fellow of the Royal Meteorological Society
  • Book: The Weather Observer's Handbook
  • Online publication: 21 May 2024
  • Chapter DOI: https://doi.org/10.1017/9781009260534.028
Available formats
×

Save book to Dropbox

To save content items to your account, please confirm that you agree to abide by our usage policies. If this is the first time you use this feature, you will be asked to authorise Cambridge Core to connect with your account. Find out more about saving content to Dropbox.

  • References and Further Reading
  • Stephen Burt, Fellow of the Royal Meteorological Society
  • Book: The Weather Observer's Handbook
  • Online publication: 21 May 2024
  • Chapter DOI: https://doi.org/10.1017/9781009260534.028
Available formats
×

Save book to Google Drive

To save content items to your account, please confirm that you agree to abide by our usage policies. If this is the first time you use this feature, you will be asked to authorise Cambridge Core to connect with your account. Find out more about saving content to Google Drive.

  • References and Further Reading
  • Stephen Burt, Fellow of the Royal Meteorological Society
  • Book: The Weather Observer's Handbook
  • Online publication: 21 May 2024
  • Chapter DOI: https://doi.org/10.1017/9781009260534.028
Available formats
×