Skip to main content Accessibility help
×
Hostname: page-component-586b7cd67f-tf8b9 Total loading time: 0 Render date: 2024-11-22T17:25:12.142Z Has data issue: false hasContentIssue false

References to R Packages

Published online by Cambridge University Press:  11 May 2024

John H. Maindonald
Affiliation:
Statistics Research Associates, Wellington, New Zealand
W. John Braun
Affiliation:
University of British Columbia, Okanagan
Jeffrey L. Andrews
Affiliation:
University of British Columbia, Okanagan
Get access

Summary

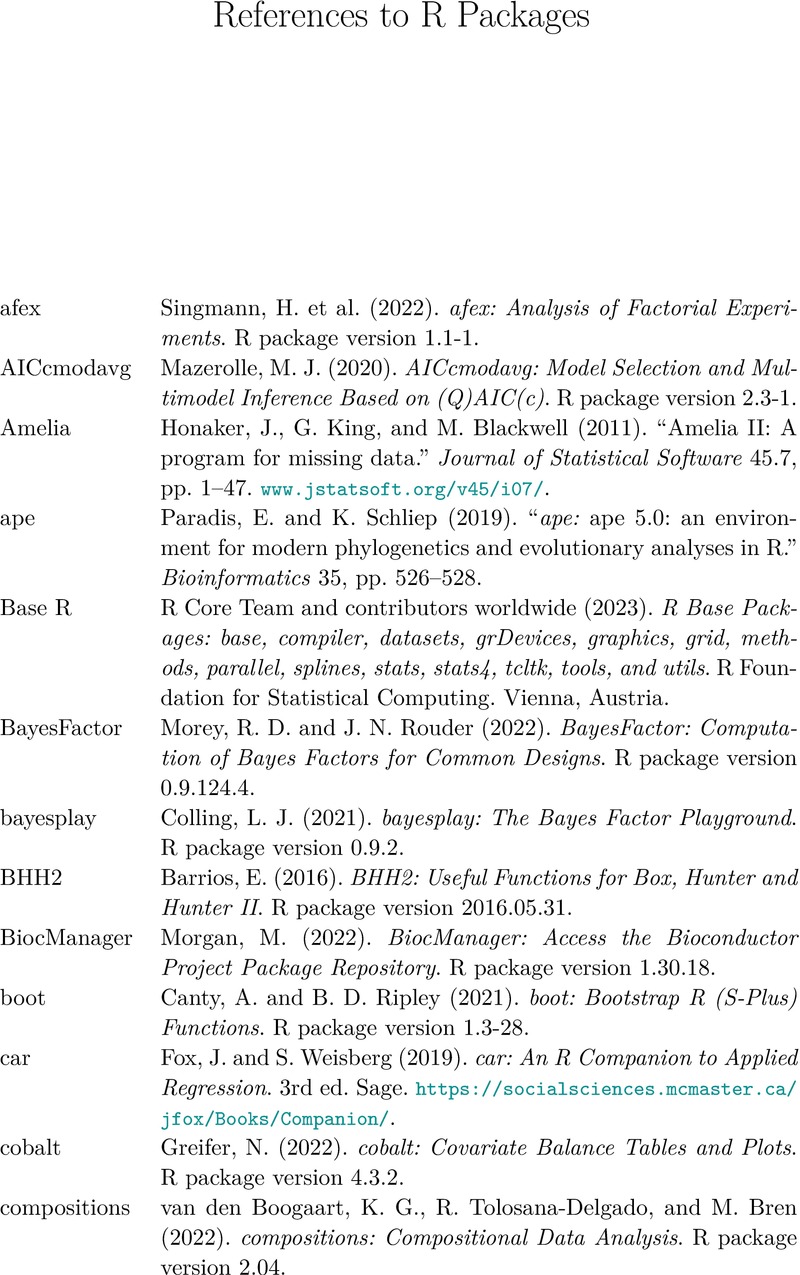
Image of the first page of this content. For PDF version, please use the ‘Save PDF’ preceeding this image.'
Type
Chapter
Information
A Practical Guide to Data Analysis Using R
An Example-Based Approach
, pp. 508 - 513
Publisher: Cambridge University Press
Print publication year: 2024

Access options

Get access to the full version of this content by using one of the access options below. (Log in options will check for institutional or personal access. Content may require purchase if you do not have access.)

References

References to R Packages

Singmann, H. et al. (2022). afex: Analysis of Factorial Experiments. R package version 1.1-1.Google Scholar
Mazerolle, M. J. (2020). AICcmodavg: Model Selection and Multimodel Inference Based on (Q)AIC(c). R package version 2.3-1.Google Scholar
Honaker, J., King, G., and Blackwell, M. (2011). “Amelia II: A program for missing data.” Journal of Statistical Software 45.7, pp. 147. www.jstatsoft.org/v45/i07/.CrossRefGoogle Scholar
Paradis, E. and Schliep, K. (2019). “ape: ape 5.0: an environment for modern phylogenetics and evolutionary analyses in R.” Bioinformatics 35, pp. 526528.CrossRefGoogle ScholarPubMed
R Core Team and contributors worldwide (2023). R Base Packages: base, compiler, datasets, grDevices, graphics, grid, methods, parallel, splines, stats, stats4, tcltk, tools, and utils. R Foundation for Statistical Computing. Vienna, Austria.Google Scholar
Morey, R. D. and Rouder, J. N. (2022). BayesFactor: Computation of Bayes Factors for Common Designs. R package version 0.9.124.4.Google Scholar
Colling, L. J. (2021). bayesplay: The Bayes Factor Playground. R package version 0.9.2.Google Scholar
Barrios, E. (2016). BHH2: Useful Functions for Box, Hunter and Hunter II. R package version 2016.05.31.Google Scholar
Morgan, M. (2022). BiocManager: Access the Bioconductor Project Package Repository. R package version 1.30.18.Google Scholar
Canty, A. and Ripley, B. D. (2021). boot: Bootstrap R (S-Plus) Functions. R package version 1.3-28.Google Scholar
Fox, J. and Weisberg, S. (2019). car: An R Companion to Applied Regression. 3rd ed. Sage. https://socialsciences.mcmaster.ca/jfox/Books/Companion/.Google Scholar
Greifer, N. (2022). cobalt: Covariate Balance Tables and Plots. R package version 4.3.2.Google Scholar
van den Boogaart, K. G., Tolosana-Delgado, R., and Bren, M. (2022). compositions: Compositional Data Analysis. R package version 2.04.Google Scholar
Maindonald, J. H. and Braun, W. J. (2011). DAAG: Data analysis and graphics using R. An Example-Based Approach. 3rd ed. The DAAG package was created to support this text. Cambridge University Press.Google Scholar
Maindonald, J. (2017). DAAGbio: Data Sets and Functions, for Demonstrations with Expression Arrays and Gene Sequences. R package version 0.63-3.Google Scholar
Hartig, F. (2022). DHARMa: Residual Diagnostics for Hierarchical (Multi-Level / Mixed) Regression Models. R package version 0.4.5.Google Scholar
Lumley, T. (2022). dichromat: Color Schemes for Dichromats. R package version 2.0-0.1.Google Scholar
Wickham, H. et al. (2022). dplyr: A Grammar of Data Manipulation. R package version 1.0.9.Google Scholar
Meyer, D. et al. (2022). e1071: Misc Functions of the Department of Statistics, Probability Theory Group (Formerly: E1071), TU Wien. R package version 1.7-11.Google Scholar
Fox, J. and Weisberg, S. (2018). “effects: Visualizing fit and lack of fit in complex regression models with predictor effect plots and partial residuals.” Journal of Statistical Software 87.9, pp. 127. https://doi.org/10.18637/jss.v087.i09.CrossRefGoogle Scholar
Ben-Shachar, M. S., Lüdecke, D., and Makowski, D. (2020). “effectsize: Estimation of effect size indices and standardized parameters.” Journal of Open Source Software 5.56, p. 2815. https://doi.org/10.21105/joss.02815.CrossRefGoogle Scholar
Hyndman, R. et al. (2022). forecast: Forecasting functions for time series and linear models. R package version 8.16. https://pkg.robjhyndman.com/forecast/.Google Scholar
Fortran code by Alan Miller, T. l. based on (2020). leaps: Regression Subset Selection. R package version 3.1.Google Scholar
Rigby, R. A. and Stasinopoulos, D. M. (2005). “gamlss: Generalized additive models for location, scale and shape (with discussion).” Applied Statistics 54, pp. 507554.Google Scholar
Hurley, C. (2019). gclus: Clustering Graphics. R package version 1.3.2.Google Scholar
Barrett, M. (2022). ggdag: Analyze and Create Elegant Directed Acyclic Graphs. R package version 0.2.6.Google Scholar
Wickham, H. (2016). ggplot2: Elegant Graphics for Data Analysis. Springer-Verlag. https://ggplot2.tidyverse.org.CrossRefGoogle Scholar
Brooks, M. E. et al. (2017). “glmmTMB: glmmTMB balances speed and flexibility among packages for zero-inflated generalized linear mixed modeling.” The R Journal 9.2, pp. 378400. https://journal.r-project.org/archive/2017/RJ-2017-066/index.html.CrossRefGoogle Scholar
Warnes, G. R. et al. (2022). gmodels: Various R Programming Tools for Model Fitting. R package version 2.18.1.1.Google Scholar
Auguie, B. (2017). gridExtra: Miscellaneous Functions for “Grid” Graphics. R package version 2.3.Google Scholar
Maindonald, J. H. and Burden, C. J. (2005). “hddplot: Selection bias in plots of microarray or other data that have been sampled from a high-dimensional space.” In Proceedings of 12th Computational Techniques and Applications Conference CTAC-200). Ed. by May, R. and Roberts, A. J.. Vol. 46, pp. C59C74. journal.austms.org.au/V46/CTAC2004/Main/home.html.Google Scholar
Harrell, F. E. Jr (2022). Hmisc: Harrell Miscellaneous. R package version 4.7-1.Google Scholar
Moritz, S. and Bartz-Beielstein, T. (2017). “imputeTS: Time series missing value imputation in R.” The R Journal 9.1, pp. 207218. https://doi.org/10.32614/RJ-2017-009.CrossRefGoogle Scholar
Greenwell, B. M. and Kabban, C. M. S. (2014). “investr: An R package for inverse estimation.” The R Journal 6.1, pp. 90100. https://doi.org/10.32614/RJ-2014-009.CrossRefGoogle Scholar
Wand, M. (2021). KernSmooth: Functions for Kernel Smoothing Supporting Wand & Jones (1995). R package version 2.23-20.Google Scholar
Xie, Y. (2023). knitr: A General-Purpose Package for Dynamic Report Generation in R. R package version 1.42. https://yihui.org/knitr/.Google Scholar
Sarkar, D. (2008). lattice: Lattice: Multivariate Data Visualization with R. Springer. http://lmdvr.r-forge.r-project.org.Google Scholar
Sarkar, D. and Andrews, F. (2022). latticeExtra: Extra Graphical Utilities Based on Lattice. R package version 0.6-30.Google Scholar
Ritchie, M. E. et al. (2015). “limma: limma powers differential expression analyses for RNA-sequencing and microarray studies.” Nucleic Acids Research 43, e47. https://doi.org/10.1093/nar/gkv007. (Install using Bioconductor::install().)CrossRefGoogle ScholarPubMed
Bates, D. et al. (2015). “lme4: Fitting linear mixed-effects models using lme4.” Journal of Statistical Software 67.1, pp. 148. https://doi.org/10.18637/jss.v067.i01.CrossRefGoogle Scholar
Zeileis, A. and Hothorn, T. (2002). “lmtest: Diagnostic checking in regression relationships.” R News 2.3, pp. 710.Google Scholar
Efron, B., Turnbull, B., and Narasimhan, B. (2015). locfdr: Computes Local False Discovery Rates. R package version 1.1-8.Google Scholar
Venables, W. N. and Ripley, B. D. (2002). MASS: Modern Applied Statistics with S. 4th ed. Springer. www.stats.ox.ac.uk/pub/MASS4/.CrossRefGoogle Scholar
Ho, D. E. et al. (2011). “MatchIt: Nonparametric preprocessing for parametric causal inference.” Journal of Statistical Software 42.8, pp. 128. https://doi.org/10.18637/jss.v042.i08.CrossRefGoogle Scholar
Martin, A. D., Quinn, K. M., and Park, J. H. (2011). “MCMC-pack: Markov Chain Monte Carlo in R.” Journal of Statistical Software 42.9, p. 22. https://doi.org/10.18637/jss.v042.i09.CrossRefGoogle Scholar
Bates, D., Maechler, M., and Bolker, B. (2019). MEMSS: Data Sets from Mixed-Effects Models in S. R package version 0.9-3.Google Scholar
Wood, S. N. (2021). mgcv Package – Resources. www.maths.ed.ac.uk/~swood34/mgcv/.Google Scholar
Fasiolo, M. et al. (2018). “Scalable visualisation methods for modern generalized additive models.” Arxiv preprint. https://arxiv.org/abs/1809.10632.Google Scholar
van Buuren, S. and Groothuis-Oudshoorn, K. (2011). “mice: Multivariate imputation by chained equations in R.” Journal of Statistical Software 45.3, pp. 167. https://doi.org/10.18637/jss.v045.i03. www.gerkovink.com/miceVignettes/.Google Scholar
Robitzsch, A. and Grund, S. (2023). miceadds: Some Additional Multiple Imputation Functions, Especially for ‘mice’. R package version 3.16-18.Google Scholar
Audigier, V. and Resche-Rigon, M. (2021). micemd: Multiple Imputation by Chained Equations with Multilevel Data. R package version 1.8.0.Google Scholar
Stekhoven, D. J. and Buehlmann, P. (2012). “missForest: Miss-Forest – non-parametric missing value imputation for mixed-type data.” Bioinformatics 28.1, pp. 112118. https://academic.oup.com/bioinformatics/article/28/1/112/219101?.CrossRefGoogle ScholarPubMed
Braun, W. J. and MacQueen, S. (2022). MPV: Data Sets from Montgomery, Peck and Vining. R package version 1.58.Google Scholar
Hess, K. and Gentleman, R. (2021). muhaz: Hazard Function Estimation in Survival Analysis. R package version 1.2.6.4.Google Scholar
Pollard, K. S., Dudoit, S., and van der Laan, M. J. (2005). “Multiple testing procedures: R multtest package and applications to genomics.” In Bioinformatics and Computational Biology Solutions Using R and Bioconductor. Springer. (Install using Bioconductor::install().)Google Scholar
Genz, A. et al. (2021). mvtnorm: Multivariate Normal and t Distributions. R package version 1.1-3.Google Scholar
Pinheiro, J., Bates, D., and R Core Team (2022). nlme: Linear and Nonlinear Mixed Effects Models. R package version 3.1-158.Google Scholar
Venables, W. N. and Ripley, B. D. (2002). nnet: Modern Applied Statistics with S. 4th ed. Springer. www.stats.ox.ac.uk/pub/MASS4/.CrossRefGoogle Scholar
Venables, W. N. and Hornik, K. (2016). oz: Plot the Australian Coastline and States. R package version 1.0-21. S original by Bill Venables, R port by Kurt Hornik.Google Scholar
Wickham, H. (2011). “plyr: The split-apply-combine strategy for data analysis.” Journal of Statistical Software 40.1, pp. 129. www.jstatsoft.org/v40/i01/.CrossRefGoogle Scholar
Fasiolo, M. et al. (2021). “qgam: Bayesian nonparametric quantile regression modeling in R.” Journal of Statistical Software 100.9, pp. 131. https://doi.org/10.18637/jss.v100.i09.CrossRefGoogle Scholar
Maindonald, J. H. (2021). qra: Quantal Response Analysis for Dose-Mortality Data. R package version 0.2.7.Google Scholar
Liaw, A. and Wiener, M. (2002). “randomForest: Classification and regression by randomForest.” R News 2.3, pp. 1822.Google Scholar
Fox, J. and Bouchet-Valat, M. (2022). Rcmdr: R Commander. R package version 2.8-0. https://socialsciences.mcmaster.ca/jfox/Misc/Rcmdr/.Google Scholar
Neuwirth, E. (2022). RColorBrewer: ColorBrewer Palettes. R package version 1.1-3.Google Scholar
Held, L., Micheloud, C., and Pawel, S. (2021). “ReplicationSuccess: The assessment of replication success based on relative effect size.” The Annals of Applied Statistics 16.2, pp. 706720. https://doi.org/10.1214/21-AOAS1502.Google Scholar
Wickham, H. (2007). “reshape2: Reshaping data with the reshape package.” Journal of Statistical Software 21.12, pp. 120. www.jstatsoft.org/v21/i12/.CrossRefGoogle Scholar
Murdoch, D. and Adler, D. (2021). rgl: 3D Visualization Using OpenGL. R package version 0.108.3.Google Scholar
Maechler, M. et al. (2022). robustbase: Basic Robust Statistics. R package version 0.95-0. http://robustbase.r-forge.r-project.org/.Google Scholar
Therneau, T. and Atkinson, B. (2022). rpart: Recursive Partitioning and Regression Trees. R package version 4.1.16.Google Scholar
Milborrow, S. (2022). rpart.plot: Plot ‘rpart’ Models: An Enhanced Version of ’plot.rpart’. R package version 3.1.1.Google Scholar
Rundel, C. et al. (2021). statsr: Companion Software for the Coursera Statistics with R Specialization. R package version 0.3.0.Google Scholar
Pya, N. (2021). scam: Shape Constrained Additive Models. R package version 1.2-12.Google Scholar
Therneau, T. M. and Grambsch, P. M. (2000). Modeling Survival Data: Extending the Cox Model. Springer.CrossRefGoogle Scholar
Andrews, J. L. et al. (2018). “teigen: An R package for model-based clustering and classification via the multivariate t distribution.” Journal of Statistical Software 83.7, pp. 132. http://doi.org/10.18637/jss.v083.i07.CrossRefGoogle Scholar
Wickham, H. and Girlich, M. (2022). tidyr: Tidy Messy Data. R package version 1.2.0.Google Scholar
Trapletti, A. and Hornik, K. (2022). tseries: Time Series Analysis and Computational Finance. R package version 0.10-51.Google Scholar
Meyer, D., Zeileis, A., and Hornik, K. (2022). vcd: Visualizing Categorical Data. R package version 1.4-10.Google Scholar
Yee, T. W. (2023). VGAM: Vector Generalized Linear and Additive Models. R package version 1.1-8.Google Scholar
Arel-Bundock, V. (2022). WDI: World Development Indicators and Other World Bank Data. R package version 2.7.7.Google Scholar
Dahl, D. B. et al. (2019). xtable: Export Tables to LaTeX or HTML. R package version 1.8-4.Google Scholar
Zeileis, A. and Grothendieck, G. (2005). “zoo: S3 infrastructure for regular and irregular time series.” Journal of Statistical Software 14.6, pp. 127. https://doi.org/10.18637/jss.v014.i06.CrossRefGoogle Scholar

Save book to Kindle

To save this book to your Kindle, first ensure [email protected] is added to your Approved Personal Document E-mail List under your Personal Document Settings on the Manage Your Content and Devices page of your Amazon account. Then enter the ‘name’ part of your Kindle email address below. Find out more about saving to your Kindle.

Note you can select to save to either the @free.kindle.com or @kindle.com variations. ‘@free.kindle.com’ emails are free but can only be saved to your device when it is connected to wi-fi. ‘@kindle.com’ emails can be delivered even when you are not connected to wi-fi, but note that service fees apply.

Find out more about the Kindle Personal Document Service.

Available formats
×

Save book to Dropbox

To save content items to your account, please confirm that you agree to abide by our usage policies. If this is the first time you use this feature, you will be asked to authorise Cambridge Core to connect with your account. Find out more about saving content to Dropbox.

Available formats
×

Save book to Google Drive

To save content items to your account, please confirm that you agree to abide by our usage policies. If this is the first time you use this feature, you will be asked to authorise Cambridge Core to connect with your account. Find out more about saving content to Google Drive.

Available formats
×