
Introduction
Community-based surveys have identified that a substantial proportion of individuals who do not have a confirmed psychotic disorder endorse items related to the presence of hallucinations and delusions (psychotic experiences, PEs). For example, a meta-analysis (based on 61 studies) reported a median lifetime prevalence of PEs of 7.2% (Linscott & van Os Reference Linscott and van Os2013). These estimates were substantially higher than the lifetime prevalence of psychotic disorders such as schizophrenia (median estimate 0.4%) (Saha et al. Reference Saha, Chant and Welham2005), and the field of psychiatric epidemiology has reappraised how these experiences ‘fit’ into the epidemiologic landscape of psychotic disorders. The terminology to describe these experiences has also been revised in recent years. Sometimes referred to as psychotic-like experiences or psychosis-like symptoms, we will use the general term psychotic experiences (PEs), and the specific terms hallucinatory experiences (HEs) and delusional experiences (DEs) in this chapter.
Understandably, early work on the epidemiology of PEs was focused on the utility of these experiences as risk indicators for later conversion to full psychosis (Hanssen et al. Reference Hanssen, Bak and Bijl2005; Werbeloff et al. Reference Werbeloff, Drukker and Dohrenwend2012). There was an appealing logic to this research, as many of the risk factors associated with PEs are also associated with schizophrenia/psychosis (e.g. cannabis, trauma, physical health) (Scott et al. Reference Scott, Chant and Andrews2007; Kelleher & Cannon Reference Kelleher and Cannon2010; Saha et al. Reference Saha, Scott and Varghese2011a). More recently, the evidence has indicated that PEs are also associated with a wide array of common mental disorders including anxiety, mood, and substance-use disorders (Johns et al. Reference Johns, Cannon and Singleton2004; Freeman & Fowler Reference Freeman and Fowler2009; Saha et al. Reference Saha, Scott and Varghese2011a; Varghese et al. Reference Varghese, Saha and Scott2011b; Yung et al. Reference Yung, Phillips and Nelson2011; Saha et al. Reference Saha, Scott and Varghese2012). A prospective population-based study from Israel confirmed that those with PEs at baseline had an increased risk of being hospitalized for both psychotic disorders and non-psychotic (mental) disorders over the following 24 years (Kaymaz et al. Reference Kaymaz, Drukker and Lieb2012). There is also evidence that individuals who report PEs have a significantly increased risk of suicidal ideation, intent, and attempts (Nishida et al. Reference Nishida, Sasaki and Nishimura2010; Saha et al. Reference Saha, Scott and Varghese2011a–Reference Saha, Scott and Varghese2011e; Kelleher and Cannon Reference Nishida, Sasaki and Nishimura2010; Kelleher et al. Reference Kelleher and Cannon2014). As the empirical data have accumulated, there has been debate about whether PEs represent a continuum of psychopathology (analogous with mild vs. severe depression), and/or a ‘form fruste’ or attenuated expression of psychosis that may persist and worsen over time (David Reference David2010; Kaymaz & van Os Reference Kaymaz and van Os2010; Lawrie et al. Reference Lawrie, Hall and McIntosh2010; Sommer Reference Sommer2010).
The first wave of studies on PEs had several major limitations. First, the studies contributing to the systematic reviews have assessed PEs using a wide array of scales and diagnostic instruments – 20 different instruments were identified in the most recent systematic review (Linscott & van Os Reference Linscott and van Os2013). In order to allow synthesis of these data, PE data are usually dichotomized (lifetime prevalence present/absent). There is a need for studies that can efficiently measure different types of PEs and retain more fine-grain data related to PEs. Second, much of the previous research has examined associations between lifetime PEs and lifetime mental disorders regardless of temporal priority. There is a lack of empirical data on whether temporally primary common mental disorders are associated with an increased risk of subsequent first onset of PEs, and conversely, which mental disorders are predicted by pre-existing PEs. The World Mental Health (WMH) surveys provide a suitable cross-national platform to explore the epidemiology of PEs. For example, WMH analyses provide more textured information about comorbidity between PEs and other mental disorders, and can take into account the temporal order of these events based on retrospective reports of ages of onset. The surveys also allow us to provide much more detailed information than previous studies about risk factors, with a special focus on parental psychopathology, childhood adversities, and exposure to traumatic experiences that precede the onset of the PEs. The aim of this chapter is to present the lifetime and 12-month prevalence of PEs, DEs and HEs and explore key socio-demographic correlates of PEs based on the WMH surveys data.
Methods
Eighteen WMH surveys completed the Composite International Diagnostic Interview (CIDI) Psychosis Module (Kessler & Üstün Reference Kessler, Üstün, Kessler and Üstün2008). In keeping with previous studies of PEs (Scott et al. Reference Scott, Chant and Andrews2007; Saha et al. Reference Saha, Scott and Varghese2011a–e, Reference Saha, Scott and Varghese2012, Reference Saha, Scott and Varghese2013; Varghese et al. Reference Varghese, Saha and Scott2011a), we made the a priori decision to exclude individuals who had PEs but who also screened positive for possible schizophrenia/psychosis, and manic-depression/mania. Thus, we excluded respondents who (a) reported (1) schizophrenia/psychosis or (2) manic-depression/mania in response to the question ‘What did the doctor say was causing (this/these) experiences?’ or (b) reported lifetime use of an antipsychotic medication for these symptoms. This resulted in the exclusion of 140 respondents (0.4% of all respondents), leaving 31,261 respondents for this study. Analyses in this chapter were based on the weighted Part II subsample of respondents administered the CIDI Psychosis Module.
The CIDI Psychosis Module included questions about six PE types – two related to HEs (visual hallucinations, auditory hallucinations) and four related to DEs (two ‘bizarre’ delusional items – thought insertion/withdrawal, mind control/passivity; two ‘paranoid’ delusional items – ideas of reference, plot to harm/follow). For example, respondents were asked if they ever experienced PEs (e.g. ‘Have you ever heard any voices that other people said did not exist?’) (Table 19.1). This was followed by a probe question to determine if the reported PEs ever occurred when the person was ‘not dreaming, not half-asleep, or not under the influence of alcohol or drugs’. Only responses of the latter type are considered here.
Table 19.1 Six CIDI psychotic experiences items
| Saw a vision: Did you ever see something that wasn't really there that other people could not see? |
| Heard voices: Did you ever hearing things that other people said did not exist, like strange voices coming from inside your head talking to you or about you, or voices coming out of the air when there was no one around? |
| Thought insertion: Did you ever believe that some mysterious force was inserting many different strange thoughts – that were definitely not your own thoughts – directly into your head by means of x-rays or laser beams or other methods? |
| Mind control/passivity: Did you ever feel that your mind had been taken over by strange forces with laser beams or other methods that were making you do things you did not choose to do? |
| Ideas of reference: Did you ever believe that some strange force was trying to communicate directly with you by sending special signs or signals that you could understand but that no one else could understand. Sometimes this happens by special signs coming through the radio or television? |
| Plot to harm/follow: Did you ever believe that there was an unjust plot going on to harm you or to have people follow you that your family and friends did not believe existed? |
Respondents who reported PEs were then asked about: (a) presence of the PEs in the past 12 months and (b) frequency/occurrences of the PEs in their lifetime. We present prevalence estimates for any PEs, any HEs (with or without associated DEs), any DEs (with or without associated HEs), ‘pure’ HEs (without DEs), and ‘pure’ DEs (without HEs). In addition, we present key PE-related metrics: (a) count of types of PEs (henceforth referred to as PEs type metric) and (b) cumulative or annual frequency of occurrence of PEs episodes. Respondents who reported PEs were also asked probe questions about the age-of-onset (AOO) of PEs (i.e. How old were you the very first time (this/either of these things/any of these things) happened to you?).
Generic statistical methods are detailed in Chapter 3. This chapter includes an additional analysis that investigated bi-directionality in comorbidity with mental disorders. For this, discrete-time survival analyses (Singer & Willett Reference Singer and Willett1993) with person-year as the unit of analysis and time-varying measures for prior onset of other mental disorders were used to examine the predictive associations of temporally prior disorders with the subsequent onset of each mental disorder considered in the analysis. We estimated survival models that examined bivariate associations between PEs and only one common mental disorder at a time (with adjustment for age-cohorts, gender, person-year, education, marital and employment status, and country) as well as multivariate models that included information on all temporally primary common mental disorders to predict the outcome disorder. The latter models included measures of number of prior mental disorders.
Results
Prevalence
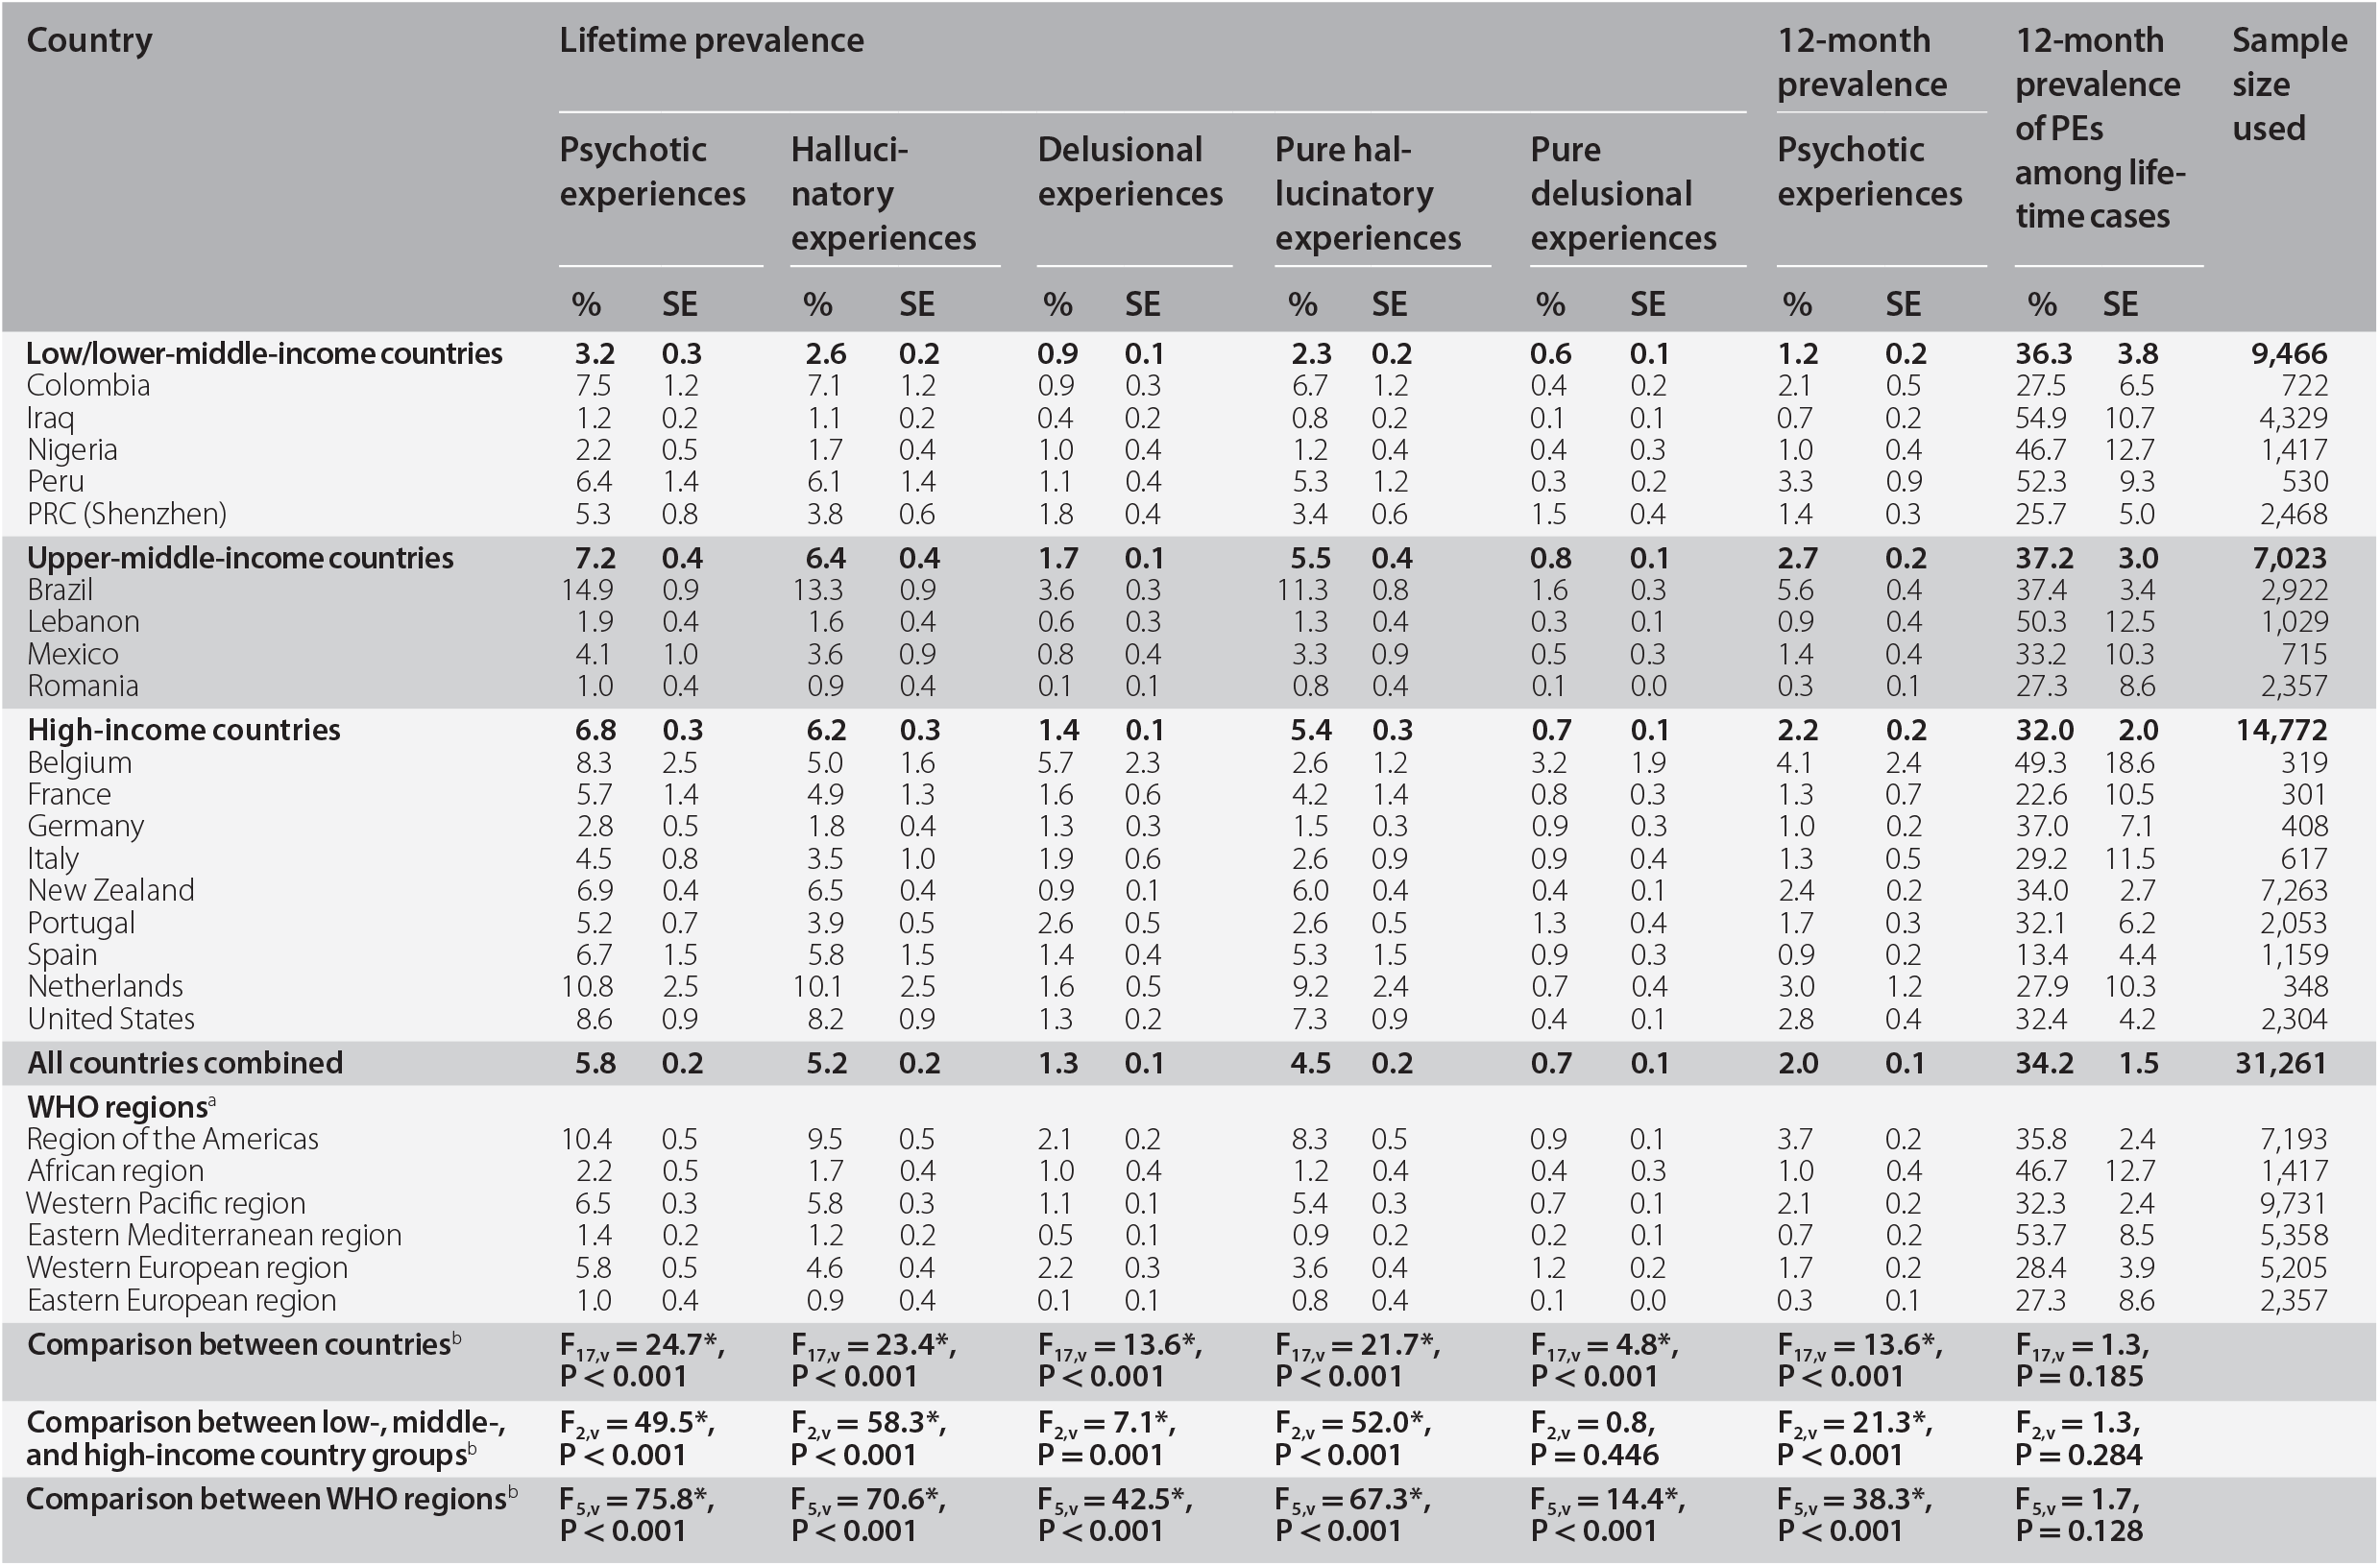
Table 19.2 presents country-specific lifetime PEs prevalence estimates. In all countries combined, lifetime prevalence of any PE is 5.8%, of any HE it is 5.2%, and of any DE it is 1.3%. Twelve-month prevalence of any PEs is 2.0%. From additional analyses reported in a prior publication, prevalence of lifetime PEs is significantly higher among women than men (6.6% vs. 5.0%) (McGrath et al. Reference McGrath, Saha and Al-Hamzawi2015). Similar gender differences are found for prevalence of HEs but not DEs. The significant gender difference is also found for respondents with ‘pure’ HEs, but not ‘pure’ DEs. Significant differences are evident across the three country income groups in lifetime prevalence of any different PEs (Table 19.2). In each comparison the prevalence estimates are lower among respondents in low/lower-middle-income countries than in upper-middle- and high-income countries. Significant differences are also found between WHO regions. For example, regions of the Americas, Western Pacific, and Western European have higher prevalence compared to other regions that represent low-income countries.
Table 19.2 Prevalence of psychotic experiences in the World Mental Health surveys
| Country | Lifetime prevalence | 12-month prevalence | 12-month prevalence of PEs among lifetime cases | Sample size used | |||||||||||||||||||
|---|---|---|---|---|---|---|---|---|---|---|---|---|---|---|---|---|---|---|---|---|---|---|---|
| Psychotic experiences | Hallucinatory experiences | Delusional experiences | Pure hallucinatory experiences | Pure delusional experiences | Psychotic experiences | ||||||||||||||||||
| % | SE | % | SE | % | SE | % | SE | % | SE | % | SE | % | SE | ||||||||||
| Low/lower-middle-income countries | 3.2 | 0.3 | 2.6 | 0.2 | 0.9 | 0.1 | 2.3 | 0.2 | 0.6 | 0.1 | 1.2 | 0.2 | 36.3 | 3.8 | 9,466 | ||||||||
| Colombia | 7.5 | 1.2 | 7.1 | 1.2 | 0.9 | 0.3 | 6.7 | 1.2 | 0.4 | 0.2 | 2.1 | 0.5 | 27.5 | 6.5 | 722 | ||||||||
| Iraq | 1.2 | 0.2 | 1.1 | 0.2 | 0.4 | 0.2 | 0.8 | 0.2 | 0.1 | 0.1 | 0.7 | 0.2 | 54.9 | 10.7 | 4,329 | ||||||||
| Nigeria | 2.2 | 0.5 | 1.7 | 0.4 | 1.0 | 0.4 | 1.2 | 0.4 | 0.4 | 0.3 | 1.0 | 0.4 | 46.7 | 12.7 | 1,417 | ||||||||
| Peru | 6.4 | 1.4 | 6.1 | 1.4 | 1.1 | 0.4 | 5.3 | 1.2 | 0.3 | 0.2 | 3.3 | 0.9 | 52.3 | 9.3 | 530 | ||||||||
| PRC (Shenzhen) | 5.3 | 0.8 | 3.8 | 0.6 | 1.8 | 0.4 | 3.4 | 0.6 | 1.5 | 0.4 | 1.4 | 0.3 | 25.7 | 5.0 | 2,468 | ||||||||
| Upper-middle-income countries | 7.2 | 0.4 | 6.4 | 0.4 | 1.7 | 0.1 | 5.5 | 0.4 | 0.8 | 0.1 | 2.7 | 0.2 | 37.2 | 3.0 | 7,023 | ||||||||
| Brazil | 14.9 | 0.9 | 13.3 | 0.9 | 3.6 | 0.3 | 11.3 | 0.8 | 1.6 | 0.3 | 5.6 | 0.4 | 37.4 | 3.4 | 2,922 | ||||||||
| Lebanon | 1.9 | 0.4 | 1.6 | 0.4 | 0.6 | 0.3 | 1.3 | 0.4 | 0.3 | 0.1 | 0.9 | 0.4 | 50.3 | 12.5 | 1,029 | ||||||||
| Mexico | 4.1 | 1.0 | 3.6 | 0.9 | 0.8 | 0.4 | 3.3 | 0.9 | 0.5 | 0.3 | 1.4 | 0.4 | 33.2 | 10.3 | 715 | ||||||||
| Romania | 1.0 | 0.4 | 0.9 | 0.4 | 0.1 | 0.1 | 0.8 | 0.4 | 0.1 | 0.0 | 0.3 | 0.1 | 27.3 | 8.6 | 2,357 | ||||||||
| High-income countries | 6.8 | 0.3 | 6.2 | 0.3 | 1.4 | 0.1 | 5.4 | 0.3 | 0.7 | 0.1 | 2.2 | 0.2 | 32.0 | 2.0 | 14,772 | ||||||||
| Belgium | 8.3 | 2.5 | 5.0 | 1.6 | 5.7 | 2.3 | 2.6 | 1.2 | 3.2 | 1.9 | 4.1 | 2.4 | 49.3 | 18.6 | 319 | ||||||||
| France | 5.7 | 1.4 | 4.9 | 1.3 | 1.6 | 0.6 | 4.2 | 1.4 | 0.8 | 0.3 | 1.3 | 0.7 | 22.6 | 10.5 | 301 | ||||||||
| Germany | 2.8 | 0.5 | 1.8 | 0.4 | 1.3 | 0.3 | 1.5 | 0.3 | 0.9 | 0.3 | 1.0 | 0.2 | 37.0 | 7.1 | 408 | ||||||||
| Italy | 4.5 | 0.8 | 3.5 | 1.0 | 1.9 | 0.6 | 2.6 | 0.9 | 0.9 | 0.4 | 1.3 | 0.5 | 29.2 | 11.5 | 617 | ||||||||
| New Zealand | 6.9 | 0.4 | 6.5 | 0.4 | 0.9 | 0.1 | 6.0 | 0.4 | 0.4 | 0.1 | 2.4 | 0.2 | 34.0 | 2.7 | 7,263 | ||||||||
| Portugal | 5.2 | 0.7 | 3.9 | 0.5 | 2.6 | 0.5 | 2.6 | 0.5 | 1.3 | 0.4 | 1.7 | 0.3 | 32.1 | 6.2 | 2,053 | ||||||||
| Spain | 6.7 | 1.5 | 5.8 | 1.5 | 1.4 | 0.4 | 5.3 | 1.5 | 0.9 | 0.3 | 0.9 | 0.2 | 13.4 | 4.4 | 1,159 | ||||||||
| Netherlands | 10.8 | 2.5 | 10.1 | 2.5 | 1.6 | 0.5 | 9.2 | 2.4 | 0.7 | 0.4 | 3.0 | 1.2 | 27.9 | 10.3 | 348 | ||||||||
| United States | 8.6 | 0.9 | 8.2 | 0.9 | 1.3 | 0.2 | 7.3 | 0.9 | 0.4 | 0.1 | 2.8 | 0.4 | 32.4 | 4.2 | 2,304 | ||||||||
| All countries combined | 5.8 | 0.2 | 5.2 | 0.2 | 1.3 | 0.1 | 4.5 | 0.2 | 0.7 | 0.1 | 2.0 | 0.1 | 34.2 | 1.5 | 31,261 | ||||||||
| WHO regionsa | |||||||||||||||||||||||
| Region of the Americas | 10.4 | 0.5 | 9.5 | 0.5 | 2.1 | 0.2 | 8.3 | 0.5 | 0.9 | 0.1 | 3.7 | 0.2 | 35.8 | 2.4 | 7,193 | ||||||||
| African region | 2.2 | 0.5 | 1.7 | 0.4 | 1.0 | 0.4 | 1.2 | 0.4 | 0.4 | 0.3 | 1.0 | 0.4 | 46.7 | 12.7 | 1,417 | ||||||||
| Western Pacific region | 6.5 | 0.3 | 5.8 | 0.3 | 1.1 | 0.1 | 5.4 | 0.3 | 0.7 | 0.1 | 2.1 | 0.2 | 32.3 | 2.4 | 9,731 | ||||||||
| Eastern Mediterranean region | 1.4 | 0.2 | 1.2 | 0.2 | 0.5 | 0.1 | 0.9 | 0.2 | 0.2 | 0.1 | 0.7 | 0.2 | 53.7 | 8.5 | 5,358 | ||||||||
| Western European region | 5.8 | 0.5 | 4.6 | 0.4 | 2.2 | 0.3 | 3.6 | 0.4 | 1.2 | 0.2 | 1.7 | 0.2 | 28.4 | 3.9 | 5,205 | ||||||||
| Eastern European region | 1.0 | 0.4 | 0.9 | 0.4 | 0.1 | 0.1 | 0.8 | 0.4 | 0.1 | 0.0 | 0.3 | 0.1 | 27.3 | 8.6 | 2,357 | ||||||||
| Comparison between countriesb | F17,v = 24.7*, P < 0.001 | F17,v = 23.4*, P < 0.001 | F17,v = 13.6*, P < 0.001 | F17,v = 21.7*, P < 0.001 | F17,v = 4.8*, P < 0.001 | F17,v = 13.6*, P < 0.001 | F17,v = 1.3, P = 0.185 | ||||||||||||||||
| Comparison between low-, middle-, and high-income country groupsb | F2,v = 49.5*, P < 0.001 | F2,v = 58.3*, P < 0.001 | F2,v = 7.1*, P = 0.001 | F2,v = 52.0*, P < 0.001 | F2,v = 0.8, P = 0.446 | F2,v = 21.3*, P < 0.001 | F2,v = 1.3, P = 0.284 | ||||||||||||||||
| Comparison between WHO regionsb | F5,v = 75.8*, P < 0.001 | F5,v = 70.6*, P < 0.001 | F5,v = 42.5*, P < 0.001 | F5,v = 67.3*, P < 0.001 | F5,v = 14.4*, P < 0.001 | F5,v = 38.3*, P < 0.001 | F5,v = 1.7, P = 0.128 | ||||||||||||||||
* Significant at the 0.05 level, two-sided test.
a Region of the Americas (Colombia, Mexico, Brazil, Peru, United States); African region (Nigeria); Western Pacific region (PRC Shen Zhen, New Zealand); Eastern Mediterranean region (Iraq, Lebanon); Western European region (Belgium, France, Germany, Italy, Netherlands, Spain, Portugal); Eastern European region (Romania).
b Wald design-corrected F-tests were used to determine if there is variation in prevalence estimates across countries. The denominator degree of freedom, ν, is 841.
PRC: People's Republic of China
More detailed analyses reported in our prior publication found the most common PE type overall to be visual hallucinations (3.8%) followed by auditory hallucinations (2.5%) (McGrath et al. Reference McGrath, Saha and Al-Hamzawi2015). Prevalence estimates of individual DEs types were low (0.3–0.7%). Among those with any lifetime PEs, 72.0% (representing 4.2% of the total sample) reported only one PE type, 21.1% (representing 1.2% of the total sample) exactly two types, and 6.8% (representing 0.4% of the total sample) three or more types. We also found that PEs are typically infrequent, with 32.2% of the respondents with lifetime PEs reporting only one solitary episode. An additional 31.8% of respondents with lifetime PEs experienced only 2–5 PEs episodes. Thus, for nearly two-thirds of respondents (64.0%) with lifetime PEs, these experiences occurred only 1–5 times in their lives. This lack of persistence of PEs across the lifetime is also indicated in Table 19.2 by the proportion of lifetime cases of PE with 12-month prevalence being relatively low (34.2% in all countries combined). This 12-month/lifetime ratio is an indicator of the course of symptoms (persistence or recurrence) and it is notable that at 34%, this proportion is substantially lower than the corresponding proportions observed for most of the mental disorders featured in this volume (see Chapter 22).
Socio-demographic Correlates
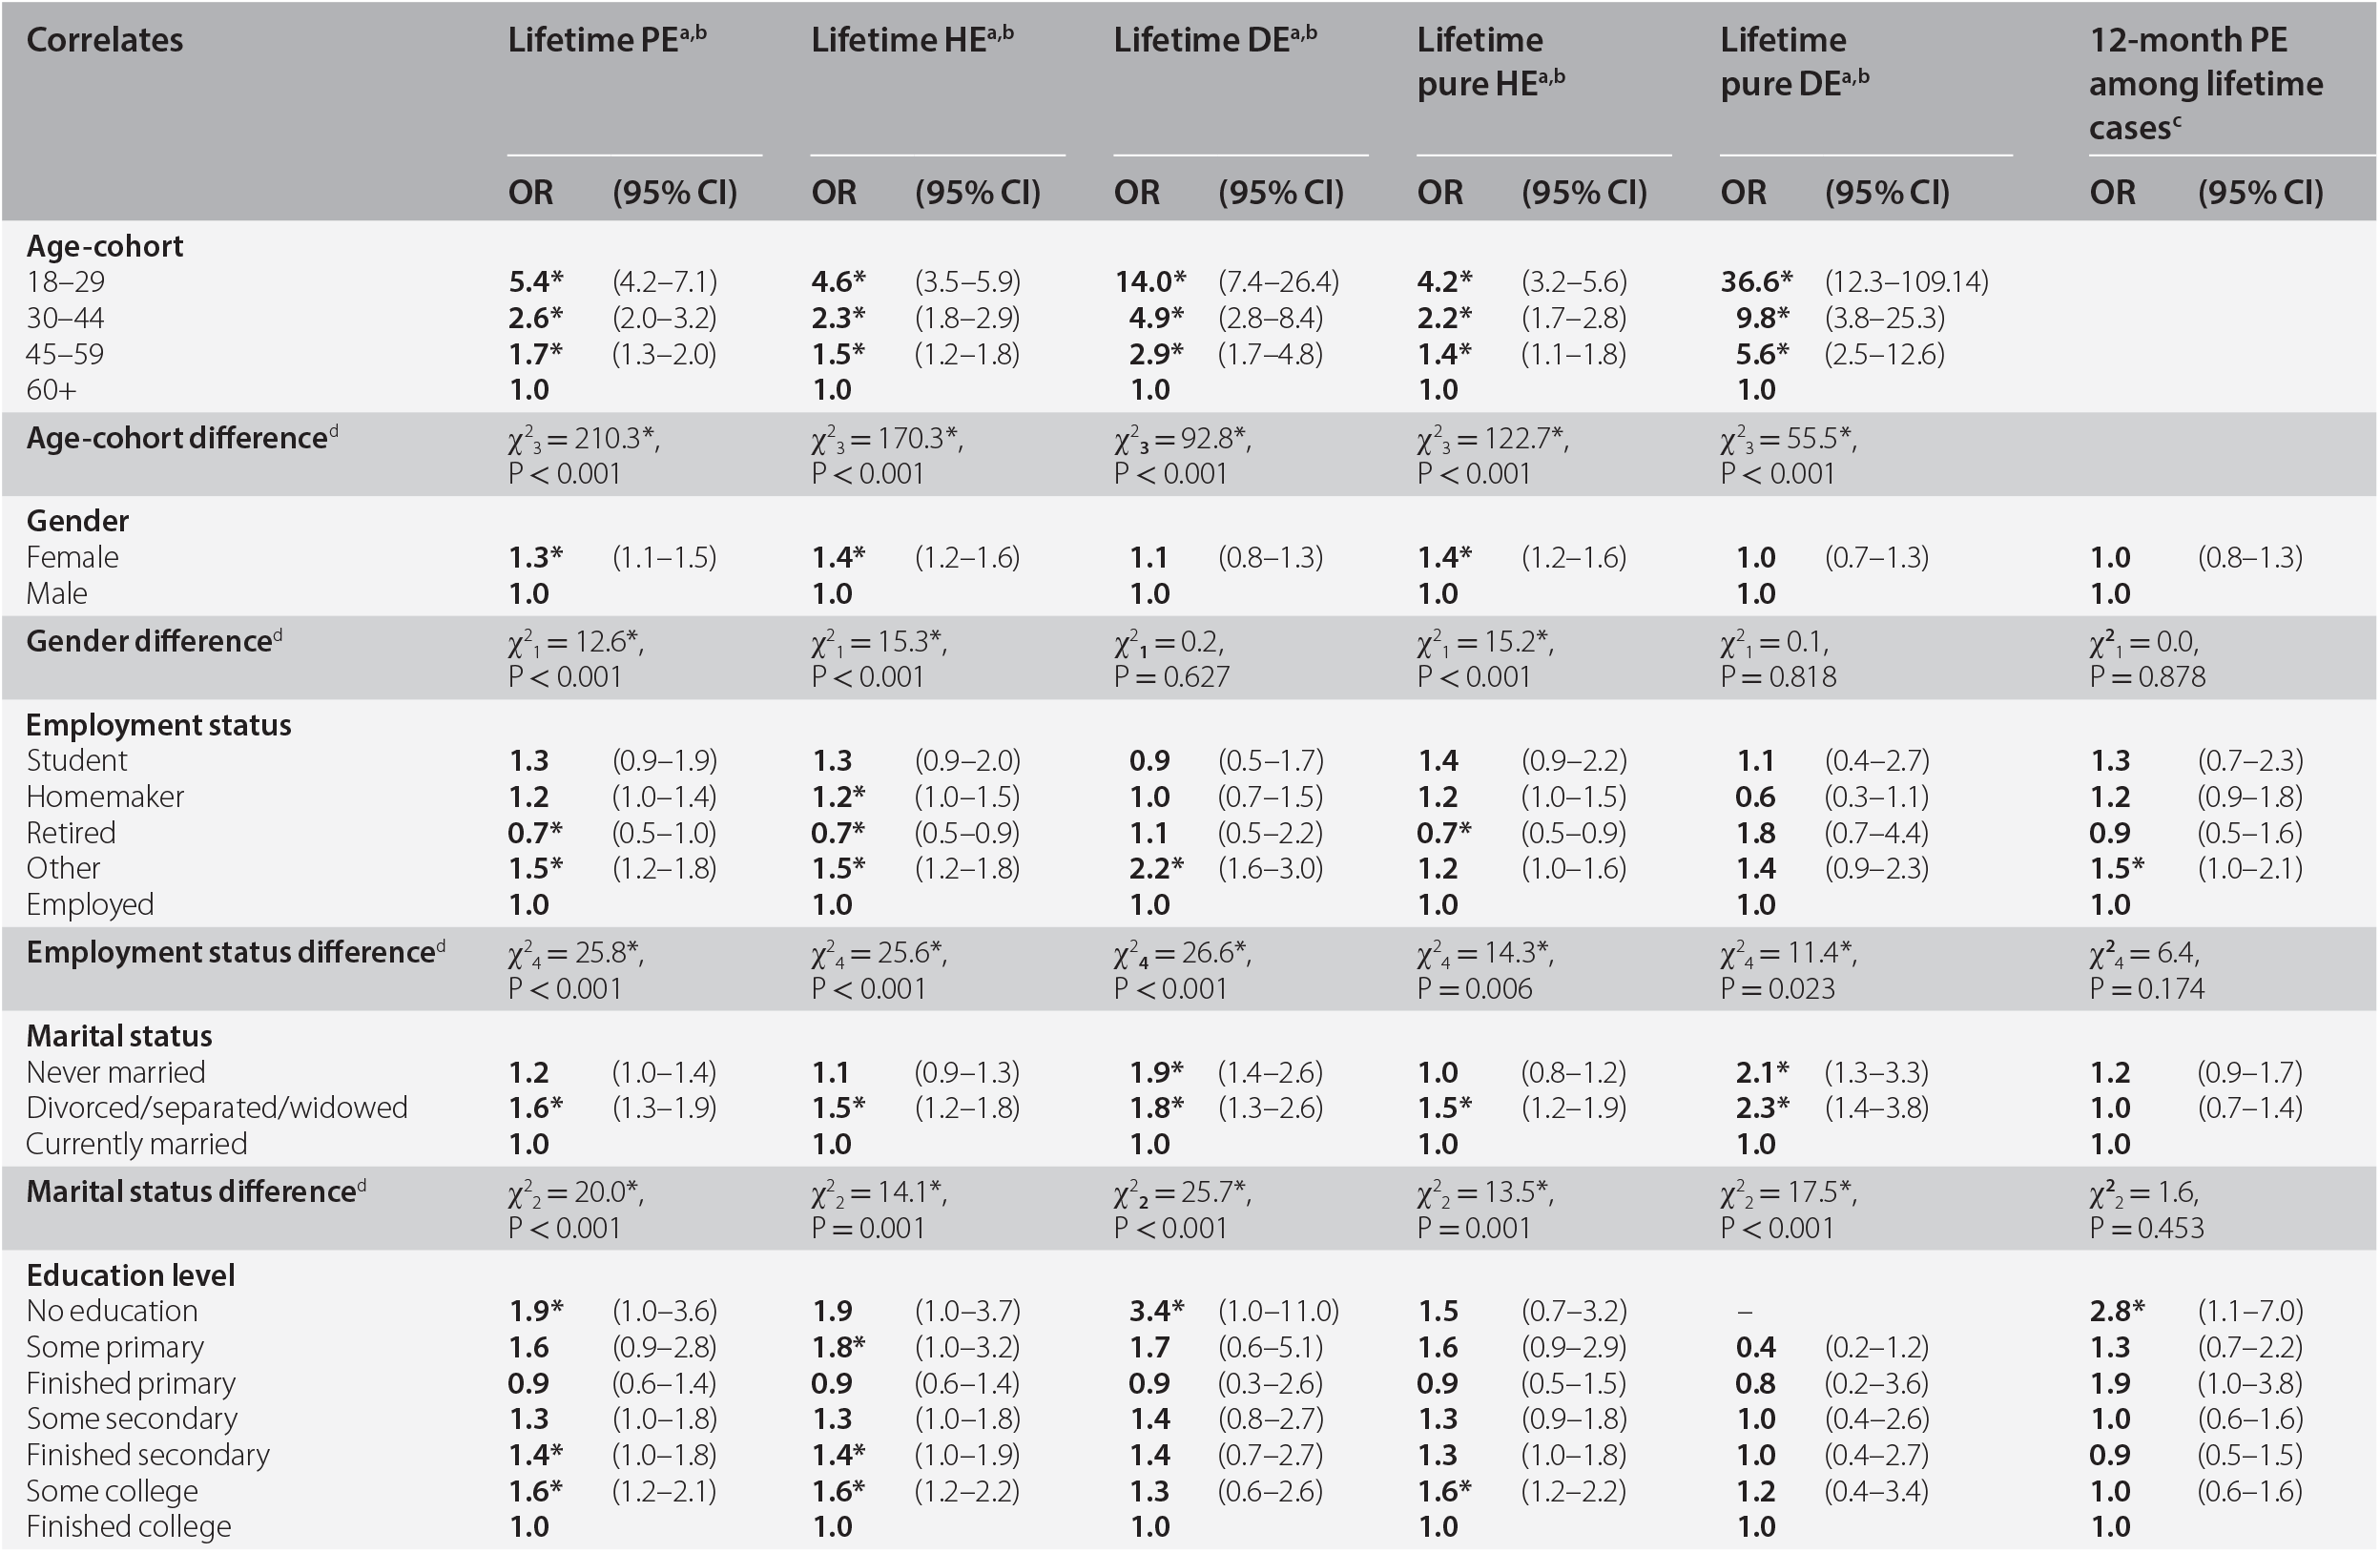
Table 19.3 shows the association of socio-demographic variables with lifetime onset of PEs, HEs, and DEs, and course of any PE, in bivariate models. Several socio-demographic variables are associated with increased lifetime risk of PEs, HEs, and DEs: (a) being younger (compared to those over 60 years); (b) being classified as ‘other’ employment (looking for work, disabled, etc.) (vs. employed); (c) being separated/widowed/divorced (vs. married); and (d) lower household income (vs. high income). In addition to these findings, several socio-demographic variables are associated with only one type of PE. Female gender is associated with HE and through this with any PE, but not with DE (as also noted in the section above on prevalence). Being never married is associated with DE, but not PE or HE. Lower education is associated with any PE and HE, but less consistently with DE. In general, associations between socio-demographic variables and the pure subtypes of HE and DE are similar to those for PEs in general.
Table 19.3 Bivariate associations between socio-demographic correlates and psychotic experiences, all countries combined
| Correlates | Lifetime PEa, b | Lifetime HEa, b | Lifetime DEa, b | Lifetime pure HEa, b | Lifetime pure DEa, b | 12-month PE among lifetime casesc | |||||||||||
|---|---|---|---|---|---|---|---|---|---|---|---|---|---|---|---|---|---|
| OR | (95% CI) | OR | (95% CI) | OR | (95% CI) | OR | (95% CI) | OR | (95% CI) | OR | (95% CI) | ||||||
| Age-cohort | |||||||||||||||||
| 18–29 | 5.4* | (4.2–7.1) | 4.6* | (3.5–5.9) | 14.0* | (7.4–26.4) | 4.2* | (3.2–5.6) | 36.6* | (12.3–109.14) | |||||||
| 30–44 | 2.6* | (2.0–3.2) | 2.3* | (1.8–2.9) | 4.9* | (2.8–8.4) | 2.2* | (1.7–2.8) | 9.8* | (3.8–25.3) | |||||||
| 45–59 | 1.7* | (1.3–2.0) | 1.5* | (1.2–1.8) | 2.9* | (1.7–4.8) | 1.4* | (1.1–1.8) | 5.6* | (2.5–12.6) | |||||||
| 60+ | 1.0 | 1.0 | 1.0 | 1.0 | 1.0 | ||||||||||||
| Age-cohort differenced | χ23 = 210.3*, P < 0.001 | χ23 = 170.3*, P < 0.001 | χ23 = 92.8*, P < 0.001 | χ23 = 122.7*, P < 0.001 | χ23 = 55.5*, P < 0.001 | ||||||||||||
| Gender | |||||||||||||||||
| Female | 1.3* | (1.1–1.5) | 1.4* | (1.2–1.6) | 1.1 | (0.8–1.3) | 1.4* | (1.2–1.6) | 1.0 | (0.7–1.3) | 1.0 | (0.8–1.3) | |||||
| Male | 1.0 | 1.0 | 1.0 | 1.0 | 1.0 | 1.0 | |||||||||||
| Gender differenced | χ21 = 12.6*, P < 0.001 | χ21 = 15.3*, P < 0.001 | χ21 = 0.2, P = 0.627 | χ21 = 15.2*, P < 0.001 | χ21 = 0.1, P = 0.818 | χ21 = 0.0, P = 0.878 | |||||||||||
| Employment status | |||||||||||||||||
| Student | 1.3 | (0.9–1.9) | 1.3 | (0.9–2.0) | 0.9 | (0.5–1.7) | 1.4 | (0.9–2.2) | 1.1 | (0.4–2.7) | 1.3 | (0.7–2.3) | |||||
| Homemaker | 1.2 | (1.0–1.4) | 1.2* | (1.0–1.5) | 1.0 | (0.7–1.5) | 1.2 | (1.0–1.5) | 0.6 | (0.3–1.1) | 1.2 | (0.9–1.8) | |||||
| Retired | 0.7* | (0.5–1.0) | 0.7* | (0.5–0.9) | 1.1 | (0.5–2.2) | 0.7* | (0.5–0.9) | 1.8 | (0.7–4.4) | 0.9 | (0.5–1.6) | |||||
| Other | 1.5* | (1.2–1.8) | 1.5* | (1.2–1.8) | 2.2* | (1.6–3.0) | 1.2 | (1.0–1.6) | 1.4 | (0.9–2.3) | 1.5* | (1.0–2.1) | |||||
| Employed | 1.0 | 1.0 | 1.0 | 1.0 | 1.0 | 1.0 | |||||||||||
| Employment status differenced | χ24 = 25.8*, P < 0.001 | χ24 = 25.6*, P < 0.001 | χ24 = 26.6*, P < 0.001 | χ24 = 14.3*, P = 0.006 | χ24 = 11.4*, P = 0.023 | χ24 = 6.4, P = 0.174 | |||||||||||
| Marital status | |||||||||||||||||
| Never married | 1.2 | (1.0–1.4) | 1.1 | (0.9–1.3) | 1.9* | (1.4–2.6) | 1.0 | (0.8–1.2) | 2.1* | (1.3–3.3) | 1.2 | (0.9–1.7) | |||||
| Divorced/separated/widowed | 1.6* | (1.3–1.9) | 1.5* | (1.2–1.8) | 1.8* | (1.3–2.6) | 1.5* | (1.2–1.9) | 2.3* | (1.4–3.8) | 1.0 | (0.7–1.4) | |||||
| Currently married | 1.0 | 1.0 | 1.0 | 1.0 | 1.0 | 1.0 | |||||||||||
| Marital status differenced | χ22 = 20.0*, P < 0.001 | χ22 = 14.1*, P = 0.001 | χ22 = 25.7*, P < 0.001 | χ22 = 13.5*, P = 0.001 | χ22 = 17.5*, P < 0.001 | χ22 = 1.6, P = 0.453 | |||||||||||
| Education level | |||||||||||||||||
| No education | 1.9* | (1.0–3.6) | 1.9 | (1.0–3.7) | 3.4* | (1.0–11.0) | 1.5 | (0.7–3.2) | – | 2.8* | (1.1–7.0) | ||||||
| Some primary | 1.6 | (0.9–2.8) | 1.8* | (1.0–3.2) | 1.7 | (0.6–5.1) | 1.6 | (0.9–2.9) | 0.4 | (0.2–1.2) | 1.3 | (0.7–2.2) | |||||
| Finished primary | 0.9 | (0.6–1.4) | 0.9 | (0.6–1.4) | 0.9 | (0.3–2.6) | 0.9 | (0.5–1.5) | 0.8 | (0.2–3.6) | 1.9 | (1.0–3.8) | |||||
| Some secondary | 1.3 | (1.0–1.8) | 1.3 | (1.0–1.8) | 1.4 | (0.8–2.7) | 1.3 | (0.9–1.8) | 1.0 | (0.4–2.6) | 1.0 | (0.6–1.6) | |||||
| Finished secondary | 1.4* | (1.0–1.8) | 1.4* | (1.0–1.9) | 1.4 | (0.7–2.7) | 1.3 | (1.0–1.8) | 1.0 | (0.4–2.7) | 0.9 | (0.5–1.5) | |||||
| Some college | 1.6* | (1.2–2.1) | 1.6* | (1.2–2.2) | 1.3 | (0.6–2.6) | 1.6* | (1.2–2.2) | 1.2 | (0.4–3.4) | 1.0 | (0.6–1.6) | |||||
| Finished college | 1.0 | 1.0 | 1.0 | 1.0 | 1.0 | 1.0 | |||||||||||
| Education level differenced | χ26 = 17.7*, P = 0.007 | χ26 = 19.0*, P = 0.004 | χ26 = 5.7, P = 0.457 | χ26 = 14.6*, P = 0.024 | χ26 = 7.9, P = 0.247 | χ26 = 10.7, P = 0.097 | |||||||||||
| Household income | |||||||||||||||||
| Low | 1.6* | (1.4–1.9) | 1.7* | (1.4–2.0) | 1.7* | (1.3–2.3) | 1.6* | (1.3–1.9) | 1.3 | (0.8–2.0) | 1.4 | (1.0–2.0) | |||||
| Low-average | 1.2 | (1.0–1.4) | 1.2 | (1.0–1.5) | 1.0 | (0.7–1.3) | 1.2 | (1.0–1.5) | 0.8 | (0.5–1.2) | 1.3 | (0.9–2.0) | |||||
| High-average | 1.1 | (0.9–1.3) | 1.1 | (0.9–1.3) | 1.0 | (0.7–1.4) | 1.1 | (0.9–1.4) | 0.9 | (0.6–1.4) | 1.1 | (0.7–1.6) | |||||
| High | 1.0 | 1.0 | 1.0 | 1.0 | 1.0 | 1.0 | |||||||||||
| Household income differenced | χ23 = 38.6*, P < 0.001 | χ23 = 32.4*, P < 0.001 | χ23 = 22.0*, P < 0.001 | χ23 = 20.1*, P < 0.001 | χ23 = 5.6, P = 0.133 | χ23 = 4.6, P = 0.203 | |||||||||||
| Age-of-onset | |||||||||||||||||
| Early | 1.5* | (1.0–2.3) | |||||||||||||||
| Early-average | 1.0 | (0.7–1.4) | |||||||||||||||
| Late-average | 1.1 | (0.7–1.6) | |||||||||||||||
| Late | 1.0 | ||||||||||||||||
| Age-of-onset differenced | χ23 = 6.4, P = 0.096 | ||||||||||||||||
| Time since onset (continuous) | 0.98* | (0.97–0.99) | |||||||||||||||
| Ne | 1,278,613 | 12,282,275 | 1,308,724 | 1,288,506 | 1,314,955 | 2,385 | |||||||||||
* Significant at the 0.05 level, two-sided test.
a PE, Psychotic Experiences; HE, Hallucinatory Experiences; DE, Delusional Experiences.
b These estimates are based on survival models adjusted for age-cohorts, gender, person-years, and country.
c These estimates are based on logistic regression models adjusted for time since PE onset, age of PE onset, gender, and country.
d Chi-square test of significant differences between blocks of socio-demographic variables.
e Denominator N: 2,385 = number of lifetime PE cases. The denominator in other models are referring to the number of person-years in the survival models.
In contrast to these associations between a wide range of socio-demographic variables and lifetime onset of PEs, it is notable that few socio-demographic factors are associated with course/persistence of PEs (12 months/lifetime). Employment status and educational outcomes warrant closer attention in future studies.
Age-of-Onset
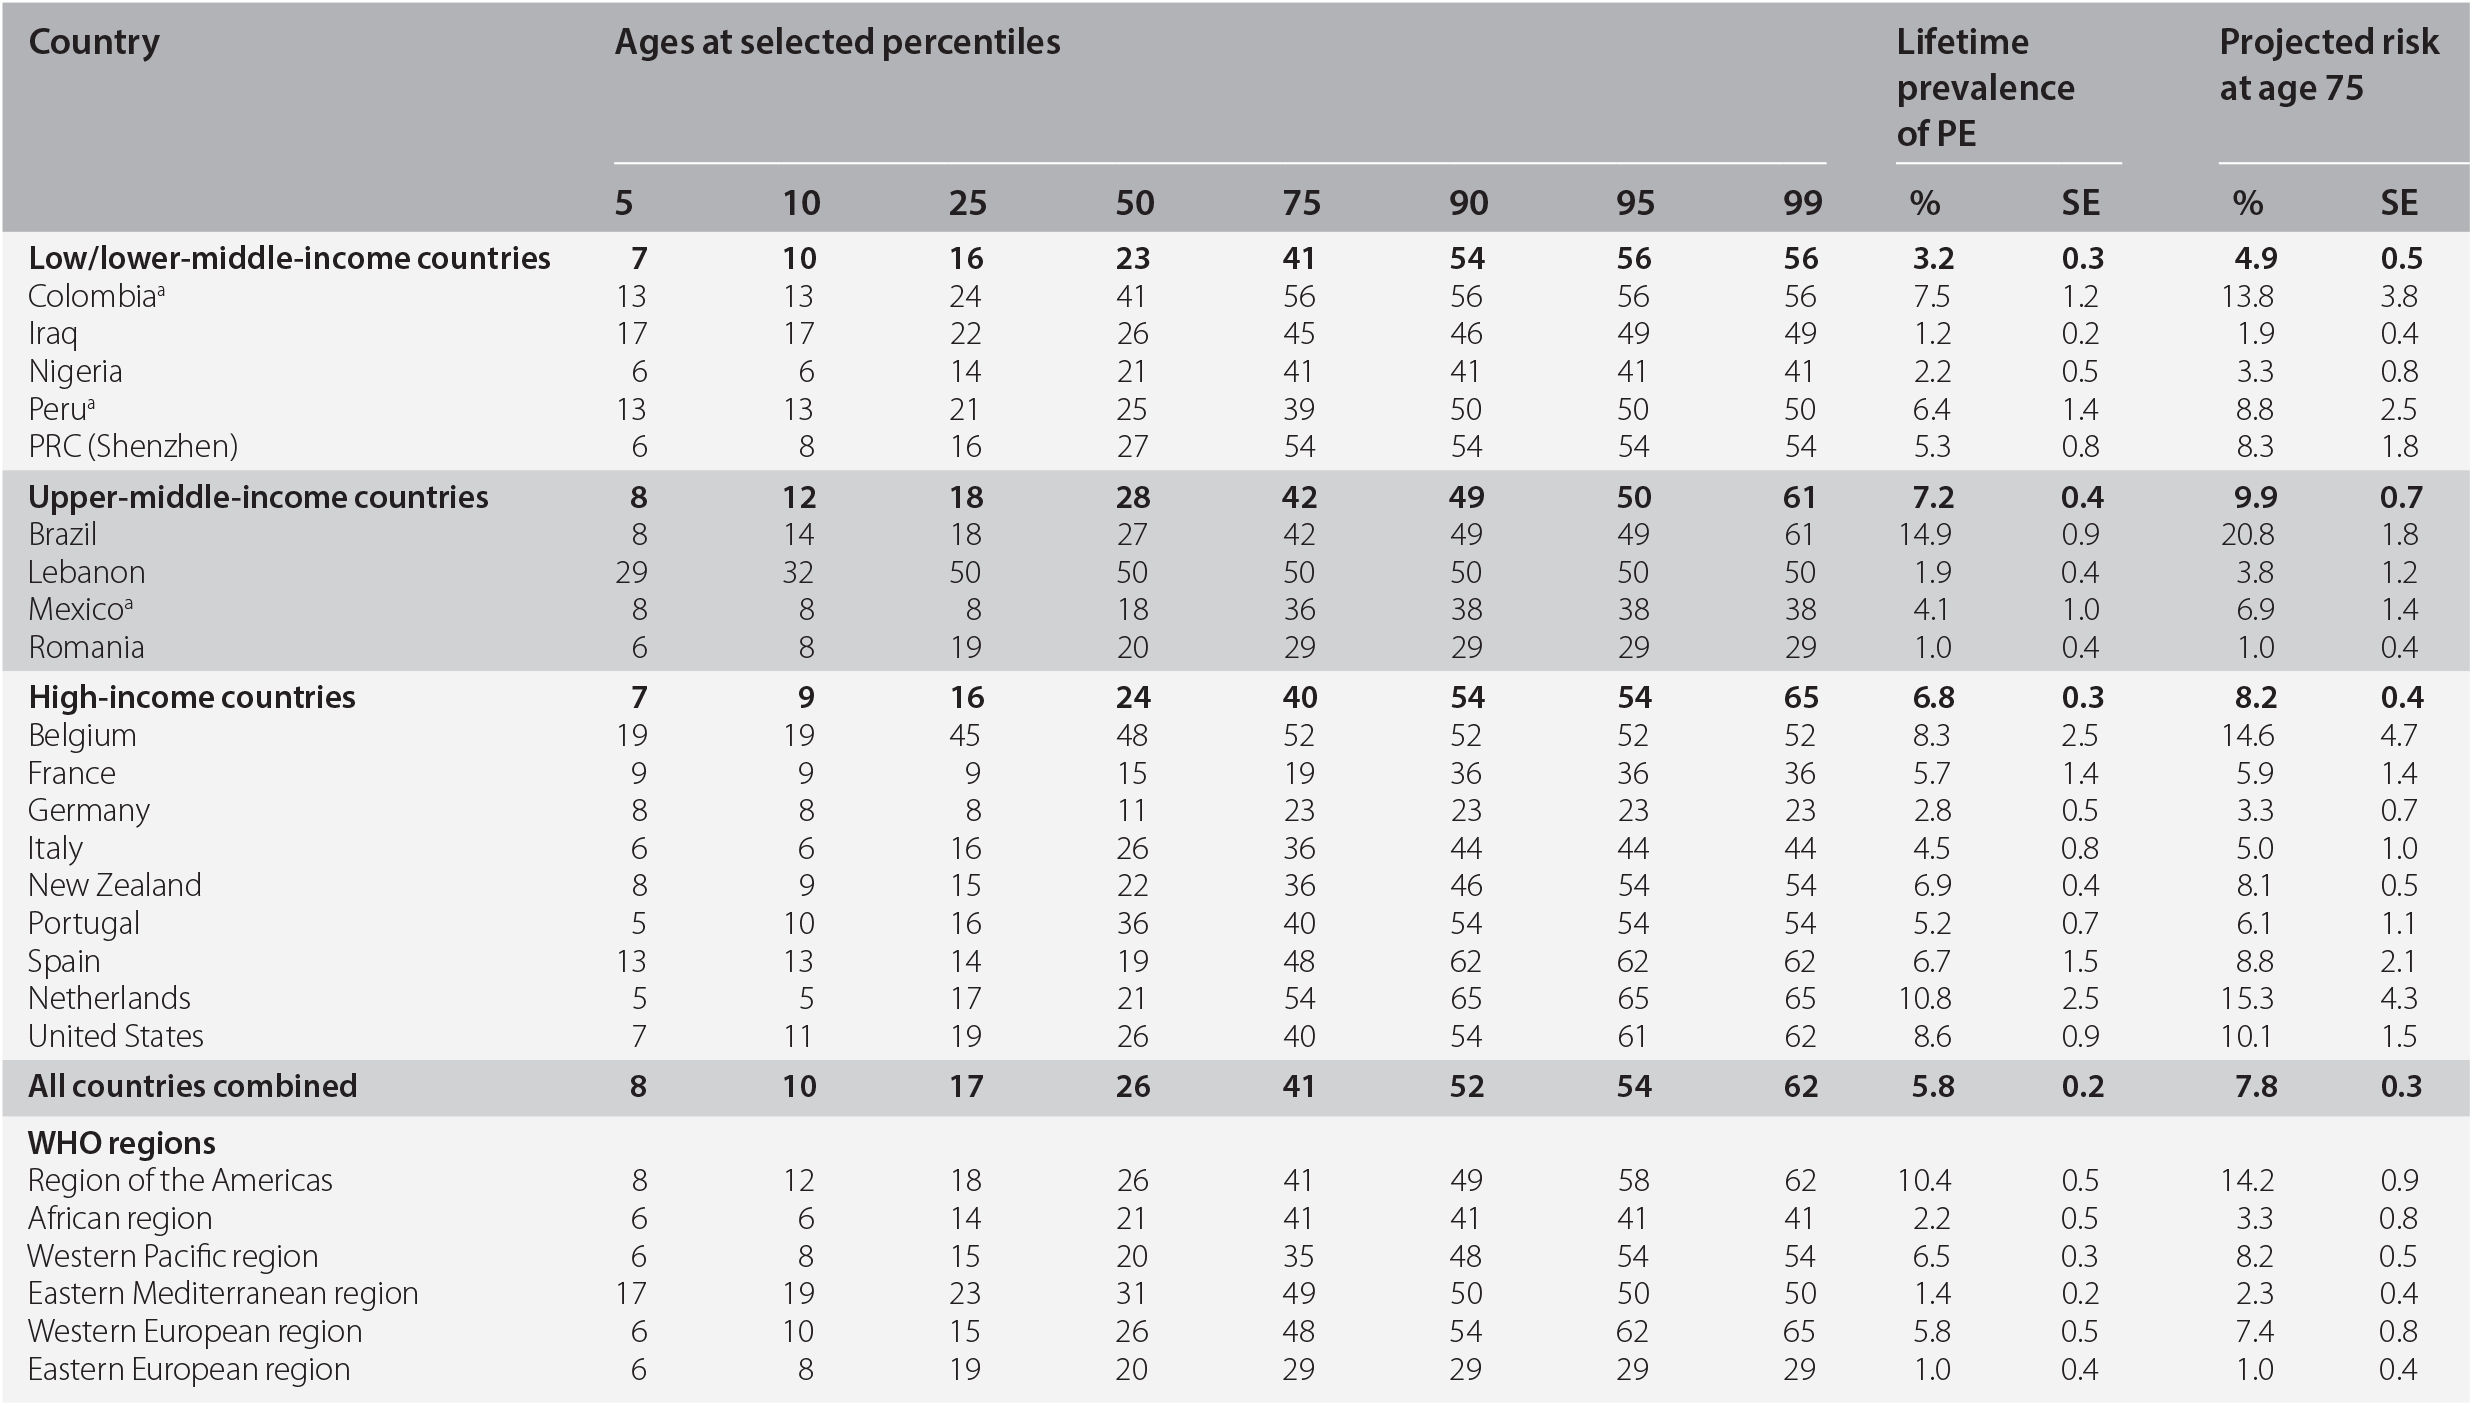
Most people experience PEs early in their lives; 5% of all cases will have experienced a PE by age eight years, 25% by age 17, 50% by age 26, 75% by age 41, and 99% by age 62 (Table 19.4). The age-of-onset (AOO) distributions for PEs, DEs, and HEs do not differ by gender. The projected AOO distribution is marginally earlier for low/low-middle- (median AOO = 23, IQR = 15–41) and high-income countries (median AOO = 24, IQR = 16–40) when compared to upper-middle-income countries (median AOO = 28, IQR = 18–42) (χ22 = 18.3, P < 0.001).
Table 19.4 Standardized age-of-onset distributions of psychotic experiences (PE) with projected lifetime risk at age 75
| Country | Ages at selected percentiles | Lifetime prevalence of PE | Projected risk at age 75 | |||||||||||
|---|---|---|---|---|---|---|---|---|---|---|---|---|---|---|
| 5 | 10 | 25 | 50 | 75 | 90 | 95 | 99 | % | SE | % | SE | |||
| Low/lower-middle-income countries | 7 | 10 | 16 | 23 | 41 | 54 | 56 | 56 | 3.2 | 0.3 | 4.9 | 0.5 | ||
| Colombiaa | 13 | 13 | 24 | 41 | 56 | 56 | 56 | 56 | 7.5 | 1.2 | 13.8 | 3.8 | ||
| Iraq | 17 | 17 | 22 | 26 | 45 | 46 | 49 | 49 | 1.2 | 0.2 | 1.9 | 0.4 | ||
| Nigeria | 6 | 6 | 14 | 21 | 41 | 41 | 41 | 41 | 2.2 | 0.5 | 3.3 | 0.8 | ||
| Perua | 13 | 13 | 21 | 25 | 39 | 50 | 50 | 50 | 6.4 | 1.4 | 8.8 | 2.5 | ||
| PRC (Shenzhen) | 6 | 8 | 16 | 27 | 54 | 54 | 54 | 54 | 5.3 | 0.8 | 8.3 | 1.8 | ||
| Upper-middle-income countries | 8 | 12 | 18 | 28 | 42 | 49 | 50 | 61 | 7.2 | 0.4 | 9.9 | 0.7 | ||
| Brazil | 8 | 14 | 18 | 27 | 42 | 49 | 49 | 61 | 14.9 | 0.9 | 20.8 | 1.8 | ||
| Lebanon | 29 | 32 | 50 | 50 | 50 | 50 | 50 | 50 | 1.9 | 0.4 | 3.8 | 1.2 | ||
| Mexicoa | 8 | 8 | 8 | 18 | 36 | 38 | 38 | 38 | 4.1 | 1.0 | 6.9 | 1.4 | ||
| Romania | 6 | 8 | 19 | 20 | 29 | 29 | 29 | 29 | 1.0 | 0.4 | 1.0 | 0.4 | ||
| High-income countries | 7 | 9 | 16 | 24 | 40 | 54 | 54 | 65 | 6.8 | 0.3 | 8.2 | 0.4 | ||
| Belgium | 19 | 19 | 45 | 48 | 52 | 52 | 52 | 52 | 8.3 | 2.5 | 14.6 | 4.7 | ||
| France | 9 | 9 | 9 | 15 | 19 | 36 | 36 | 36 | 5.7 | 1.4 | 5.9 | 1.4 | ||
| Germany | 8 | 8 | 8 | 11 | 23 | 23 | 23 | 23 | 2.8 | 0.5 | 3.3 | 0.7 | ||
| Italy | 6 | 6 | 16 | 26 | 36 | 44 | 44 | 44 | 4.5 | 0.8 | 5.0 | 1.0 | ||
| New Zealand | 8 | 9 | 15 | 22 | 36 | 46 | 54 | 54 | 6.9 | 0.4 | 8.1 | 0.5 | ||
| Portugal | 5 | 10 | 16 | 36 | 40 | 54 | 54 | 54 | 5.2 | 0.7 | 6.1 | 1.1 | ||
| Spain | 13 | 13 | 14 | 19 | 48 | 62 | 62 | 62 | 6.7 | 1.5 | 8.8 | 2.1 | ||
| Netherlands | 5 | 5 | 17 | 21 | 54 | 65 | 65 | 65 | 10.8 | 2.5 | 15.3 | 4.3 | ||
| United States | 7 | 11 | 19 | 26 | 40 | 54 | 61 | 62 | 8.6 | 0.9 | 10.1 | 1.5 | ||
| All countries combined | 8 | 10 | 17 | 26 | 41 | 52 | 54 | 62 | 5.8 | 0.2 | 7.8 | 0.3 | ||
| WHO regions | ||||||||||||||
| Region of the Americas | 8 | 12 | 18 | 26 | 41 | 49 | 58 | 62 | 10.4 | 0.5 | 14.2 | 0.9 | ||
| African region | 6 | 6 | 14 | 21 | 41 | 41 | 41 | 41 | 2.2 | 0.5 | 3.3 | 0.8 | ||
| Western Pacific region | 6 | 8 | 15 | 20 | 35 | 48 | 54 | 54 | 6.5 | 0.3 | 8.2 | 0.5 | ||
| Eastern Mediterranean region | 17 | 19 | 23 | 31 | 49 | 50 | 50 | 50 | 1.4 | 0.2 | 2.3 | 0.4 | ||
| Western European region | 6 | 10 | 15 | 26 | 48 | 54 | 62 | 65 | 5.8 | 0.5 | 7.4 | 0.8 | ||
| Eastern European region | 6 | 8 | 19 | 20 | 29 | 29 | 29 | 29 | 1.0 | 0.4 | 1.0 | 0.4 | ||
a The projected risk for these countries is at age 65 because the age range of these surveys is between 18 and 65.
PRC: People's Republic of China.
The projected lifetime risk for all countries combined at age 75 is 7.8%. This is higher than the lifetime prevalence estimate (5.8%). The gap between lifetime prevalence estimates and the projected lifetime risk is 2.0%. This suggests that a small proportion of respondents who had not experienced PEs prior to survey interview can be expected to experience PEs before 75 years. Across the three country income groups, the projected lifetime risk is 53%, 38%, and 21% higher among high-, upper-middle-, and low/lower-middle-income countries respectively, compared to lifetime prevalence estimates. When classified by WHO regions, the highest projected lifetime risk for PEs is found in the Americas (14.2%) followed by Western Pacific regions (8.2%), and Western European regions (7.4%).
Figure 19.1 shows the cumulative AOO distributions of PEs and related subtypes based on projected data for the various PEs subgroups, including those with PEs, pure HEs, and pure DEs. A key feature that emerges from these distributions relates to the delayed AOO for those with pure DEs. Those with pure DEs have a later AOO distribution. The AOO for pure HEs is significantly earlier than that for pure DEs (X21 = 590.5, P < 0.001).

Figure 19.1 Cumulative age-of-onset distribution of psychotic experiences, all countries combined.
The Bi-directional Associations between PEs and Mental Disorders
When we examined the prevalence of mental disorders among respondents with and without PEs (without considering temporal sequence), compared to those with no PEs those with PEs had significantly higher odds of having 20 of the 21 mental disorders examined (McGrath et al. Reference McGrath, Saha and Al-Hamzawi2016b). In this chapter we present summary results of these associations from multivariate models in Figure 19.2. We first examined temporally prior PEs and found in these models that those with PEs are significantly more likely to subsequently experience 8 of 21 disorders (major depressive disorder, bipolar disorder, generalized anxiety disorder, social phobia, posttraumatic stress disorder, adult separation anxiety disorder, bulimia nervosa, alcohol abuse). When we examined the associations between preceding mental disorders and the subsequent onset of PEs in multivariate models, we found that 18 of the 21 mental disorders are significantly associated with the later onset of PEs.

Figure 19.2 Summary of bi-directional associations between psychotic experiences (PEs) and mental disorders (odds ratios for insignificant associations are shown in the lightest grey bars).
Discussion
Based on these 18 WMH samples, we found that 5.8% of respondents reported having one or more psychotic experiences at least once in their lifetime and 2.0% in the previous year. These overall estimates are broadly consistent with the previous literature (Linscott & van Os Reference Linscott and van Os2013). Our data have contributed important new information regarding the count of psychotic experiences types and frequency of psychotic experiences that go beyond the issues considered in previous community-based studies of psychotic experiences. Perhaps the most striking finding is that psychotic experiences were not persistent for most of the individuals who experience them, with 32.2% reporting only one psychotic experience episode in their life; 64.0% reporting no more than five lifetime occurrences and only around a third of lifetime cases reporting PEs in the past year. This suggests that in the general population, only a small subgroup of individuals has multiple types of psychotic experiences and experiences these types of psychotic experiences more frequently. The CIDI only explores a subset of PEs (e.g. there are many types of DEs), and this needs to be taken into account when comparing prevalence estimates between studies that use difference scales to assess PEs.
The WMH data found that hallucinatory experiences are more common than delusional experiences (5.2% vs. 1.3%) and this general pattern was consistent across the three country income groups. Lifetime prevalence of psychotic experiences was lower in the low/lower-middle-income countries compared with the upper-middle- and high-income countries, reflecting a similar pattern observed in the prevalence of schizophrenia (Saha et al. Reference Saha, Chant and Welham2005).
Based on projected AOO values, the median AOO for PEs was 26 years. Strikingly, approximately a quarter of individuals who will experience PEs during their life will have their first experience after age 40 years (McGrath et al. Reference McGrath, Saha and Al-Hamzawi2016a). In contrast to the AOO of schizophrenia (Thorup et al. Reference Thorup, Waltoft and Pedersen2007), we found no gender difference in the AOO of PEs (nor in HEs and DEs). The projected AOO for pure DEs was significantly right-shifted (encompassing older AOOs) compared to that for pure HEs while the AOO of PEs that contain any HEs show closely overlapping distributions. It will be of interest to explore if the risk factors associated with PEs in general differ according to AOO. For example, are respondents who have the onset of PEs later in life more likely to have a preceding mental disorder? The WMH surveys have provided us with many new research questions to guide future research.
The time-lagged associations between PEs and mental disorders provide new insights into the bi-directional relationship between psychotic experiences and mental disorders. The analysis demonstrates that individuals with PEs are at increased risk of experiencing a wide range of mental disorders at some stage in their life compared with other people in the population. On the other hand, we found a very consistent increased odds of psychotic experience onset after nearly all of the mental disorders we examined. That is, most mental disorders were associated with an increased likelihood of subsequent psychotic experiences, even in multivariate models. Of the 21 disorders examined in this study, only three externalizing disorders did not significantly predict subsequent psychotic experiences in the multivariate model (conduct disorder, drug abuse, and drug dependence). These findings call into the question the specificity of the association between psychotic experiences and psychotic disorders (Kelleher & Cannon Reference Nishida, Sasaki and Nishimura2010).
Our research has provided new insights into the fine-grained epidemiology of PEs, and also provided new insights into the bi-directional relationship between psychotic experiences and mental disorders. Epidemiologists have increasingly recognised the importance of considering psychotic experiences in the causal pathways of psychotic disorders. These new findings provide a heuristic framework for the generation of new hypotheses related to psychotic experiences.