

3.1 Introduction
The transition to a zero-carbon economy is a crucial step towards addressing the global threat of climate change. However, the distributional consequences of this transition must also be considered. Inequality, or the unequal distribution of economic outcomes such as income and wealth, takes many forms, including disparities within a single country or between countries. Reducing inequality, or at least not exacerbating it, is important for the overall welfare of a population. At a minimum, the climate transition should avoid the deterioration of individuals’ access to basic goods and services such as housing, heating, health, and education. Discontent with the distributional consequences of policy can rapidly erode national and international political support for the green transition. The protests in France by the ‘Yellow Vests’ (Gilets jaunes) is just one example of discontent against a planned climate policy. Hence, the potential impact of the green transition on inequality should be carefully considered when designing climate policy. In this chapter, we will examine key channels determining the distributional consequences of the transition to a zero-carbon economy, including the impact of different policies both nationally and globally.
The chapter first covers the concept of inequality and common measures and explains the relevance of distributional impacts for climate policy from a welfare, political and economic perspective. It then covers distributional effects of national climate policies by assessing how various policies may affect the expenditures and incomes of households. The final part of the chapter covers factors that may lead to distributional impacts between different countries.
3.2 What Is Inequality and Why Does It Matter for the Green Transition?
Inequality comes in many shapes and forms. While inequality of opportunity exists when circumstances early in the life of an individual determine differences in life outcomes, inequality of outcome is commonly concerned with the distribution of economic outcomes like returns from labour and capital, or wealth. Inequality can refer to disparities within a single country or between several countries. Between-country inequality is commonly measured by the difference between countries’ gross domestic product (GDP) and has been decreasing because of globalisation and relatively higher rates of economic growth in the developing world. Fast-growing economies in East Asia especially have continued to close the gap with Western economies, whose economic growth has slowed considerably (Alvaredo et al., Reference Alvaredo, Chancel, Piketty, Saez and Yucman2017). Development in China and India in particular have reduced inequality in the global distribution of incomes (Darvas, Reference Darvas2019).
Within-country inequality is commonly measured in terms of relative measures like the share of aggregate income held by the top quantile of society or the Gini coefficient.Footnote 1 Disparities in wealth within countries tend to be more enduring and pronounced than income inequality. Overall, within-country inequality has increased considerably over the past decades (Balestra& Tonkin, Reference Balestra and Tonkin2018). While these measures do a good job at capturing varying outcomes of different income groups, one should note that they may not succeed in capturing the distributional effects of climate policies on households with similar income.Footnote 2 So-called horizontal inequalities can be attributed to factors like the climate surrounding the household and the commuting distance of its members (Rausch et al., Reference Rausch, Metcalf and Reilly2011), the household’s energy efficiency (Hänsel et al., Reference Hänsel, Franks, Kalkuhl and Edenhofer2022) or race of its members (Dogan et al., Reference Dogan, Madaleno, Inglesi-Lotz and Taskin2022). These types of inequality are not well captured by Gini coefficients measuring income inequality.
3.2.1 Inequality and Welfare
The level of wealth and/or income inequality has direct implications for the overall welfare of a population. Income and wealth are essential for individual welfare as they enable access to goods and services, including housing, health and education. The welfare of a society is typically defined using a welfare function that aggregates the welfare of its individuals. A common assumption is that welfare functions display ‘decreasing marginal returns’, meaning that improvements in welfare from additional income gets smaller at higher levels of income. The reasoning behind this assumption is intuitive: a poor individual receiving an increase in income that allows for the satisfaction of basic needs like purchasing food or housing will experience a large welfare gain; a wealthy individual receiving an increase of the same absolute amount will not experience a substantive gain in welfare, since their basic needs are already satisfied. When income and wealth become more concentrated among a small number of individuals at the expense of large parts of the population, the aggregate welfare of a country may decrease due to the lower welfare experienced by the majority of its individuals.
Figure 3.1 shows an example of the income distribution of Australia, Denmark and the Unites States, plotted in the form of a Lorenz curve; this plots the cumulative percentage of the population against the cumulative percentage of income earned by that population. The closer the Lorenz curve is to the main diagonal, the more even is the distribution. In 2021, the three countries had similar per capita income levels.Footnote 3 The distribution of income, however, was most equal in Denmark and most unequal in the United States.

The organisation of labour markets, limiting of market power and reducing concentration of wealth all have major implications for the distribution of primary incomes, that is, incomes before the distributional policies of the state. Policies such as taxation and the payment of income transfers can increase the aggregate level of welfare by redistributing income from wealthier individuals to poorer ones. In the same way, a policy that benefits predominantly wealthier households or harms poorer individuals can decrease overall welfare. If, for example, an industrial sector that employs predominantly low-income earners is replaced by a renewable industry that employs high-income earners, this holds implications for overall welfare.
3.2.2 Political Support for Climate Policy
The distributional impact of climate policies significantly affects the political support of said policies. As Dechezlepretre et al. (Reference Dechezlepretre, Fabre, Kruse, Planterose, Chico and Stantcheva2022) show based on analysing surveys,Footnote 4 public support for climate policies is largely dependent on perceptions of the policies’ effectiveness in reducing emissions, their distributional impact on lower-income households and their impact on the respondents’ own household. A growing body of literature exploring the drivers of support for climate policies confirms these findings. If policies are regressive, or perceived as such by the public, support erodes (e.g. Brannlund & Persson, Reference Brannlund and Persson2012; Dietz & Atkinson, Reference Dietz and Atkinson2010; Sommer et al., Reference Sommer, Mattauch and Pahle2022). Vona (Reference Vona2018) also finds that public perception of, and support for, climate policies is significantly reduced in the presence of negative shocks like job losses. Such losses can either be due to policies themselves or be the consequence of external shocks. This can be particularly problematic in areas and sectors that have been hit hard by economic recession and international competition, as the associated job losses can lead to a feeling of disenfranchisement and disempowerment. Because of the concentration of job losses in specific sectors and regions, negative perceptions and the resulting lack of support for climate policies may persist even if aggregate labour market effects of the policies are positive.
An example for the failure of climate policy based on the unequal effect on different groups and the perception of such disproportionality is the Gilets jaunes (or the ‘yellow vest’) movement. The movement began in France in October 2018 against a planned increase in fuel taxes. In the context of rising oil prices and a general perception of societal injustice, the disproportionate effect the tax would have on rural households, who are more reliant on cars for transportation, sparked nationwide protests, resulting in the eventual cancelation of the fuel tax (Gagnebin et al., Reference Gagnebin, Graichen and Lenck2019; Jetten et al., Reference Jetten, Mols and Selvanathan2020). Reflecting on the events in France, Gagnebin et al. (Reference Gagnebin, Graichen and Lenck2019) find that the regressive nature of similar policies necessitates the compensation of lower-income groups to ensure political stability.
3.2.3 Burden Sharing and Global Political Consensus
The shift towards a low-carbon economy is likely to affect countries differently. Changes in patterns of resource demand, for example, create both risks and opportunities for different countries. Oil-exporting economies may see the value of their resource endowment decline as the demand for fossil fuels declines, while mineral-exporting countries may benefit from increased demand for raw materials used in renewable energy technologies.Footnote 5 At the same time, the extraction of these raw materials could pose conflict risks that need to be carefully managed (Hafner & Tagliapietra, Reference Hafner, Tagliapietra, Hafner and Tagliapietra2020).
Hafner and Wochner (Reference Hafner, Wochner, Hafner and Tagliapietra2020) argue that effective governance of a green transition hinges on increased ownership of climate policies among countries through a more inclusive and equitable distribution of burdens. Countries are more likely to support a policy if they believe that it will benefit them economically or if the policies help to mitigate problems related to climate change in the region. A country that is disproportionately negatively affected by a given policy may choose to obstruct a global green transition. The international consensus required to find effective policy paths towards the green transition is thus partly contingent on the effect of climate policy on between-country inequality.
Sharing the burden of climate transition has been a prominent issue in all documents and meetings of the United Nations Framework Convention on Climate Change (UNFCCC). In this context, ‘common but differentiated responsibilities’ has become a core principle of international environmental law. Also during the implementation of the European Green Deal, the plan to decarbonise the EU economy by 2050, the European Commission provides grants to member states having identified the territories expected to be the most negatively impacted by the green transition to share the burden more equally between its member countries. Leonard et al. (Reference Leonard, Pisani-Ferry, Shapiro, Tagliapietra and Wolff2021) explore the potential ramifications of the European Green Deal on the competitiveness of countries outside of the European Union. They conclude that to mitigate geopolitical fallout and strengthen global climate efforts, the European Union will need to support the renewable transition at home and abroad, work with international partners, set standards and promote coalitions for climate change mitigation.
3.3 Analytical Framework for Within-Country Inequality
The impact of climate policies on households varies based on a range of factors, including geographic location, gender, wealth and other demographic characteristics. For example, a fuel tax may have a disproportionate impact on rural households compared to urban ones. Other factors that could influence the impact of climate policies on households include nationality, income, ethnicity, region, occupation and education (Box 3.1). To understand how climate policies affect households, we can use a stylised model of economic welfare that includes three components: the income side, the expenditure side and the government side.
Box 3.1 Inequality and the macroeconomy
Climate policies that increase inequality may indirectly affect economic growth and the business cycle. In very simplified terms, higher inequality, on the one hand, can induce higher economic growth as richer households save and invest more; on the other hand, it can lead to weaker economic performance as poorer households cannot invest enough in human capital. Ostry et al. (Reference Ostry, Berg and Tsangarides2014) find that in the medium run the negative effects of inequality prevail and hamper economic growth. Increasing inequality can also lead to economic and political instability, which in turn decreases investment levels. Additionally, inequality can contribute to financial instability, leading to declining growth (Coibion et al., Reference Coibion, Gorodnichenko, Kudlyak and Mondragon2014).
One of the main mechanisms through which inequality affects growth is by undermining education opportunities for children from poorer socio-economic backgrounds, resulting in reduced social mobility and skills development (Cingano, Reference Cingano2014; Ostry et al., Reference Ostry, Berg and Tsangarides2014). When those at the bottom of the income distribution are at risk of not reaching their potential, the economy pays a price not only with weaker demand today but also with lower growth in the future. Protectionist policies and declining investments in education, which have both been linked to economic inequality, may exacerbate this problem (Cingano, Reference Cingano2014; Jaumotte & Osorio, Reference Jaumotte and Osorio2015).
Beyond medium-term effects on growth, inequality can also worsen economic outcomes through its impact on business cycle fluctuations. The rapidly growing HANK literature models general equilibrium implications of inequality and finds that it may substantially weaken aggregate demand, as those at the bottom spend a larger fraction of their income than those at the top (e.g. Auclert et al., Reference Auclert, Rognlie and Straub2020; Gornemann et al., Reference Gornemann, Kuester and Nakajima2016; Kaplan et al., Reference Kaplan, Moll and Violante2018). Bilbiie et al. (Reference Bilbiie, Primiceri and Tambalotti2022) find that inequality can theoretically amplify business cycle fluctuations, due to cyclical precautionary saving behaviour. Confronted with the risk of unemployment and low income, households may reduce their consumption in favour of saving. Since the risk of income drops is greater in less equal societies and felt most during recessions, inequality could exacerbate economic downturns.
3.3.1 Income Side
Households generate income when working or because they own capital that gives a return. Climate policies can affect this income in various ways. For example, the owner of a coal mine may see the income they earn from their mine decline because of carbon pricing, while a biotech engineer may see an increase in income due to increased investment in advanced biofuels. Low-income households typically own fewer production factors, such as land or capital, than high-income households. However, skill-based income (i.e. labour) represents a higher share of total income for low-income households, even though the wages they earn with these skills may be lower. Households can use their budget to invest in production factors, such as land, capital assets or education. While high-income households may often find that such investments increase their overall wellbeing, low-income households may need to invest all of their income to pay for basic needs, such as food and rent. Without the means to invest into their education or purchase goods like electric vehicle, low-income households may not be able to adjust to a decarbonised economy as well as high-income households.
3.3.2 Expenditure Side
Households make consumption decisions based on a combination of factors, including the utility they derive from immediate consumption and the welfare they can expect to receive from the acquisition of durable goods, like housing. Additionally, the provision of goods and services by the government, as well as the quality of the environment, play a role in the overall wellbeing of households. Consumption decisions of households can be seen as actions aimed at maximising their individual utility by acquiring the optimal combination of goods and services. Expenditure decisions depend on several factors, including a household’s preferences for individual goods and services, its borrowing constraints and the total budget it allocates to consumption. Because of these factors, climate policies may affect low and high-income households in different ways.
(1) Preferences differ between households; low-income individuals, for example, often put a higher value on immediate consumption and might benefit less from climate policies that promote investments in low-carbon technologies and appliances. (2) Given their lower credit scores and lack of collateral, low-income households also often face stricter borrowing constraints than wealthier households. This can prevent them from investing in technologies that would reduce their monetary and carbon expenditure over time. (3) Differences in the consumption level between lower- and higher-income households are partly explained by the size of their budget allocated to consumption.Footnote 6 Because basic goods (such as heating or food) form a much higher share of low-income households’ consumption baskets, policies that raise the prices of these goods can have distributional effects. If, for example, a carbon tax increases the cost of heating, the disposable income of low-income households might substantially shrink, while the effect on the disposable income of high-income households might be negligible.
In addition to differences in preferences, borrowing ability and consumption baskets, households with different incomes may also have different abilities to make expenditures that reduce their exposure to carbon prices or allow them to benefit from support schemes. For example, high-income households may be able to take advantage of a rooftop solar subsidy because they own a house.
3.3.3 Government Side
Governments collect a variety of taxes, including those on income from capital, labour and land and those on consumption. These revenues are used to fund the provision of public goods and services, such as streets and public transportation, as well as transfers to individuals, such as social security benefits. Climate policies that generate public revenue can enable governments to reduce other taxes, increase the provision of transfers and public services or use the revenue in other ways. In theory, governments can offset the distributional effects of regressive climate policies through targeted lump-sum transfers or by reducing other regressive taxes. The way in which governments choose to use climate policy-related revenues can be progressive, that is, reduce existing inequality, or regressive, that is, exacerbate the disproportional effects of polices.
Figure 3.2 provides a high-level overview of the economic activities of households and individuals. Climate policies can affect the welfare of these groups by altering their income, the value of their investments and the utility they derive from their expenditures and consumption of public services. However, the impact of such policies may vary for low- and high-income households due to structural differences in their economic activities.
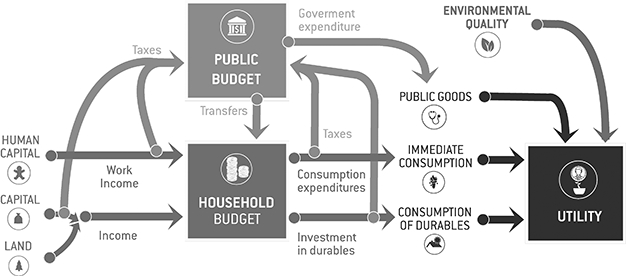
Figure 3.2 Stylised model of households in the economy
Therefore, it is important to analyse the distributional effects of a given climate policy on each economic activity in order to obtain fair policy guidance. Focusing on only one aspect of a policy’s impact could bias the outlook. For example, a policy that has a disproportionate cost for low-income households on the expenditure side might decrease the returns to production factors held by high-income households on the income side, resulting in a roughly proportionate distributional effect. The type of policy, the targeted sector, the policy’s design and the characteristics of the economy all play a role in determining the direction and extent of a policy’s distributional impact.
3.4 Distributional Effects of Climate Policies
3.4.1 Carbon Pricing
Many economists view the implementation of a carbon price, through the use of price-based instruments (e.g. taxes) or quantity-based instruments (e.g. emissions allowances), as the most economically efficient method of reducing emissions (e.g. Cramton et al., Reference Cramton, MacKay, Ockenfels and Stoft2017). This approach can take the form of a single carbon price applied across all sectors, as seen in the European Union’s Emissions Trading System (ETS), or a set of varying prices determined by sector, such as those implemented for aviation emissions.
The implementation of a carbon price can have two main distributional effects. Firstly, it increases the cost of emissions-intensive products for consumers, which is typically regressive as lower-income households spend a larger share of their income on these goods and may have fewer options for switching to less emissions-intensive substitutes. Secondly, a carbon price can alter the return to factors of production, such as capital and labour, with a slight tendency towards progressivity as emissions-intensive capital assets are more likely to be held by high-income households. However, these households also tend to own capital assets that may benefit from the implementation of a carbon price, such as shares in wind turbine manufacturers.
The distributional effects of carbon pricing differ across sectors based on factors such as the availability of low-carbon alternatives, the ability of producers to reduce prices and the consumption basket of households. First, the incidence of carbon pricing (i.e. how the cost is distributed between consumers and producers) will depend on the targeted product and its market conditions. In sectors where consumers can easily switch to low-carbon alternatives, producers of high-carbon products must either pay the carbon tax or lose market share. However, in sectors where no low-carbon alternatives exist, producers can pass the cost of the carbon tax on to consumers. Second, the extent to which producers can reduce prices will affect the distribution of the carbon price between them and consumers. For products that cannot be offered at lower prices, consumers will bear the cost of the carbon tax, while for products that can be offered at lower prices, producers will absorb a greater share of the carbon price. Finally, low-income households spend a disproportionally larger share of their expenditure on some products and services, such as electricity. A tax on these products and services may therefore be regressive. In contrast, services like aviation make up a larger expenditure share for high-income households and a tax on such services may be progressive (Table 3.1). This means that although the absolute expenditure of richer households for food or electricity is likely higher than that of poorer households, the effect of a tax may be felt most by the poor, given their higher relative expenditure share.
Table 3.1 Summary table of greenhouse gas emissions and the share of overall household consumption expenditure for sectors affected by carbon pricing
| Category name in our report | Share of total emissions (EU-28) (%) | Share of expenditure on sector/product in overall household expenditure (Italy) | Engel curve slope estimate | ||
|---|---|---|---|---|---|
| Bottom income quintile (%) | Average household (%) | Top income quintile (%) | |||
| Air transport | 4 | 0.2 | 0.3 | 0.4 | 0.07* |
| Road fuel | 9 | 5.6 | 5.2 | 4.1 | –0.89*** |
| Agriculture | 11 | 22.7 | 18.2 | 16.5 | –1.25*** |
| Electricity | 21 | 3.9 | 2.4 | 2.4 | –0.33 |
| Heating | 3.8 | 2.8 | 1.7 | – | |
Note: An Engel curve slope estimate indicates how the expenditure on a particular good or service varies with income. Goods with a statistically significant positive slope estimate are consumed relatively more by high-income households, whereas low-income households spend a larger share of their income on goods with a statistically significant negative slope estimate. *** significant at 1 per cent level; ** significant at 5 per cent level; * significant at 10 per cent level. All data besides the Engel curve slope estimates are for 2019.
3.4.1.1 Road Fuel Emissions
Road fuels are a significant contributor to global emissions, and therefore decarbonisation policies in the road transport sector are a key area for policymakers. Initial effects of a carbon tax on households may include reduced consumption of fossil fuels as a result of increased prices and an increased incentive to invest in electric vehicles. The overall utility of households may be reduced, but this effect can be offset depending on how the government uses the additional revenue from the carbon taxes. As poor people often do not own a car and rich people spend a relatively low share of their budget on fuels and they are able to afford electric vehicles, the burden tends to fall on the middle class. Overall, literature on the distributional effects of road fuel taxes is mixed, with some studies finding it to be regressive (Brannlund & Nordström, Reference Brannlund and Nordström2004; Dumagan & Mount, Reference Dumagan and Mount1992; Tovar Reaños & Wölfing, Reference Tovar Reaños and Wölfing2018; West & Williams, Reference West2017) and others finding it to be progressive (Flues & Thomas, Reference Flues and Thomas2015; Tiezzi, Reference Tiezzi2005).
3.4.1.2 Electricity Consumption
In high-income countries, electricity taxes tend to be regressive. Flues and Thomas (Reference Flues and Thomas2015) conducted a study of twenty-one Organisation for Economic Co-operation and Development (OECD) countries and found that, on average, electricity taxes are regressive on both an expenditure basis and an income basis. A study by Tovar Reaños and Wölfing (Reference Tovar Reaños and Wölfing2018) came to similar conclusions for the case of Germany. The regressive nature of electricity taxes has several drivers. The demand for electricity in high-income countries is inelastic. This means that households are unable to reduce their consumption significantly in response to price increases, because all modern households require a minimum amount of electricity for essential appliances. Additionally, credit constraints can prevent low-income households from switching to more efficient appliances, even if they would like to do so, further exacerbating the regressive nature of electricity taxes.
In low-income countries, however, similar policy measures can be progressive (Ohlendorf et al., Reference Ohlendorf, Jakob, Minx, Schröder and Steckel2021). Dorban et al. (2019) assess the expected incidence of moderate carbon price increases in eighty-seven low- and middle-income countries and find that poor households in low-income countries are less affected. They explain their findings with the inverse-U relation between energy expenditure and income. Poor households in low-income countries spend less on electricity since their level of income does not allow for many electrical appliances.
3.4.1.3 Residential Heating
The distributional effects of taxes on residential heating is another issue analysed by the two abovementioned studies. Both studies found that heat taxes are regressive. However, while Tovar Reaños and Wölfing (Reference Tovar Reaños and Wölfing2018) estimate that heat taxes result in a welfare loss two to three times greater than that resulting from electricity taxes, Flues and Thomas (Reference Flues and Thomas2015) find that electricity taxes tend to be more regressive than taxes on heating fuel. The impact of heating taxes on low-income households may be mitigated by the fact that these households are more likely to live in smaller dwellings or apartment blocks that require less heating and are more sensitive to increasing costs, leading them to use less heat. Overall, while heating taxes are likely regressive, the extent to which they disproportionately hurt low-income households compared to other taxes remains unclear.
3.4.1.4 Aviation Services
Existing evidence suggests that air transport taxes are unlikely to be regressive. This is because high-income households are more likely to fly and spend larger portions of their income on air travel. Furthermore, data from the United Kingdom suggests that people who travel by plane are generally wealthier than the general population, implying that an air travel fuel tax would likely primarily affect high-income households (Zachmann et al., Reference Zachmann, Fredriksson and Claeys2018).
3.4.1.5 Maritime Transport
Maritime shipping is another significant contributor to greenhouse gas emissions, accounting for 2.2 per cent of global emissions in 2012.Footnote 7 However, according to Cames et al. (Reference Cames, Graichen, Siemons and Cook2015), this figure could rise to 17 per cent by 2050 if left unregulated. In 2018, over 100 nations agreed to halve their greenhouse gas emissions from shipping by 2050.Footnote 8 The implementation of a carbon price for maritime emissions could incentivise firms to reduce emissions but would also increase the cost of shipping goods. This could lead to an increase in the price of imported goods, potentially reducing demand for imports and the volume of trade. The impact of a maritime carbon price on final goods prices and on the disposable income of various socio-economic groups, however, is complex and difficult to predict (Kollamthodi et al., Reference Kollamthodi, Pueyo, Gibson, Narkeviciute, Hawkes and Cesbron2013; Zachmann et al., Reference Zachmann, Fredriksson and Claeys2018).
3.4.1.6 Labour Markets
Decarbonisation policies are likely going to have consequences on labour income distribution, because of existing rigidities in the labour markets and their different impacts on sectors and job categories. A detailed analysis of these effects is presented in Chapter 7.
3.4.2 Subsidies
Many governments provide incentives for low-carbon technologies in their pursuit of climate objectives. These incentives can be direct subsidies for research and development, tax breaks for the purchase of electric vehicles or para-fiscal instruments such as feed-in tariffs for rooftop solar panels. Because they benefit higher-income households and companies that have the capital to invest in new low-carbon assets, such subsidies are likely regressive.
Early findings by West (Reference West2004) show that subsidies for new vehicles are more regressive than taxes on gasoline. Grösche and Schröder (Reference Grösche and Schröder2014) similarly find that the German feed-in tariff system, which uses a levy on electricity consumption to subsidise solar panels for households, was mildly regressive. Tovar Reaños and Sommerfeld (Reference Tovar Reaños and Sommerfeld2018) demonstrate that the regressive effects of subsidies can also be seen in Germany’s 2016 implementation of a €4,000 subsidy for electric vehicle purchases, which was financed through increased fuel prices. This subsidy primarily benefited higher-income households because lower-income households were unable to afford the expense of a new electric vehicle even with the subsidy.
Overall, many low-carbon subsidies are regressive because they reduce the price of goods that are primarily purchased by higher-income households. Subsidising clean vehicles, for instance, primarily benefits those who can afford them, while the less affluent gain little.
3.4.3 Public Investment
Another example for widespread climate policies is government investment in low-carbon technologies or complementary infrastructure, such as public transport or charging infrastructure for electric vehicles. The literature on the distributional effects of such investment in developed countries is scarce. For developing countries, however, several studies have indicated that public investment can reduce inequality.
For example, Dercon (Reference Dercon2014) finds that moving investment away from long-distance transport and allocating it to local development can reduce inequality, though the distributional impact depends on the details of the particular investment project and the economic context. Furceri and Li (Reference Furceri and Li2017) report that increased public investment reduces income inequality, though the effect depends on whether the infrastructure generates productivity gains only in the sector involved or also in other sectors. Evidence from China and Latin America also suggests that public investment in infrastructure such as roads, dams and telecommunications has contributed towards the alleviation of inequality and poverty (Calderón & Servén, Reference Calderón and Servén2004; De Ferranti et al., Reference De Ferranti, Perry, Ferreira and Walton2004; Fan & Zhang, Reference Fan and Zhang2004). By contrast, Chatterjee and Turnovsky (Reference Chatterjee and Turnovsky2012) find that government spending on public capital leads to a persistent increase in wealth inequality in terms of income dispersion, while spurring growth and average welfare. Similar findings by Khandker and Koolwal (Reference Khandker and Koolwal2007) suggest that access to paved roads has had limited distributional benefits in rural Bangladesh.
The distributional consequences of public investment may depend on various factors such as the specifics of the investment, the economic context and the financing mechanism. It is important to carefully consider these factors in order to maximise the potential benefits and mitigate any adverse distributional consequences.
3.4.4 Trade Policy
According to Peters et al. (Reference Peters, Davis and Andrew2012), approximately 22 per cent of global CO2 emissions are a result of the consumption of goods produced in another country. In a globally integrated economy, the goods that are consumed usually contain parts that have been produced elsewhere. This is the result of long value chains, which increase economic efficiency and make our products cheaper and better. For climate policy to be effective, it is important that climate policies reduce emissions at all stages of the production process. If all countries implemented the same climate policies, emissions would be cut according to the same rules across the world. In practice, however, climate policies differ. As these policies differ, producers might find it profitable to shift carbon-intensive production to countries with less stringent climate policies. This type of carbon leakage can frustrate domestic climate policies. Empirically, we can observe that consumption-based and production-based emission footprints of countries differ.
Trade policy is therefore considered a potential instrument for decarbonisation, and the question for this chapter is how trade policy measures to fight carbon leakage would affect inequality. One potential approach is for countries to impose trade restrictions on imports from countries with less stringent climate policies in order to protect domestic producers from competitive disadvantages resulting from stricter environmental regulations and to incentivise trading partners to reduce emissions. Another approach is to reduce trade restrictions on environmentally friendly goods.Footnote 9
On the expenditure side, the distributional impact of a tariff on carbon-intensive foreign products will be similar to that of a carbon tax, in that consumers who spend a disproportionate share of their income on these imported goods will be disproportionately affected. This effect may be compounded by the fact that many carbon-intensive products are intermediate goods used in the production of final consumer goods. Distributive effects will thus be shaped by the specific design of the policy, including the size of tariffs on individual imported goods. An analysis of trade data from forty countries by Fajgelbaum and Khandelwal (Reference Fajgelbaum and Khandelwal2016) found that low-income households gain the most from trade on the expenditure side. Therefore, limiting or restricting trade will disproportionately harm low-income households. This is because low-income households tend to spend a larger fraction of their income on traded goods, while high-income households spend more on domestically produced services.
On the income side, producers of substitute goods for carbon-intensive imports will likely see an increase in income, as will the labour employed in these sectors. Also, there is some evidence suggesting that trade barriers can reduce the wage premium for high-skilled labour (Borusyak & Jaravel, Reference Borusyak and Jaravel2018). Additionally, capital owners in sectors where foreign competitors are locked out may see significant gains as their newly acquired market power allows them to raise prices, transferring wealth from consumers to these firms and their owners.
3.4.4.1 The Carbon Border Adjustment Mechanism
The European Union has adopted a proposal to establish a system called the carbon border adjustment mechanism (CBAM).Footnote 10 The purpose of the CBAM is to prevent companies in the European Union from moving their production to countries with less strict carbon emission regulations, a process known as ‘carbon leakage’. Such carbon leakage would present a risk to EU economies and undermine its efforts to limit global emissions. The CBAM requires companies in the European Union importing certain products that have high carbon emissions, such as cement, iron and steel, aluminium, fertilisers and electricity, to pay for allowances based on the carbon content of those products. This is meant to replace the current system of allocating free allowances in the EU ETS, which is also used to prevent carbon leakage. The CBAM applies to industries that are already part of the EU ETS, and the cost of the allowances is similar to the price of allowances in the ETS. The CBAM is expected to increase the price of the covered goods.
The European Commission conducted a study to understand the potential distributional effects of the CBAM, using a computational model for different scenarios. The overall conclusion was that the CBAM would be regressive, meaning it would disproportionately impact poorer households more than wealthier ones. However, the impact is expected to be small due to limited effects on household incomes and consumption prices. The study also looked at the effects on household spending and income separately. The CBAM was found to be regressive on the expenditure side, as the consumption of poorer households would become more expensive in most countries. On the income side, the CBAM was again generally regressive, as it increased capital returns and wages, which would disproportionately benefit wealthier households who receive a higher proportion of their income from capital and labour. It should be noted that part of the regressive income-side effect may have been due to the choice on how to recycle carbon revenues, which reduces labour income taxes and disproportionately benefits wealthier households.
3.4.5 Standards
Efficiency standards mandate or regulate products with certain characteristics, such as low energy consumption or emissions. Economists have long debated the relative efficiency of taxes versus standards in reducing vehicle emissions (e.g. Jacobsen, Reference Jacobsen2013; Levinson, Reference Levinson2016). Distributional consequences of standards are less controversial. The US Corporate Average Fuel Economy (CAFE), for example, can be seen as regressive when considering the impact on used vehicles (Davis & Knittel, Reference Davis and Knittel2016; Jacobsen, Reference Jacobsen2013). Fleet standards incentivise producers to increase the prices of less efficient cars, which trickles down to the second-hand market and imposes an implicit tax on cars commonly purchased by less-wealthy households. Efficient cars, primarily bought by wealthier households, on the other hand, are effectively subsidised as producers lower prices to increase sales to meet fleet-average emissions targets (Levinson, Reference Levinson2016).
In general, Levinson (Reference Levinson2016) argues that standards in all sectors may be more regressive than carbon prices, due to the fact that they disproportionately affect less frequent users, who tend to have higher incomes, and do not allow for progressive revenue recycling schemes. However, it is worth noting that many studies on the regressive effects of standards do not take into account the long-term effects of these policies, such as their potential to drive innovation. Furthermore, in developing countries, some governments may find it difficult to collect taxes, making standards a more feasible option for enforcing regulations.
3.4.6 Agriculture
Food production, which includes land use, crop and livestock production, and supply chains, accounts for around one-quarter of global greenhouse gas emissions (Poore & Nemecek, Reference Poore and Nemecek2018). Decarbonisation policies in the agricultural sector are therefore likely to be a focus in the future. In addition to the direct cost impact of reducing emissions in agriculture, decarbonisation policies in other sectors may also significantly affect food prices. The production of biofuels, for example, can lead to higher crop prices and subsequently higher food prices. If negative-emission technologies and bioenergy with carbon capture and storage become key components of global decarbonisation, food prices may increase. Since low-income households spend a higher share of their income on food, such an increase could be regressive.
Differences in food preferences and the effect of climate policies on individual products can further alter the cost faced by different income groups. Carbon-intensive food products are likely to become disproportionately more expensive when agricultural emissions are regulated. The greenhouse gas emissions from producing one kilogram of beef, for example, can be up to 70 kilograms of CO2 equivalent (Zachmann et al., Reference Zachmann, Fredriksson and Claeys2018).
In the United Kingdom, high-income households spend an additional 40 per cent or more on rice, salmon, chicken and beef, while the low-income households spend more on milk.Footnote 11 Zachmann et al. (Reference Zachmann, Fredriksson and Claeys2018) examine the share of carbon value in total food expenditure of different households in the United Kingdom and find that the shares are similar for all household types, suggesting that while the general climate policy induced increase in food prices is regressive, the differentiated effects of climate policy on the cost of different food items may not be. In general, research on the distributional impact of regulating emissions from agriculture is scarce and further analyses are needed.
3.4.7 Summary of Within-Country Effects
Climate policies, such as electricity taxes, aim to address the issue of carbon emissions. A review of the empirical literature shows that different policies have varying distributional impacts, with some being more regressive than others. Thereby, the direction and size of the distributional effect depend not only on the chosen policy tool (e.g. standard vs tax) but also on its sectoral coverage (e.g. of carbon taxes), implementation (e.g. fleet standards vs absolute minimum standards) and the economic environment in which they are implemented (e.g. countries with different sector structures). In addition, policies may affect horizontal equity by affecting households differently based on factors other than income. This indicates that finding a combination of policy tools that mitigate adverse distributional effects while ensuring effective decarbonisation requires situation-specific analysis.
3.5 Between-Country Inequality
For global climate change it is essentially irrelevant in which country a molecule of a greenhouse gas is emitted. But for the individual country’s economies, it matters a lot if they have to decarbonise faster than others. Implicitly distributing a limited ‘carbon budget’ across time and between countries is the central aspect of international climate negotiations. All financial and technology transfers (e.g. loss and damage, climate finance, technology transfer, emission trading) primarily serve to enable a global compromise on what some might see as a zero-sum game. The UNFCCC process is based on the principle of ‘common but differentiated responsibilities’ but continues to struggle to translate it into generally accepted definitions. The challenge is that a ‘fair’ share of emissions can be distributed along many criteria like wealth of the countries, historic emissions, current emissions and population. Figure 3.3 reveals that countries with currently high CO2 per capita emissions may rank low on the list of historical emitters. In the 1997 Kyoto protocol, the world was split into two types of countries – binding commitments (20 per cent reduction from 1990 to 2020) for industrialised countries, no commitments for other countries (including China). In the 2015 Paris Agreement all countries have self-determined decarbonisation obligations, and tools exist to encourage a ratcheting up of these ambitions. But the general challenge of splitting the decarbonisation burden across countries in a way each and every of them perceives as fair remains.

But the transition to a low-carbon economy in itself also holds distributional implications across countries. The measures required to achieve a green transition and their economic consequences will differ between countries, depending on factors such as their level of economic development, industrial specialisations and political circumstances. Countries that have historically been reliant on the export of fossil fuels for their economic growth, for example, may find it difficult to pivot to an alternative economic model. However, the transformation of industry towards more low-carbon modes of production also holds opportunities for economic growth. Whether all countries can attract and benefit from the large-scale investments necessary to achieve this transformation, however, depends on their economic and political context. If climate policy investments disproportionately benefit developed countries, they may further the gap between richer and poorer countries. While the complexities and uncertainties connected to different transition scenarios make it difficult to give concrete prediction about distributional ramifications, it is possible to identify several influencing factors.
3.5.1 Dependence on Fossil Fuels
Some countries receive a significant share of their value added from the extraction of fossil fuels. Figure 3.4 shows the share of oil and natural gas rents in GDP of various countries since 2010. If in response to the green transitions the demand for fossil fuel falls, the economic models of countries most reliant on fossil fuels, like the Organisation of the Petroleum Exporting Countries (OPEC) members and Russia, will face substantial challenges (IRENA, 2019). The degree of exposure to this risk varies widely between countries. Countries importing fossil fuel, like the European Union, China, India and Japan, may even benefit from the reduced fuel expenditure (Mercure et al., Reference Mercure, Pollitt, Edwards, Holden, Chewpreecha and Salas2018). The United States, despite having emerged as a gas exporter following its shale revolution, has a more diversified economic model. However, as noted by the International Energy Agency (IEA) in a 2018 report, most countries relying heavily on hydrocarbon revenues have less diversified economies and are more vulnerable. Past drops in the net income available from oil and gas and investment shortages already presented challenges to countries like Iraq, Nigeria and Venezuela. Projections based on the Paris Agreement suggest that future income losses faced by oil and gas producers are around $7 trillion. For example, Nigeria could experience a loss in future incomes of approximately $500 billion, Saudi Arabia nearly $2 trillion and the United Arab Emirates approximately $900 billion (IEA, 2018). Mercure et al. (Reference Mercure, Pollitt, Edwards, Holden, Chewpreecha and Salas2018), come to similar conclusions, with OPEC member states facing significant stranded fossil fuel assets and declining investment. A study by Makarov et al. (Reference Makarov, Chen and Paltsev2017) on Russia stresses that sustained growth in low-carbon scenarios will depend on its ability to diversify and invest.

The ability of oil, gas and coal exporters to diversify away from fossil fuel revenues varies between countries. Low-cost fossil fuel producers like Saudi Arabia and the United Arab Emirates may still profit in declining markets, allowing them to adapt by investing in profits in downstream industries like petrochemicals (Goldthau & Westphal, Reference Goldthau and Westphal2019; IEA, 2018; Tagliapietra, Reference Tagliapietra2019). Other, less competitive, fossil producer countries, however, would bear greater losses in revenue (Mercure et al., Reference Mercure, Salas, Vercoulen, Semieniuk, Lam and Pollitt2021). Goldthau et al. (Reference Goldthau, Eicke, Weko, Hafner and Tagliapietra2020) argue that many resource-rich countries in the Global South may also face declining terms of trade, as their exports decrease relative to imports, exacerbating the economic perils. However, predicting the dynamics that will unfold in response to a green transition is difficult, and the consequences may go well beyond fossil fuel industry. Cahen-Fourot et al. (Reference Cahen-Fourot, Campiglio, Godin, Kemp-Benedict and Trsek2021), for example, find that the ‘capital stranding’ could be triggered in a much wider range of sectors and expose developed nations to greater risk.
3.5.2 Investments and Opportunities
Next to the obvious risks for economies currently relying on fossil fuel production, the transition to a low-carbon economy also holds opportunities for economic growth. The large-scale investments in policy changes that are required for the transition can provide stimulus to economies and reduce their dependence on fossil imports in favour of domestic and renewable energy sources. Based on models collected by the Intergovernmental Panel on Climate Change, scenarios leading to net zero by 2050 are expected to lead to a sizeable increase in real GDP. The average economic growth in these sixty-six scenarios is 2.8 per cent per year between 2020 and 2050 (see Chapter 5). While investments and policy changes are required across the board, some countries stand to benefit more than others. This is because the availability of renewable resources and investments depends on geographical, political and economic factors. As a result, countries in the Global South especially may struggle to reap the benefits of a global transition towards net zero. Figure 3.5 shows that the financing costs of many developing countries are higher than those of countries like the United States or Germany. Since 2022, inflation, high interest rates in developing countries and overall economic uncertainty have further exacerbated financing conditions in much of the developing world (IMF, 2022).
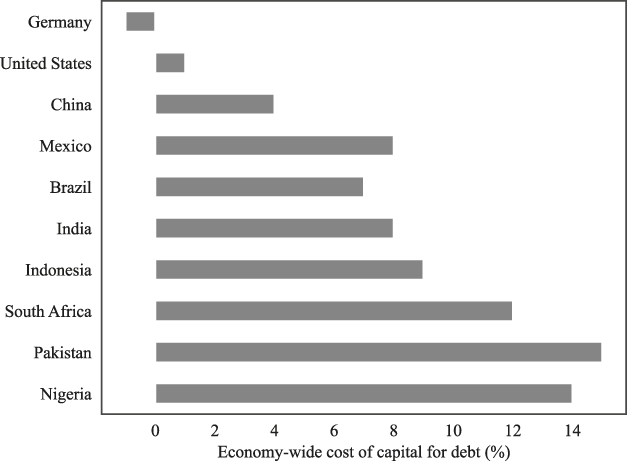
Figure 3.5 The cost of capital for the energy transitions, 2020
Note: Economy-wide cost of capital is calculated as the sum of ten-year local currency bond yield and the debt and equity market risk premiums required by investors to invest in the debt and equity securities of a given market.
Increased reliance on renewable energy sources could bring a competitive advantage to southern countries with high solar energy potential or costal states with large offshore wind energy potential. Harvesting this renewable energy potential, however, requires investment and technological know-how, both of which are often difficult to access for countries in the Global South. IRENA (2019) reports that, judging by the number of patents in the low-carbon technology domain, low-carbon technology remains concentrated in terms of ownership. So far only few developing economies, like Brazil, have joined the OECD and China among countries with renewable technology capacity. If countries in the Global South do not succeed in building up indigenous capacities, dependence on these countries will grow, risking trade and political tensions and monopolies (Goldthau et al., Reference Goldthau, Eicke, Weko, Hafner and Tagliapietra2020).
Although increased demand in key minerals and metals needed for the development and deployment of renewable technologies may benefit countries in Latin America and Africa, as well as China (World Bank, 2017), technology development, the most lucrative part of the supply chain, remains centred in the United States, the European Union, China and Japan (Curran, Reference Curran2015; Nahm, Reference Nahm2017). In China, local industrial policies helped firms upgrade in the clean energy value chain (Gosens & Lu, Reference Gosens and Lu2013; Schmitz & Lema, Reference Schmitz, Lema, Fagerberg, Laestadius and Martin2015; Zhang & Gallagher, Reference Zhang and Gallagher2016). Similar policies, however, may not succeed in countries with smaller markets, poor regulation and lower innovative potential (Johnson, Reference Johnson2016). In addition, private developers may be hesitant to invest in politically unstable or poor countries due to the risk involved (Kirchherr & Urban, Reference Kirchherr and Urban2018). These risks raise the costs of transition away from high-carbon technology. Large existing investments in fossil fuel infrastructure in the Global South by countries like China (e.g. Zhou et al., Reference Zhou, Gilbert, Wang, Cabré and Gallagher2018) and the growing energy demand in developing regions could further impede the ability of countries to transition to renewable energy and reap its long-term benefits (Mercure et al., Reference Mercure, Pollitt, Edwards, Holden, Chewpreecha and Salas2018; Unruh, Reference Unruh2000; Unruh & Carrillo-Hermosilla, Reference Unruh and Carrillo-Hermosilla2006). While efforts are being made by international institutions and public–private partnerships to facilitate technology transfers, they have so far fallen short of turning the tide, indicating a risk of continued divergence between the Global North and South (Goldthau et al., Reference Goldthau, Eicke, Weko, Hafner and Tagliapietra2020).
Macroeconomic ramifications. The investments required to achieve the green transition could lead to large macroeconomic shifts. Luciani (Reference Luciani, Hafner and Tagliapietra2020) argues that the massive shift from consumption to investment necessary for the transition will not be achieved by simply redirecting existing savings but requires an increased rate of savings over GDP. Under normal circumstances, such increases in investment are expected to spur growth by expanding the economy’s productive capacity. However, existing capital stocks may become obsolete, and investments abroad do not directly contribute to domestic growth, limiting the growth for those countries who bear the brunt of the investment burden. Economies that rely on export for their economic growth, like China and Germany, may especially struggle to uphold consumption and export growth when faced with large investment needs. The institutional shifts necessary to enable and accommodate investments could thus change the global economic landscape and lead to a redistribution of economic power.
3.5.3 Policy Examples
While distributional consequences for less competitive fossil fuel exporters and countries in the Global South that fail to mobilise sufficient investment are likely, their direction and magnitude remain largely uncertain. Analyses of individual policy responses have attempted to draw a more concrete picture of the consequences. Leonard et al. (Reference Leonard, Pisani-Ferry, Shapiro, Tagliapietra and Wolff2021), for instance, assess the distributional consequences of the EU Green New Deal. They find that while higher carbon prices will induce an abatement of fossil industries, the costs related to this shift differ widely across EU countries. Options for reducing emissions vary within and across sectors. For instance, some countries may be able to decommission polluting facilities that are no longer economically viable, while others may require significant investments to achieve emissions reductions within a sector. Additionally, the EU ETS, which covers emissions from the power and industrial sectors, shows that wealthier countries tend to have a greater share of industrial emissions, which can be costlier to abate, while poorer countries tend to have a larger share of emissions from the power sector, which may be more affordable to reduce.
To ensure a fairer sharing of the burdens of decarbonisation, despite substantial between-country inequalities, the UNFCCC process has early on established three classes of instruments: climate finance, technology transfer and international carbon trading. The massive distributional effects between sovereign countries that these three classes of policies can have, however, resulted in relatively slow progress in the corresponding international negotiations that essentially require unanimity. But those policies might eventually gain momentum (the $100 billion pledge for climate finance goes in that direction) as pieces of a ‘grand bargain’ to ensure sufficient mitigation action in emerging and developing countries too.
3.6 Key Takeaways
3.6.1 What Is Inequality and Why Does It Matter for the Green Transition?
Inequality matters because it has direct implications for the total welfare of a population as well as for a country’s economic growth.
In addition, political support for the green transition hinges on the (perceived) distributional consequences of policies both within countries and internationally.
Measures of income inequality capture only parts of the unequal effects of policies. The natural environment, community life or personal circumstances are among many factors that are affected by climate change as well as by climate policy and are not typically captured by measures of income inequality.
3.6.2 Analytical Framework for Within-Country Inequality
Households are affected by the transition to a zero-carbon economy both on the expenditure and income sides.
On the expenditure side, households may, for example, face higher energy prices because of carbon pricing or other climate policies.
On the income side, households may benefit or lose from changes in employment and wages in different sectors as a result of the transition.
3.6.3 Distributional Effects of Climate Policies
Depending on the initial conditions, the chosen policy instrument, its sectoral coverage and its implementation, the economic impacts of decarbonisation policy can differ strongly between different population groups.
Policies such as revenue recycling and instrument design can help to mitigate these negative effects and promote a more equitable transition.
3.6.4 Between-Country Inequality
Climate change has unequal effects on different countries in the world. Many poor countries are directly affected by climate change, for example through droughts, floods, extreme weather events and changes in the natural environment. Reducing emissions in the industrialised world would therefore tend to reduce inequality.
Climate policy also changes rents that can be extracted from selling fossil fuels. Some countries such as Russia, the countries of the Gulf and several African countries export oil and gas, which form the basis of large parts of their overall export and sometimes government revenues.
In addition, not all countries may be able to invest in and economically benefit from low-carbon technologies in the same way. The investment and technological capacities in developing countries, especially, may need to be strengthened to ensure a more equitable outcome of the transition.
The high degree of political and economic uncertainty makes the quantification of the magnitude of distributional consequences difficult. Considering the need for global political consensus and effective financing, however, the importance of economic and institutional shifts resulting from the transition cannot be overstated.


