


Introduction
Surge-type glaciers exhibit multiyear, quasi-cyclical velocity fluctuations between a prolonged quiescent phase of slow flow and a shorter active phase of fast flow, during which ice velocities can increase by 10–1000 times (Meier and Post, Reference Meier and Post1969; Raymond, Reference Raymond1987; Sund and others, Reference Sund, Eiken, Hagen and Kääb2009). Most surge-type glaciers concentrate in spatial clusters within an optimal climatic envelope, such as Svalbard (74–81°N) (Sevestre and Benn, Reference Sevestre and Benn2015). Glaciers cover 57% of the land of this archipelago and more than 60% of the glaciated area is represented by tidewater glaciers (Błaszczyk and others, Reference Błaszczyk, Jania and Hagen2009; Nuth and others, Reference Nuth2013). There is general agreement that surging is a common phenomenon in Svalbard (e.g. Liestøl, Reference Liestøl1969; Jania, Reference Jania1988; Lefauconnier and Hagen, Reference Lefauconnier and Hagen1991; Hagen and others, Reference Hagen, Liestøl, Roland and Jørgensen1993; Sevestre and Benn, Reference Sevestre and Benn2015; Farnsworth and others, Reference Farnsworth, Ingólfsson, Retelle and Schomacker2016; Benn and others, Reference Benn, Hewitt and Luckman2023), although the estimated percentage of surge-type glaciers varies from 13% (Jiskoot and others, Reference Jiskoot, Boyle and Murray1998) to 90% (Hagen and Liestøl, Reference Hagen and Liestøl1990). The duration of the quiescent phase typically ranges from 30 to 150 years, but can be as long as 500 years (Dowdeswell and others, Reference Dowdeswell, Hamilton and Hagen1991; Hagen and others, Reference Hagen, Liestøl, Roland and Jørgensen1993; Murray and others, Reference Murray, Strozzi, Luckman, Jiskoot and Christakos2003). Therefore, the length of surge cycles often exceeds the observation period, which poses a risk of misclassification of glaciers as non-surging if the active phase has not been observed and associated geomorphological and glaciological records of surging have been obliterated since then (Benn and Evans, Reference Benn and Evans2010).
The frequency of surges is influenced by climatic conditions through changes in the mass balance and modification of the thermal structure of glaciers (Dowdeswell and others, Reference Dowdeswell, Hodgkins, Nuttall, Hagen and Hamilton1995; Sevestre and others, Reference Sevestre, Benn, Hulton and Bælum2015). In recent centuries, Svalbard glaciers reached their maximum extent during the Little Ice Age (LIA) and many of these advances were surge-related (e.g. Liestøl, Reference Liestøl1969; Lefauconnier and Hagen, Reference Lefauconnier and Hagen1991; Christoffersen and others, Reference Christoffersen, Piotrowski and Larsen2005; Sevestre and others, Reference Sevestre, Benn, Hulton and Bælum2015; Farnsworth and others, Reference Farnsworth, Ingólfsson, Retelle and Schomacker2016; Zagórski and others, Reference Zagórski2023). The main sources of data about the timing of the late LIA surges are historical observations of glaciers that have recently advanced (e.g. the surge of Kongsvegen dated to c. 1800; Liestøl, Reference Liestøl1988) or evidence of glaciers experiencing the active phase of a surge as recorded in historical drawings and maps (e.g. Recherchebreen in 1838; Liestøl, Reference Liestøl, Williams and Ferrigno1993, Kongsvegen in 1869; Liestøl, Reference Liestøl1988, Nathorstbreen and Paulabreen mapped in 1898; Ottesen and others, Reference Ottesen2008). Although the phenomenon of glacier surges was unknown at that time, this unique photographic and cartographic documentation can be reinterpreted to identify the evidence for past surge events (e.g. Zagórski and others, Reference Zagórski2023). However, in regions with less archival data on glacier fluctuations during the LIA, such as Hornsund, most surges have only been recorded in the second half of the 20th and in the 21st century (Błaszczyk and others, Reference Błaszczyk, Jania and Kolondra2013). The first maps presenting glacier termini in this area were prepared during the Austro-Hungarian North Pole Expedition 1872–1874 (Peterman, Reference Peterman1874) and the Swedish-Russian Arc-of-Meridian Expedition to Spitsbergen 1899–1902 (Wassiliew, Reference Wassiliew1925) when the glaciers were already extensive or even at their LIA maxima. The scales of these maps and the simplified cartographic representation of glaciers on the older map do not allow the identification of evidence of ongoing surges, such as extensive crevassing or folded medial moraines (Copland and others, Reference Copland, Sharp and Dowdeswell2003). Therefore, some surges may have occurred in this area during the LIA that are not documented in existing inventories.
In the case of sparse archival data, the application of surging glacier landsystem models based on characteristic landform assemblages in the terrestrial (Evans and Rea, Reference Evans and Rea1999, Reference Evans, Rea and Evans2003) and submarine forefields (Ottesen and Dowdeswell, Reference Ottesen and Dowdeswell2006; Ottesen and others, Reference Ottesen2008, Reference Ottesen, Dowdeswell, Bellec and Bjarnadóttir2017) allows the detection of surge-like behaviour of glaciers with no documented surging history (Christoffersen and others, Reference Christoffersen, Piotrowski and Larsen2005; Farnsworth and others, Reference Farnsworth, Ingólfsson, Retelle and Schomacker2016, Reference Farnsworth2017; Flink and Noormets, Reference Flink and Noormets2018). The landforms are a record of a fully active surge with glacier advance (stage 3 according to Sund and others, Reference Sund, Eiken, Hagen and Kääb2009) marked with pro- and supraglacial moraines and characteristic meltwater drainage patterns (Lønne, Reference Lønne2016). One of the key features of the surge landsystems are crevasse-squeeze ridges (CSRs), which indicate basal crevassing and saturated basal sediments during the active surge phase, while the preservation of the ridges implies abrupt surge termination and ice stagnation during the quiescent phase (Evans and Rea, Reference Evans and Rea1999; Ben-Yehoshua and others, Reference Ben-Yehoshua, Aradóttir, Farnsworth, Benediktsson and Ingólfsson2023). Fast ice flow during the surge can be inferred from streamlined glacial lineations (Ottesen and Dowdeswell, Reference Ottesen and Dowdeswell2006). Glaciotectonic moraines, often associated with debris flow lobes in the marine environment, reflect an advance onto and deformation of proglacial sediments (Lovell and others, Reference Lovell2018). Ice-cored hummocky moraines record entrainment and transport of high volumes of sediments during the advance, and subsequent melt-out on stagnant ice (Evans and Rea, Reference Evans and Rea1999). Small submarine retreat moraines reflect minor winter advances of quiescent tidewater glaciers (Flink and others, Reference Flink2015).
Hansbreen (Hornsund, south Spitsbergen) is one of the most studied glaciers in Svalbard and its possible surge behaviour has long been debated (e.g. Jania, Reference Jania1988; Jania and Głowacki, Reference Jania and Głowacki1996; Rachlewicz and Szczuciński, Reference Rachlewicz and Szczuciński2000; Ćwiąkała and others, Reference Ćwiąkała2018). The glacier and surrounding area have been the subject of numerous investigations (e.g. Jania, Reference Jania1988; Glazovskiy and others, Reference Glazovskiy, Kolondra, Moskalevskiy and Jania1992; Vieli and others, Reference Vieli, Jania and Kolondra2002; Pälli and others, Reference Pälli, Moore, Jania, Kolondra and Glowacki2003; Grabiec and others, Reference Grabiec, Jania, Puczko, Kolondra and Budzik2012; De Andrés and other, Reference De Andrés2018; Laska and others, Reference Laska2022) and its contemporary dynamics are well understood (Błaszczyk and others, Reference Błaszczyk2021, Reference Błaszczyk2024). According to the Randolph Glacier Inventory (RGI) V7.0, there is ‘no evidence’ that Hansbreen is a surge-type glacier (Maussion and others, Reference Maussion2023; RGI 7.0 Consortium, 2023). In contrast to most medium-sized or large tidewater glaciers in Hornsund, Hansbreen has not surged since the regular monitoring of glacier dynamics initiated in 1982 and there is no unequivocal evidence for surging earlier in the 20th century (Błaszczyk and others, Reference Błaszczyk, Jania and Kolondra2013; Szafraniec, Reference Szafraniec2020). Over the last 40 years, three tidewater glaciers in Hornsund underwent a surge: Paierlbreen (advance of 380 m in 1992–1995), Mendeleevbreen (advance of 1.5 km in 1997–2002) and Svalisbreen (advance of c. 400 m in 2016–2020; Błaszczyk and others, Reference Błaszczyk2023). Evidence of an ongoing surge was also reported in the case of Mühlbacherbreen (in 1961; Sund and others, Reference Sund, Eiken, Hagen and Kääb2009) and Körberbreen (in 1938; Liestøl, Reference Liestøl1969). Marine-terminating Storbreen, Hornbreen and Samarinbreen are also surge-type glaciers (Fig. 1b; Jiskoot and others, Reference Jiskoot, Murray and Boyle2000). Minor advances (c. 100–300 m) of Hansbreen were observed in 1957–1959 (Kosiba, Reference Kosiba1960), 1973–1977 and 1993–1995, and an episode of increased surface velocity occurred in the early 1990s, but these events were interpreted as ‘mini-surges’ rather than fully developed surges (Jania, Reference Jania1988, Reference Jania and Kostrzewski1998). Landforms diagnostic of surging were not detected in the submarine forefield of Hansbreen when it was mapped with multibeam echosounder in 2008 (Tegowski and others, Reference Tegowski, Trzcinska, Kasprzak and Nowak2016; Ćwiąkała and others, Reference Ćwiąkała2018). Farnsworth and others (Reference Farnsworth, Ingólfsson, Retelle and Schomacker2016) classified Hansbreen as a surge-type glacier based on the presence of CSRs in the terrestrial forefield. The geomorphology of the recently deglaciated submarine and terrestrial marginal zones presents an opportunity to investigate newly exposed geomorphological evidence for possible surging. Several studies have also demonstrated the importance of integrating terrestrial and submarine geomorphological records with historical datasets and observations in order to evaluate evidence for past surging of tidewater glaciers (e.g. Ottesen and others, Reference Ottesen2008; Lovell and others, Reference Lovell2018; Aradóttir and others, Reference Aradóttir2019; Zagórski and others, Reference Zagórski2023).
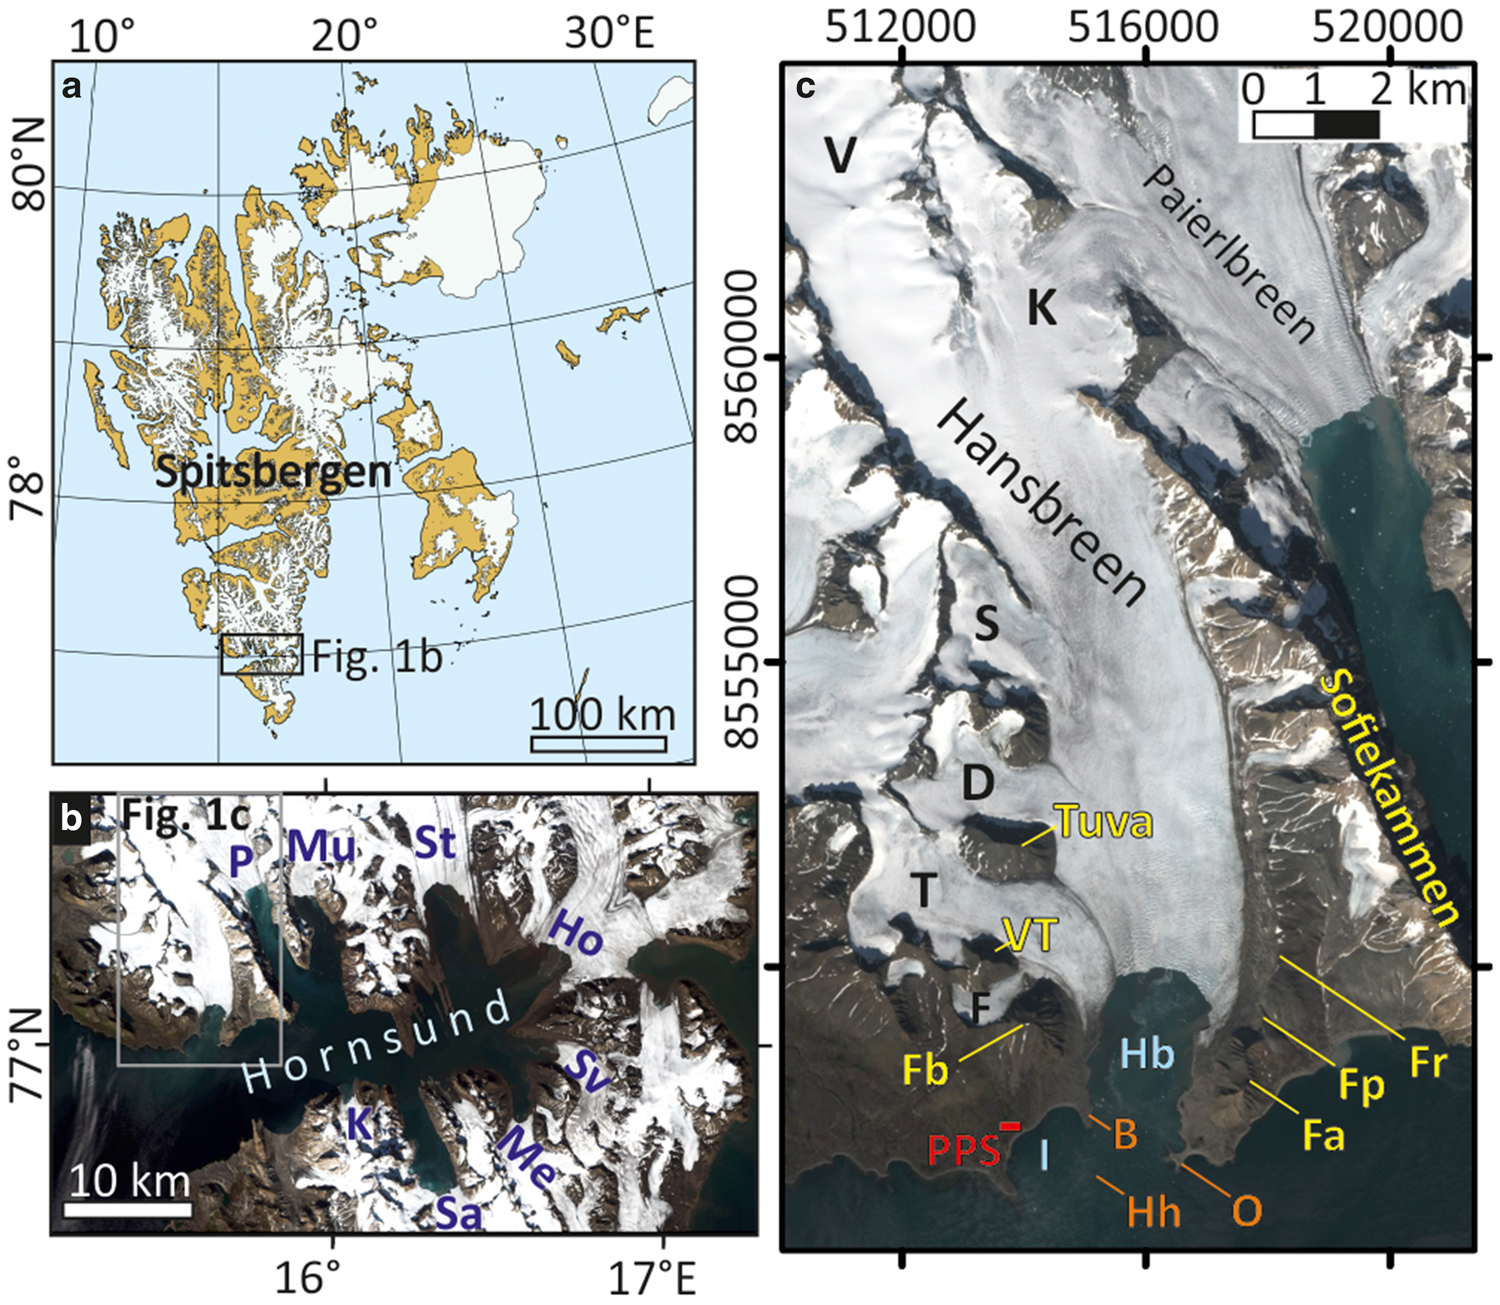
Figure 1. (a) Location of Hansbreen in the Svalbard archipelago and (b, c) Hornsund. (b) Glaciers: Ho, Hornbreen; K, Körberbreen; Me, Mendeleevbreen; Mu, Mühlbacherbreen; P, Paierlbreen; Sa, Samarinbreen; St, Storbreen; Sv, Svalisbreen. (c) Glaciers (black letters): D, Deileggbreen; F, Fuglebreen; K, Kvitungisen; S, Staszelisen; T, Tuvbreen; V, Vrangpeisbreen. Mountain ridges; peaks and saddles (yellow letters): Fa, Fannytoppen; Fb, Fugleberget; Fp, Flatpasset; Fr, Flatryggen; VT, Vesletuva. Peninsulas and islands (orange letters): B, Baranowski Peninsula (Baranowskiodden); Hh, Hansholmane; O, Oseanograftangen. Bays: Hb, Hansbukta; I, Isbjørnhamna. PPS, Polish Polar Station Hornsund. Figure map: © Norwegian Polar Institute (Norwegian Polar Institute, 2014). Sentinel-2B from 27 July 2023.
Here, we present the geomorphology of Hansbreen's terrestrial and submarine forefields and combine this with historical data to evaluate its surge-type behaviour.
Study site
Hansbreen is a polythermal tidewater glacier that terminates in Hansbukta on the northern side of Hornsund in south-west Spitsbergen (Fig. 1; Jania and others, Reference Jania, Mochnacki and Gądek1996; Błaszczyk and others, Reference Błaszczyk2019). The system consists of the main trunk flowing from north to south, four main tributary glaciers on the west (Fuglebreen, Tuvbreen, Deileggbreen and Staszelisen) and several minor tributaries on the east. The glacier is approximately 14 km long with a c. 2 km-long grounded calving front, 51.3 km2 in area (as of 2015), a total ice volume of 9.6 km3, a mean surface slope of 1.8° along the centreline and up to 5.6° along the centrelines of the tributaries (Grabiec and others, Reference Grabiec, Jania, Puczko, Kolondra and Budzik2012; Błaszczyk and others, Reference Błaszczyk2019, Reference Błaszczyk2024). There is a distinct ice divide between Hansbreen and Vrangpeisbreen at the highest part of the main trunk at c. 490 m a.s.l., whereas the tributary glaciers reach up to 565 m a.s.l. (Błaszczyk and others, Reference Błaszczyk2019). The delineation of the eastern border is not straightforward due to the transfluence of ice from the accumulation field of Hansbreen to Kvitungisen, a tributary of Paierlbreen. Around 2010, the mean and the maximum thickness of the glacier were 171 and 386 m, respectively, and the mean surface elevation was 306 m a.s.l. (Grabiec and others, Reference Grabiec, Jania, Puczko, Kolondra and Budzik2012). The surface mass balance has been surveyed since 1989 and the mean annual value in 2000–2019 was −0.26 m w.e. (Schuler and others, Reference Schuler2020). In 2007–2015, the mean annual velocity measured c. 3.5 km from the calving front varied from 49.3 to 88.2 m a−1 and the central part of the front was 4–5 times faster. The average retreat rate in 1992–2015 was 38 m a−1 with a maximum of 311 m a−1 (Błaszczyk and others, Reference Błaszczyk2021). The bedrock of the main trunk is overdeepened below sea level for 10 km from the calving front, and this overdeepening corresponds to a quarter of the total bedrock area beneath the glacier system (Grabiec and others, Reference Grabiec, Jania, Puczko, Kolondra and Budzik2012; Otero and others, Reference Otero2017). The geological structure is complex and diverse with several stratigraphic units of N-S orientation. The main valley has developed within Middle and Late Proterozoic phyllites, dolomites and conglomerates as well as Cambrian dolomites and quartzites. The west tributary glaciers have eroded Middle Proterozoic quartzites, marbles, phyllites and schists (Birkenmajer, Reference Birkenmajer1990; Ohta and Dallmann, Reference Ohta and Dallmann1999). In 1979–2018, mean annual air temperature and precipitation measured at the nearby Polish Polar Station were −3.7°C and 235 mm with increase trends of +1.14°C and +61.6 mm per decade (Wawrzyniak and Osuch, Reference Wawrzyniak and Osuch2019, Reference Wawrzyniak and Osuch2020).
Similar to other glaciers in Hornsund, the first maps of the Hansbreen frontal position were based on surveys by the Austro-Hungarian (1872–1874) and Swedish-Russian expeditions (1899–1902) (Peterman, Reference Peterman1874; Wassiliew, Reference Wassiliew1925). At this time, Hansbreen occupied Hansbukta, the Baranowski Peninsula (Baranowskiodden), part of Isbjørnhamna, Oseanograftangen and raised marine terraces at the foot of Fugleberget and Fannytoppen. The geomorphology of the forefield was investigated by Birkenmajer (Reference Birkenmajer1960), Karczewski and others (Reference Karczewski1984), Pękala (Reference Pękala1989), Lindner and others (Reference Lindner, Marks and Szczęsny1992), Rachlewicz and Szczuciński (Reference Rachlewicz and Szczuciński2000). Since that time, there have been no new studies of the entire terrestrial forefield. The submarine geomorphology of Hansbukta was outlined by Jania (Reference Jania1988, Reference Jania and Kostrzewski1998) and Tegowski and others (Reference Tegowski, Trzcinska, Kasprzak and Nowak2016), and described in detail by Ćwiąkała and others (Reference Ćwiąkała2018).
Materials and methods
We mapped the terrestrial forefield by combining field investigations with remote sensing data, as recommended by Chandler and others (Reference Chandler2018). Field observations were carried out in 2021–2023 with detailed mapping in August 2022. Our map is based on a very high-resolution orthophotomosaic and DEM generated and published by Błaszczyk and others (Reference Błaszczyk, Laska, Sivertsen and Jawak2022) from aerial photos acquired on 22 June 2020 using a Dornier DO228 aircraft. The resolution of the orthophotomosaic and the DEM are 0.0843 and 0.169 m, with a maximal vertical DEM error of 0.54 m. Mapping of the submarine forefield was based on two datasets of bathymetric data. We mapped most of the forefield using a high-resolution DEM (1 m) based on multibeam bathymetric data from the Norwegian Hydrographic Service collected in 2008 (The Norwegian Mapping Authority, Kartverket). This dataset was used in the previous geomorphological studies of Hansbukta (Tegowski and others, Reference Tegowski, Trzcinska, Kasprzak and Nowak2016; Ćwiąkała and others, Reference Ćwiąkała2018). In addition, we used a DEM generated by Błaszczyk and others (Reference Błaszczyk2021) from multiple data sources to map the areas not surveyed in 2008. The DEM was based on measurements from a small boat using a Norbit Wideband Multibeam Sonar with a positioning system (2014, 2016, 2017) and data collected from a small boat with a single beam echosounder Lowrance HDS5 with positioning (2015). The assessed accuracy of these bathymetric data was ±5 m (Błaszczyk and others, Reference Błaszczyk2021). We mapped the landforms in QGIS using the WGS84/UTM33N spatial reference system. Some small areas of the forefields were not covered by the bathymetry data or the orthophotomap and a small part of the seafloor with a surveyed topography remained unclassified in the geomorphological map (Figs 2 and 3). Changes in the frontal position of Hansbreen were taken from supplementary data to Błaszczyk and others (Reference Błaszczyk, Jania and Kolondra2013, Reference Błaszczyk2021) and vectorized from Sentinel-2 images in natural colour compositions for the period 2016–2018.
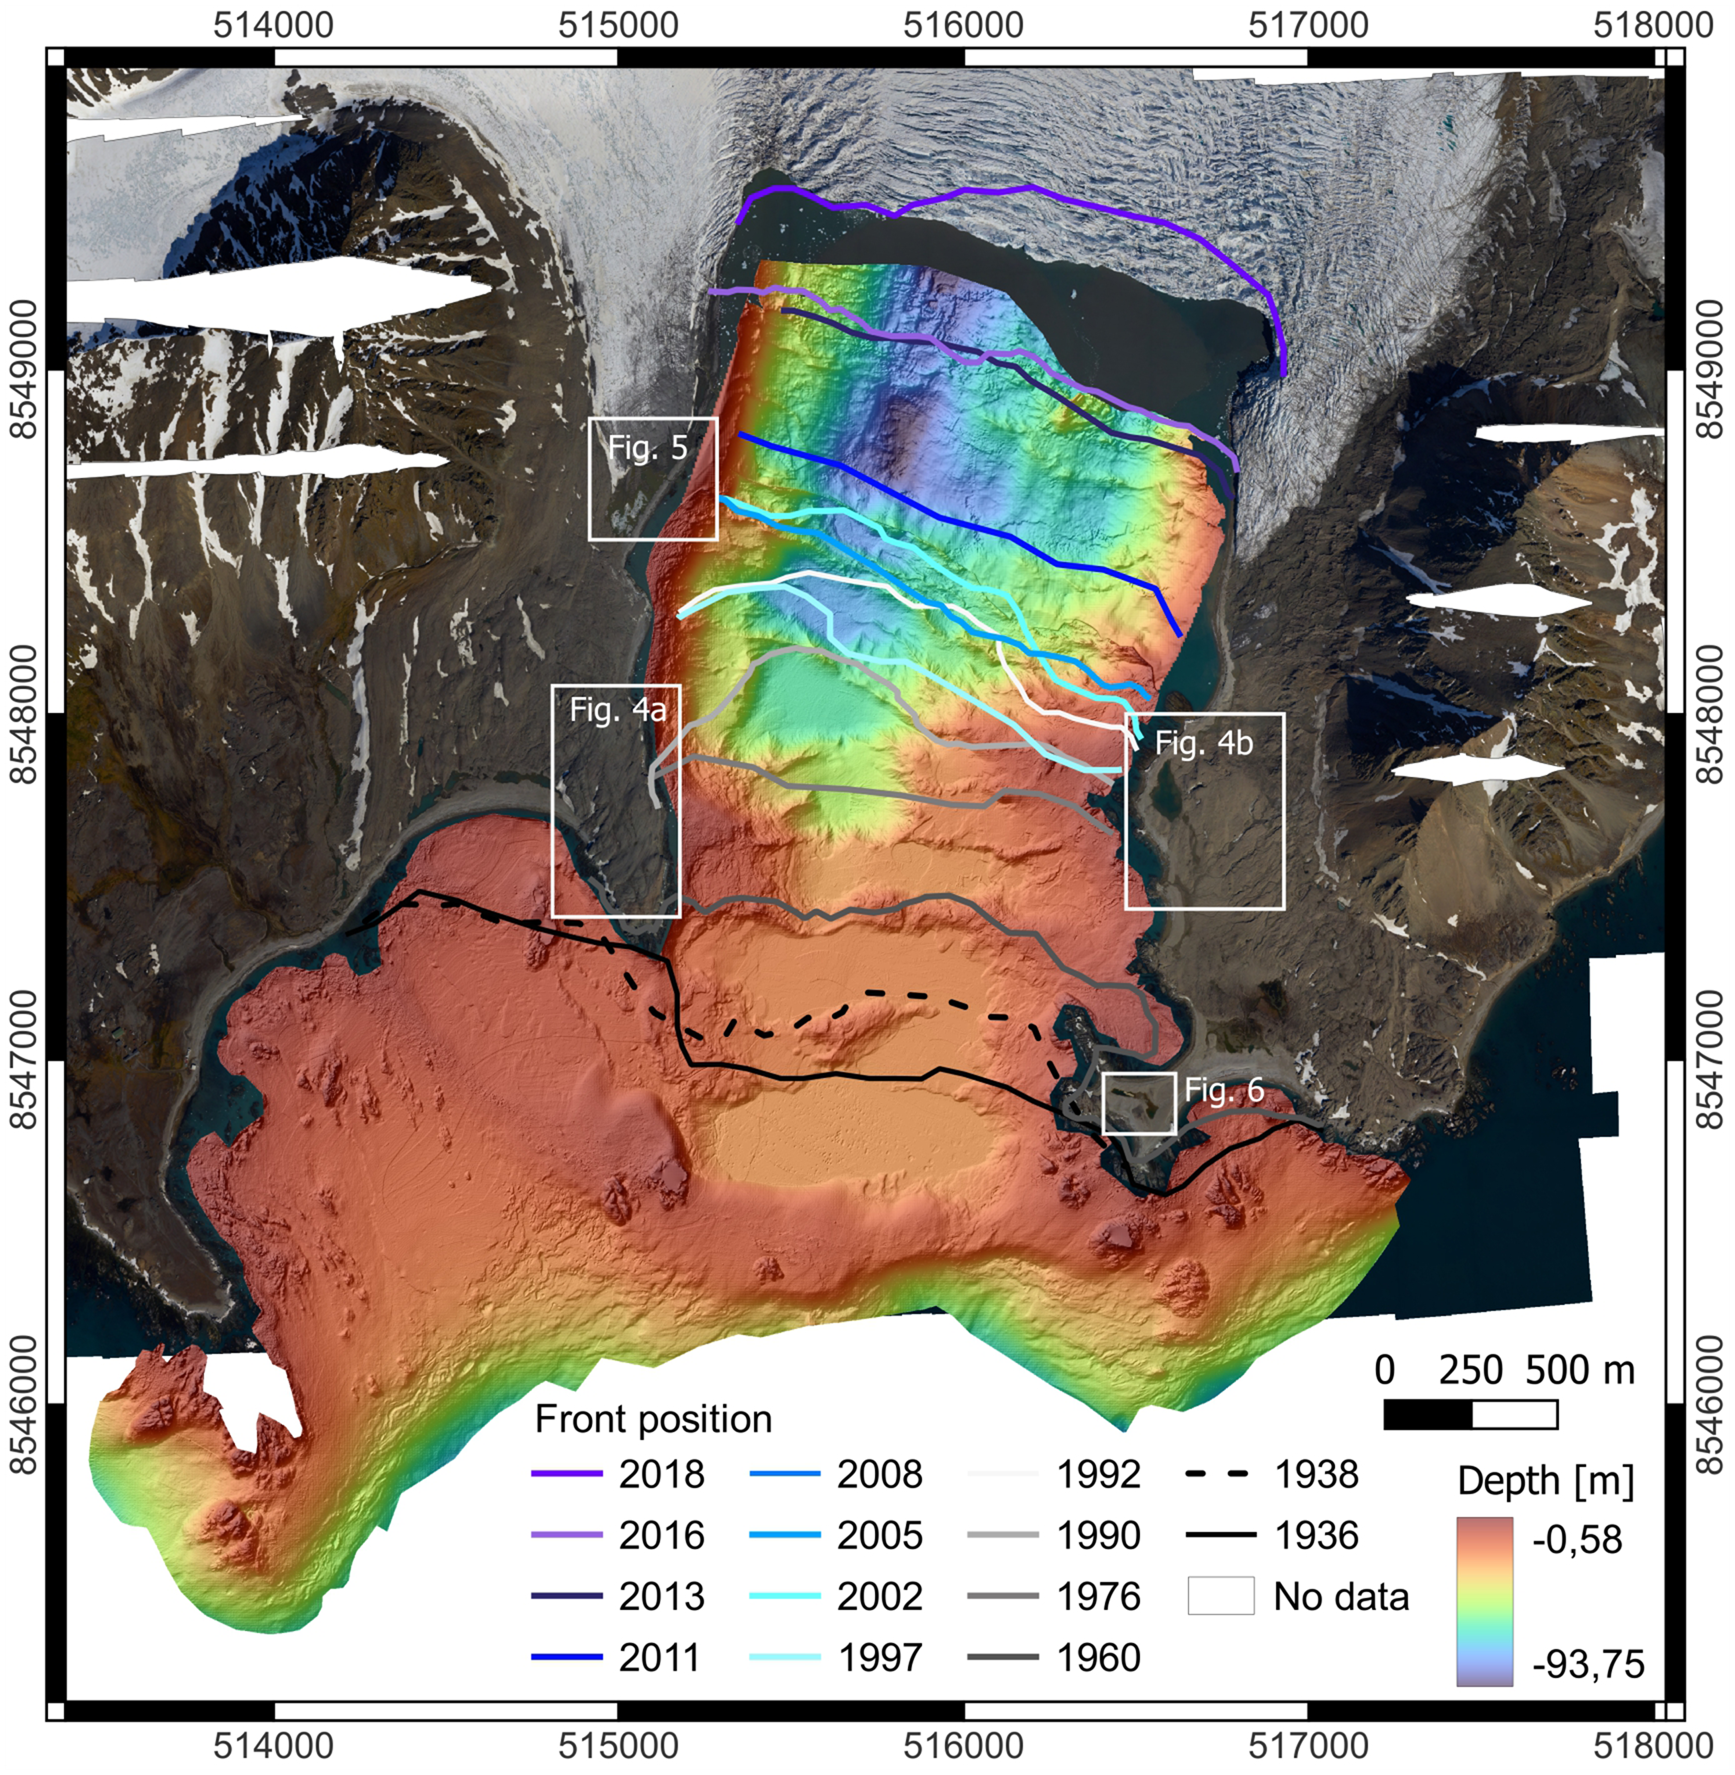
Figure 2. Hansbreen and its forefield. Orthophotomap from June 2020 after Błaszczyk and others (Reference Błaszczyk, Laska, Sivertsen and Jawak2022) and bathymetric map based on the Norwegian Hydrographic Service multibeam data (2008) combined with bathymetric data (2014–2017) after Błaszczyk and others (Reference Błaszczyk2021) were used to produce the geomorphological map (Fig. 3). Changes in the frontal position of Hansbreen after Błaszczyk and others (Reference Błaszczyk, Jania and Kolondra2013, Reference Błaszczyk2021), Sentinel-2A from 2 August 2016 and 18 September 2018, and Jania (Reference Jania1988). The dashed line marks the glacier extent in 1938 based on terraphotogrammetric measurements conducted by Pillewizer (Reference Pillewizer1939).
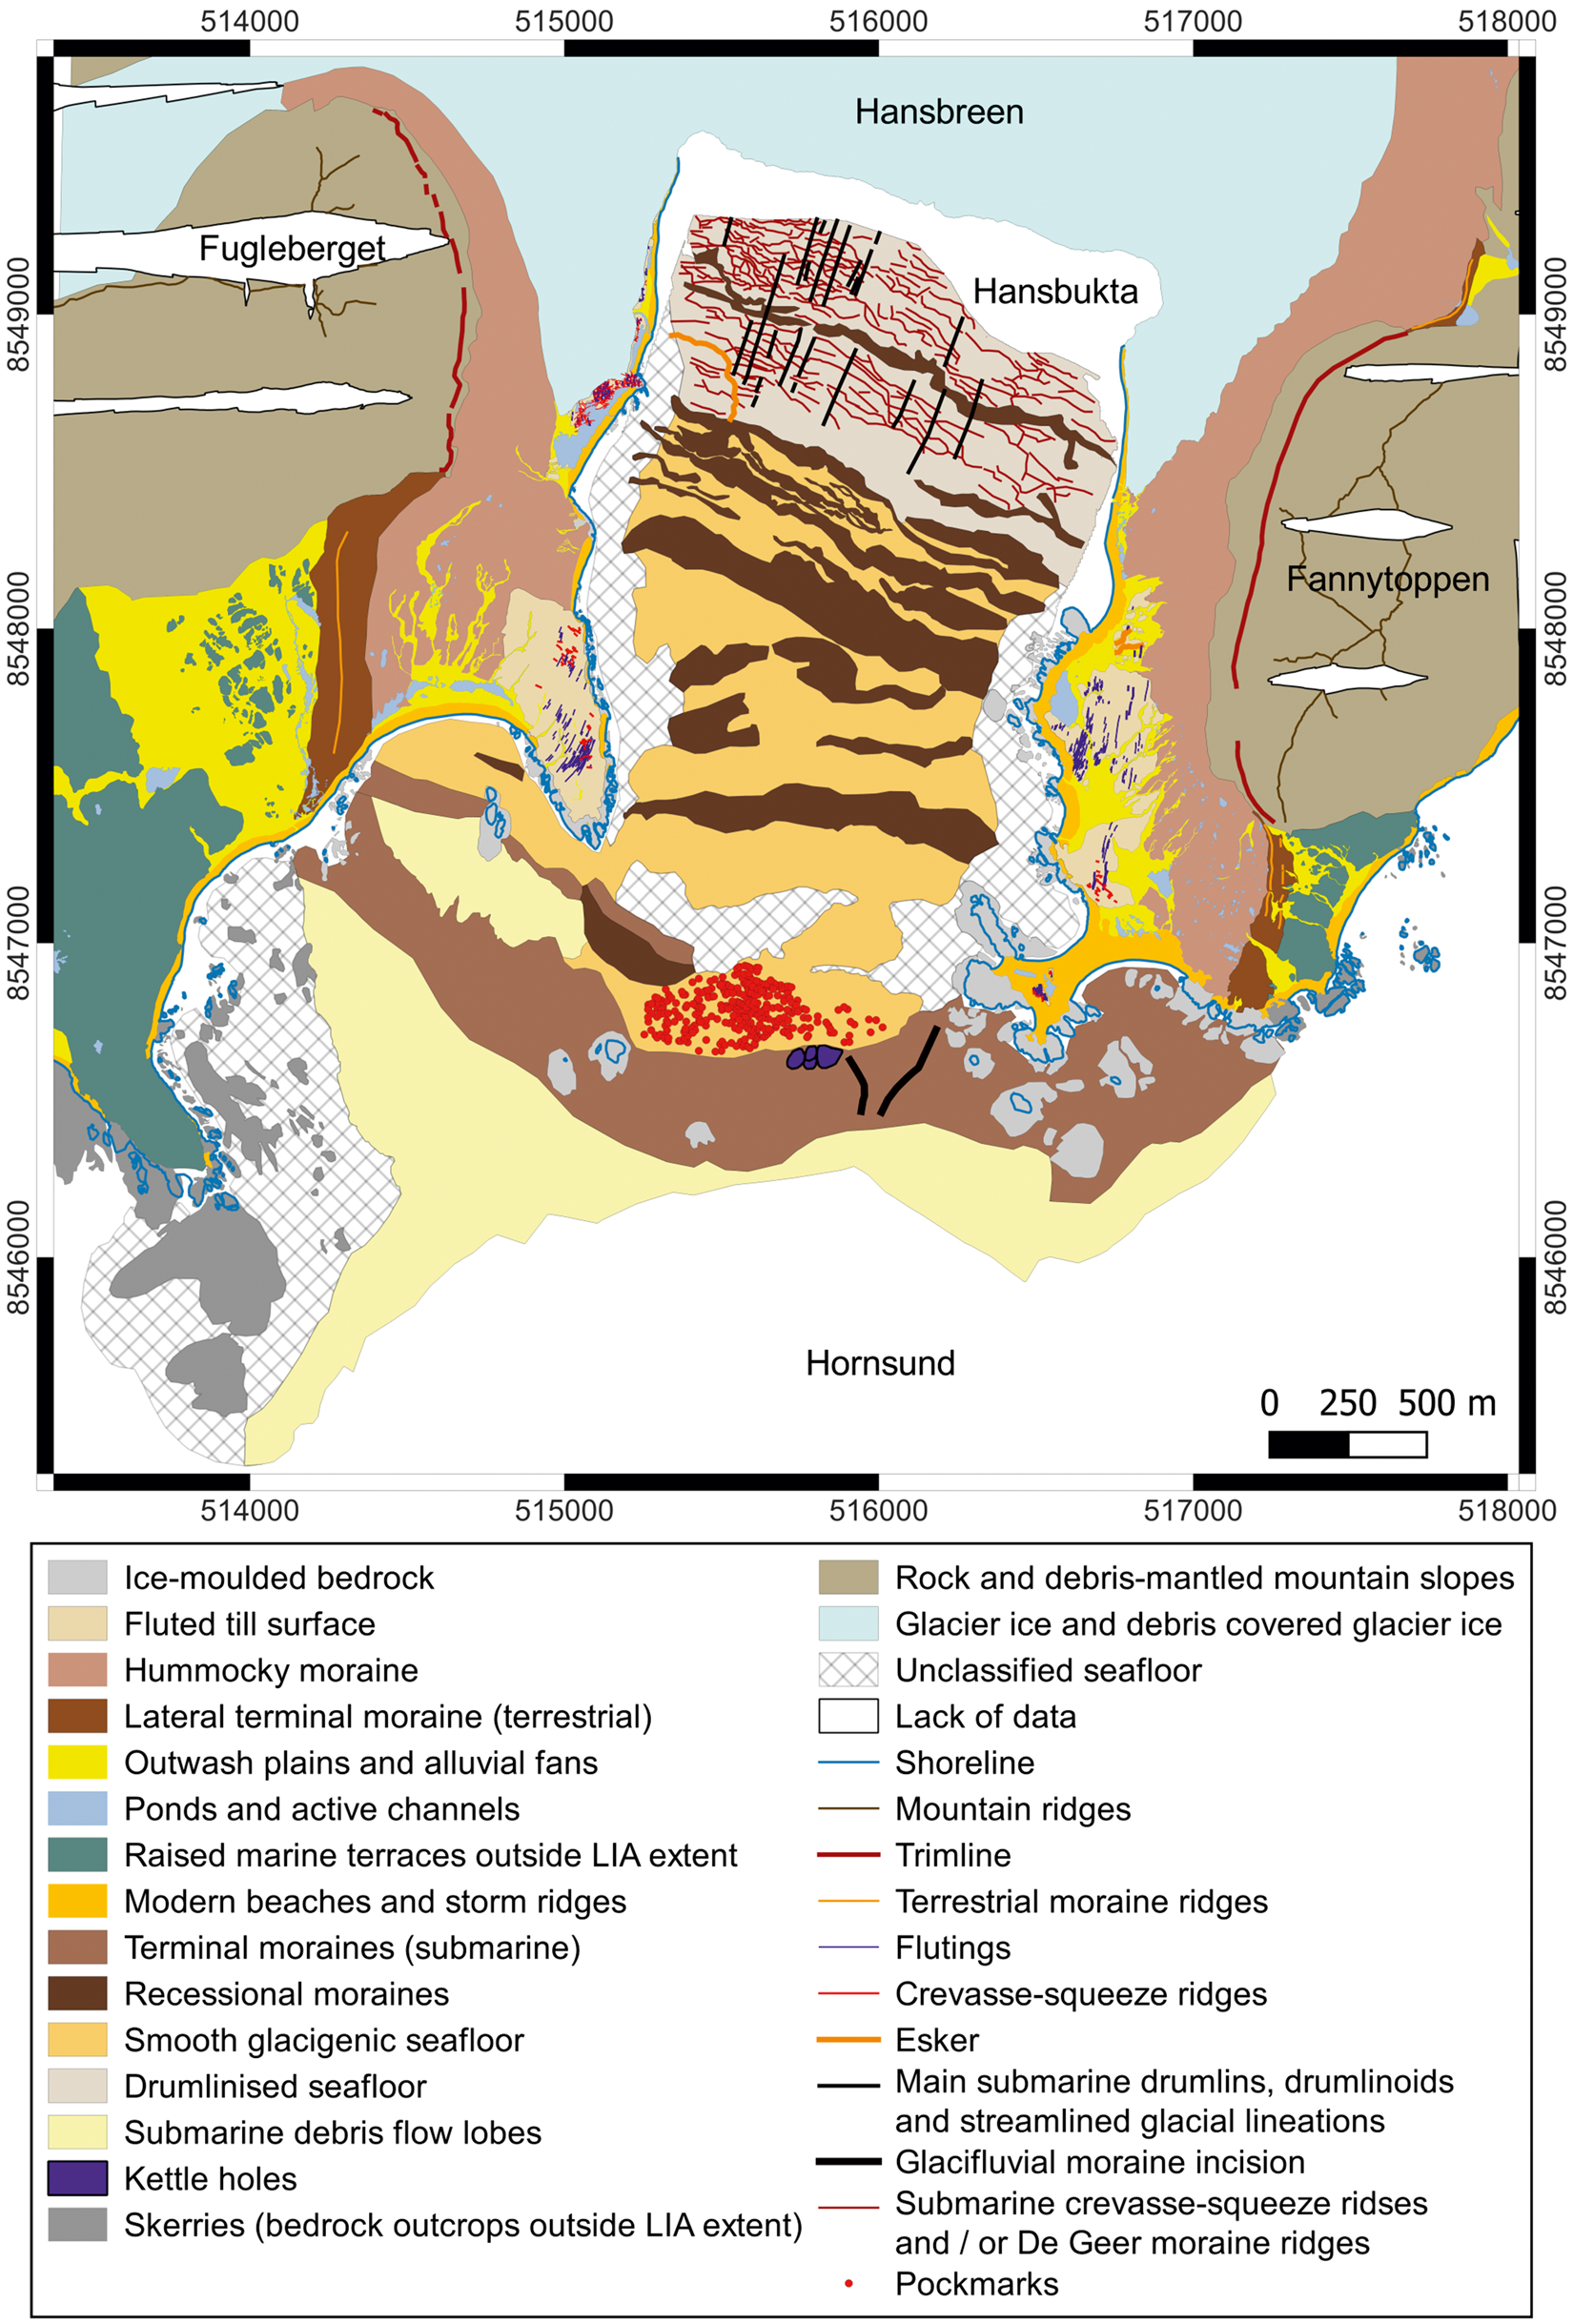
Figure 3. Geomorphological map of the forefield of Hansbreen. Glacier extent on 22 June 2020.
To characterize the changing glacier and its forefield over time, we used historical maps and photographs from 1872 (Austro-Hungarian North Pole expedition, Peterman, Reference Peterman1874), a map from 1899 (Swedish-Russian Arc-of-Meridian Expedition, Wassiliew, Reference Wassiliew1925), a map and archival photographs from the Norwegian expedition to Spitsbergen in 1918 (Hoel, Reference Hoel1929), oblique aerial photographs from 1936 by the Norwegian Polar Institute and the orthophotomap from these data (Geyman and others, Reference Geyman, van Pelt, Maloof, Aas and Kohler2022), terrophotogrammetric documentation of the Hansbreen forefield in 1982–1996 from the archives of the University of Silesia (Jania and Kolondra, Reference Jania and Kolondra1982) and the orthophotomap based on vertical aerial photographs from 2011 by the Norwegian Polar Institute, available in the TopoSvalbard online archive (https://toposvalbard.npolar.no/). The historical photographs from 1872 were acquired from the Austrian National Library Digital Image Archive (https://onb.digital/) and from 1918 from the digital image archive of the Norwegian Polar Institute (https://bildearkiv.npolar.no/fotoweb/). The purpose of the historical data was to help interpret the formation of landforms and to assess past glacier frontal positions and any geomorphological or glaciological evidence for surging. As the surge criteria, we considered (1) looped moraines, (2) deformed ice structures, (3) heavy surface crevassing, (4) a surge bulge and (5) shear margins on the glacier surface (Lefauconnier and Hagen, Reference Lefauconnier and Hagen1991; Copland and others, Reference Copland, Sharp and Dowdeswell2003; Grant and others, Reference Grant, Stokes and Evans2009).
Hansbreen surging glacier landsystem
Glacial and glacifluvial landforms are classified according to their origin and morphological features and presented in the context of their associations (subglacial, supraglacial, ice-marginal, proglacial, glacimarine). We describe the terrestrial and submarine marginal zones separately to highlight the similarities and contrasts between landform assemblages in different environments.
Glacier ice and debris covered glacier ice
The main tongue of Hansbreen is densely crevassed at the active calving front, and similarly crevassed at the confluence zone between Tuvbreen and the main trunk (Figs 1 and 2). The dominant crevasse pattern is transverse with additional sigmoidal crevasses near the confluence zone. A dense network of crevasses with different orientations and crevasse traces (healed crevasses) can be observed in the eastern lateral zone of Hansbreen, including the land-terminating part, which transitions into the ice-cored hummocky moraine. The extensively crevassed central and eastern parts of Hansbreen contrast with the almost uncrevassed surfaces of Tuvbreen and Fuglebreen, which are dominated by crevasse traces and exhibit a few supraglacial streams and moulins.
Two medial moraines can be traced on the western part of the glacier (Figs 1 and 2). The medial moraine between the main trunk of Hansbreen and Tuvbreen takes the form of a wide belt of highly dispersed debris a few centimetres thick, with fine clasts of metamorphic rocks from the nunatak Tuva. Snow patches partially mask a scattered medial moraine between Tuvbreen and Fuglebreen composed of fine-grained, homogeneous debris sourced from the metamorphic rocks of the Vesletuva mountain. We interpret the former as an ice-stream interaction medial moraine and the latter as an ablation-dominant moraine.
Terrestrial forefield
Ice-moulded bedrock: Ice-moulded bedrock is exposed on abundant glacially eroded skerries and capes in Hansbukta and Isbjørnhamna, which often take the form of roches moutonnées (Fig. 3). The most prominent of these features is the Baranowski Peninsula, which is covered by a thin, discontinuous layer of fluted till with numerous bedrock outcrops of amphibolites. The surface of the peninsula is streamlined with minor roches moutonnées and rock drumlins (Fig. 4a). Similarly, streamlined bedrock with a fluted till surface occurs at the foot of Fannytoppen, across Hansbukta from the Baranowski Peninsula (Fig. 4b). A large, 9.5 m high roche moutonné, partially draped with a thin layer of fluted till is located in the north-western forefield near the glacier terminus (Figs 5a and c). In the south-eastern forefield, ice-moulded bedrock is also represented by glacio-isostatically uplifted marine abrasive terraces and sea stacks covered with till.
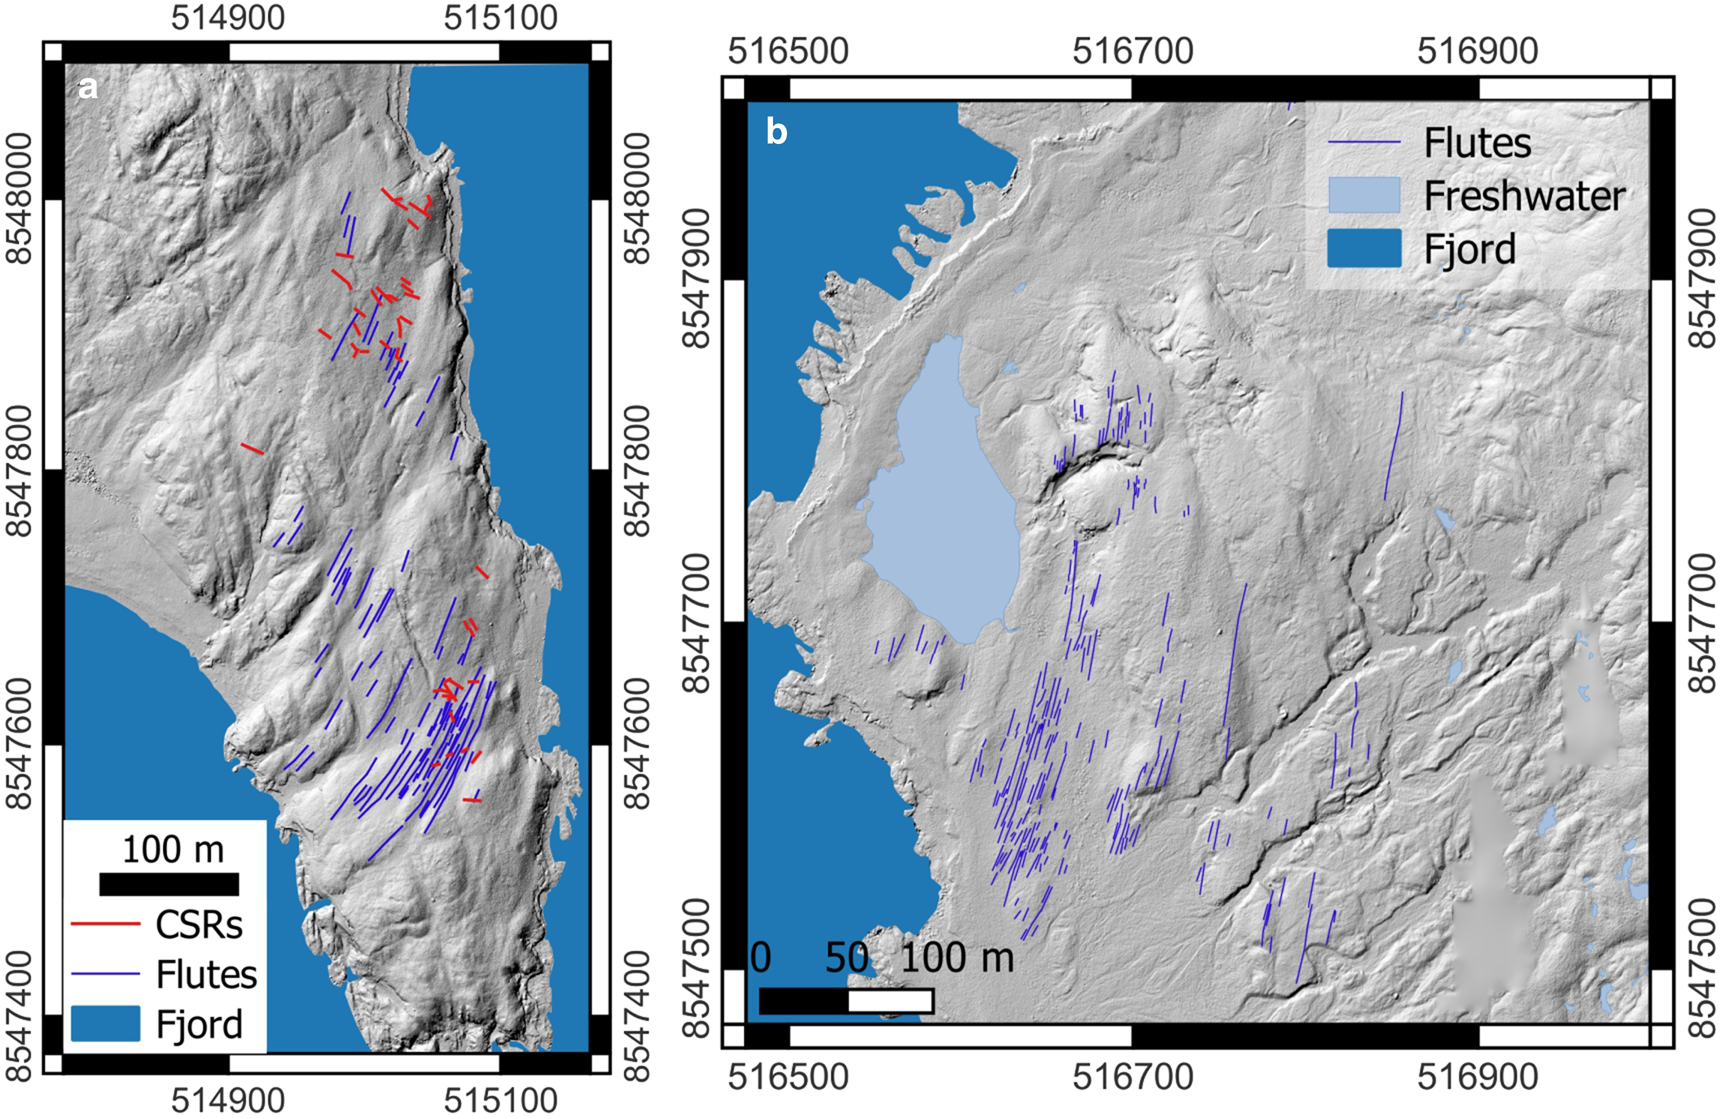
Figure 4. Streamlined topography of (a) the Baranowski Peninsula and (b) at the foot of Fannytoppen with parallel-sided flutings on a thin layer of till. Note CSRs transverse and oblique to flutes on the Baranowski Peninsula. Shaded relief maps after Błaszczyk and others (Reference Błaszczyk, Laska, Sivertsen and Jawak2022).
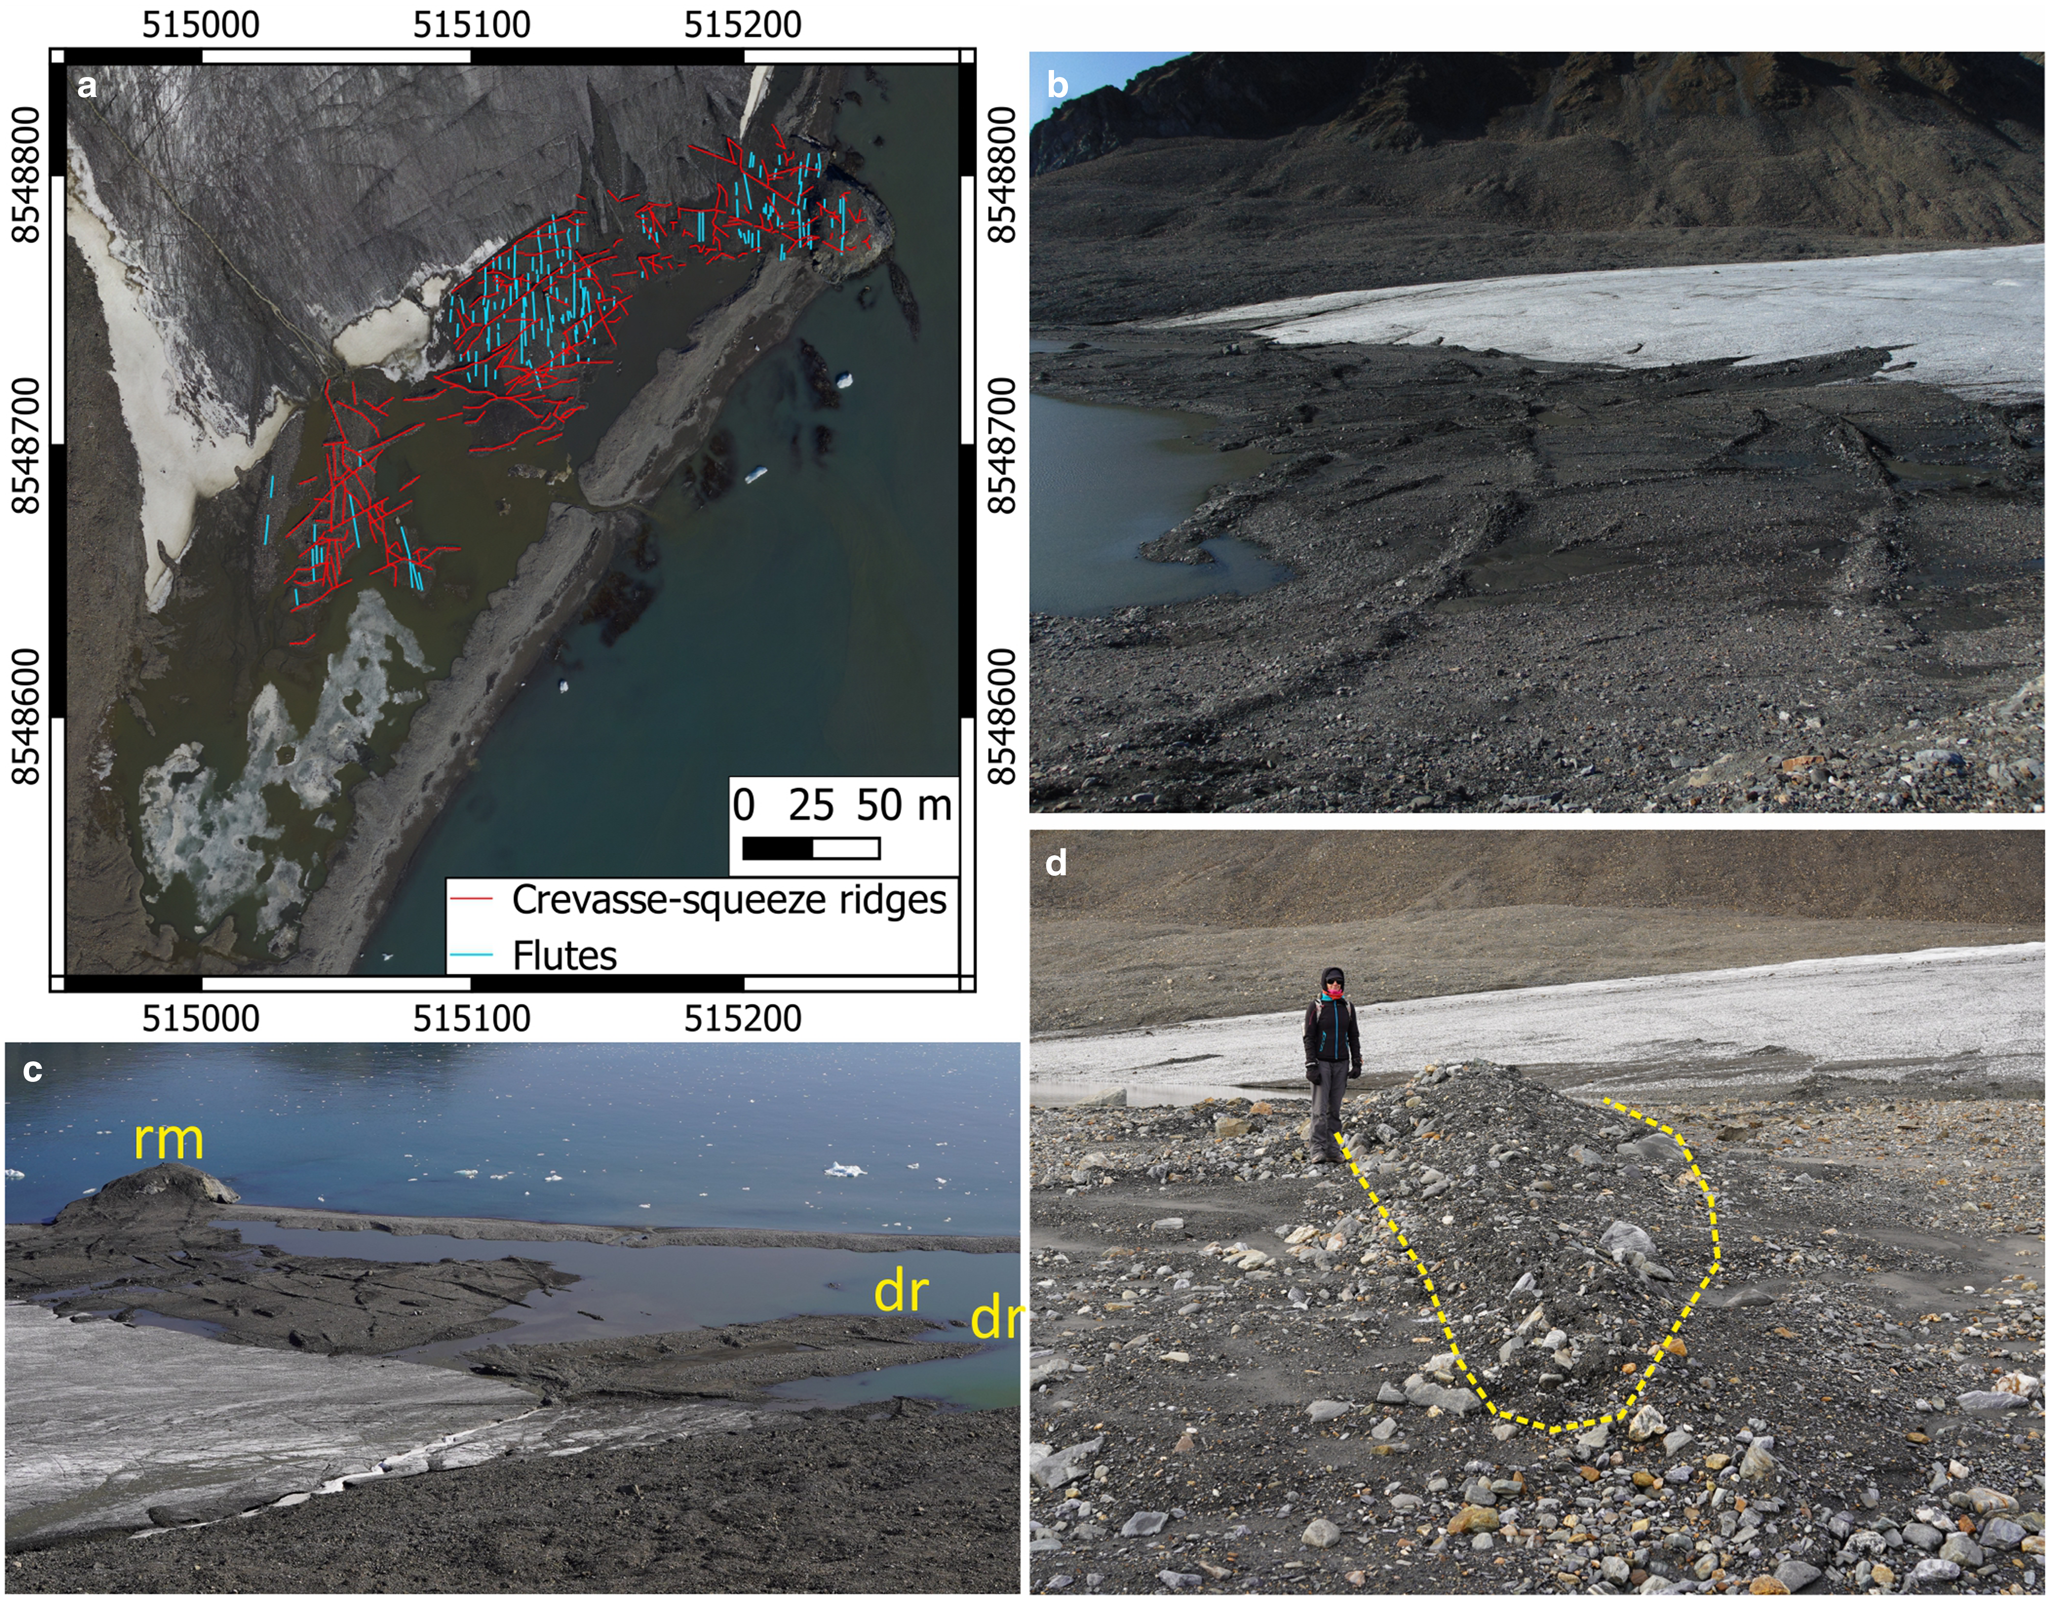
Figure 5. Fluted till surface with CSRs at the foot of Fugleberget in the north-western part of the forefield. (a) Overview of the flutings and CSRs networks on the orthophotomap from 2020 (Błaszczyk and others, Reference Błaszczyk, Laska, Sivertsen and Jawak2022). (b) Flutings and CSRs emerging from downwasting glacier ice in August 2020. Hummocky moraine and trimline on the Fugleberget slopes in the background. (c) The same area in September 2023. Note two drumlins (dr) and a roche moutonné (rm) overprinted with flutings and well-developed CSRs. (d) A prominent CSR c. 0.8 m high with the extent marked with the dashed line. (b–d) Photos A. Osika.
Fluted till surface: Ice-moulded bedrock is strewn with a thin layer of coarse-grained, matrix-supported diamicton interpreted as subglacial traction till and a discontinuous layer of supraglacial diamicton of subglacial origin with similar properties (Skolasińska and others, Reference Skolasińska, Rachlewicz and Szczuciński2016). The clasts are sub-angular to sub-rounded, ranging from gravels to boulders up to 2 m in diameter. The total thickness of diamictons is usually less than 0.5–1 m (Rachlewicz and Szczuciński, Reference Rachlewicz and Szczuciński2000).
The till surface is densely fluted, except in areas reworked by meltwater streams, where only the most prominent flutes can be recognized. Flutes are low, flow-parallel ridges composed of till similar to the till plain, but with significantly smaller clasts. Their formation is connected with infilling of till into a subglacial cavity in the lee-side of a boulder (e.g. Boulton, Reference Boulton1976; Benn, Reference Benn1994; Ives and Iverson, Reference Ives and Iverson2019). Flutings concentrate in four spatial clusters: (1) the streamlined topography of the Baranowski Peninsula (Fig. 4), (2) the recently exposed north-western part of the forefield, at the foot of Fugleberget (Fig. 5), (3) raised marine terraces at the foot of Fannytoppen (Fig. 4) and (4) remnants of till plain on Oseanograftangen (Fig. 6). Most of the flutings are parallel-sided and up to 84 m long with nearly constant width between 0.3 and 2.4 m and height below 0.3 m, commonly with a boulder lodged on the stoss-side of the flute. There is a second group of short tapering flutes up to 14 m long, with boulders embedded at their heads and decreasing width and height in a downstream direction. The assemblages of long flutings associated with CSRs, which can be observed in the Hansbreen forefield, are vital components of the surging glacier landsystems (e.g. Evans and Rea, Reference Evans and Rea1999, Reference Evans, Rea and Evans2003; Christoffersen and others, Reference Christoffersen, Piotrowski and Larsen2005; Benn and Evans, Reference Benn and Evans2010; Aradóttir and others, Reference Aradóttir2019; Ives and Iverson, Reference Ives and Iverson2019).
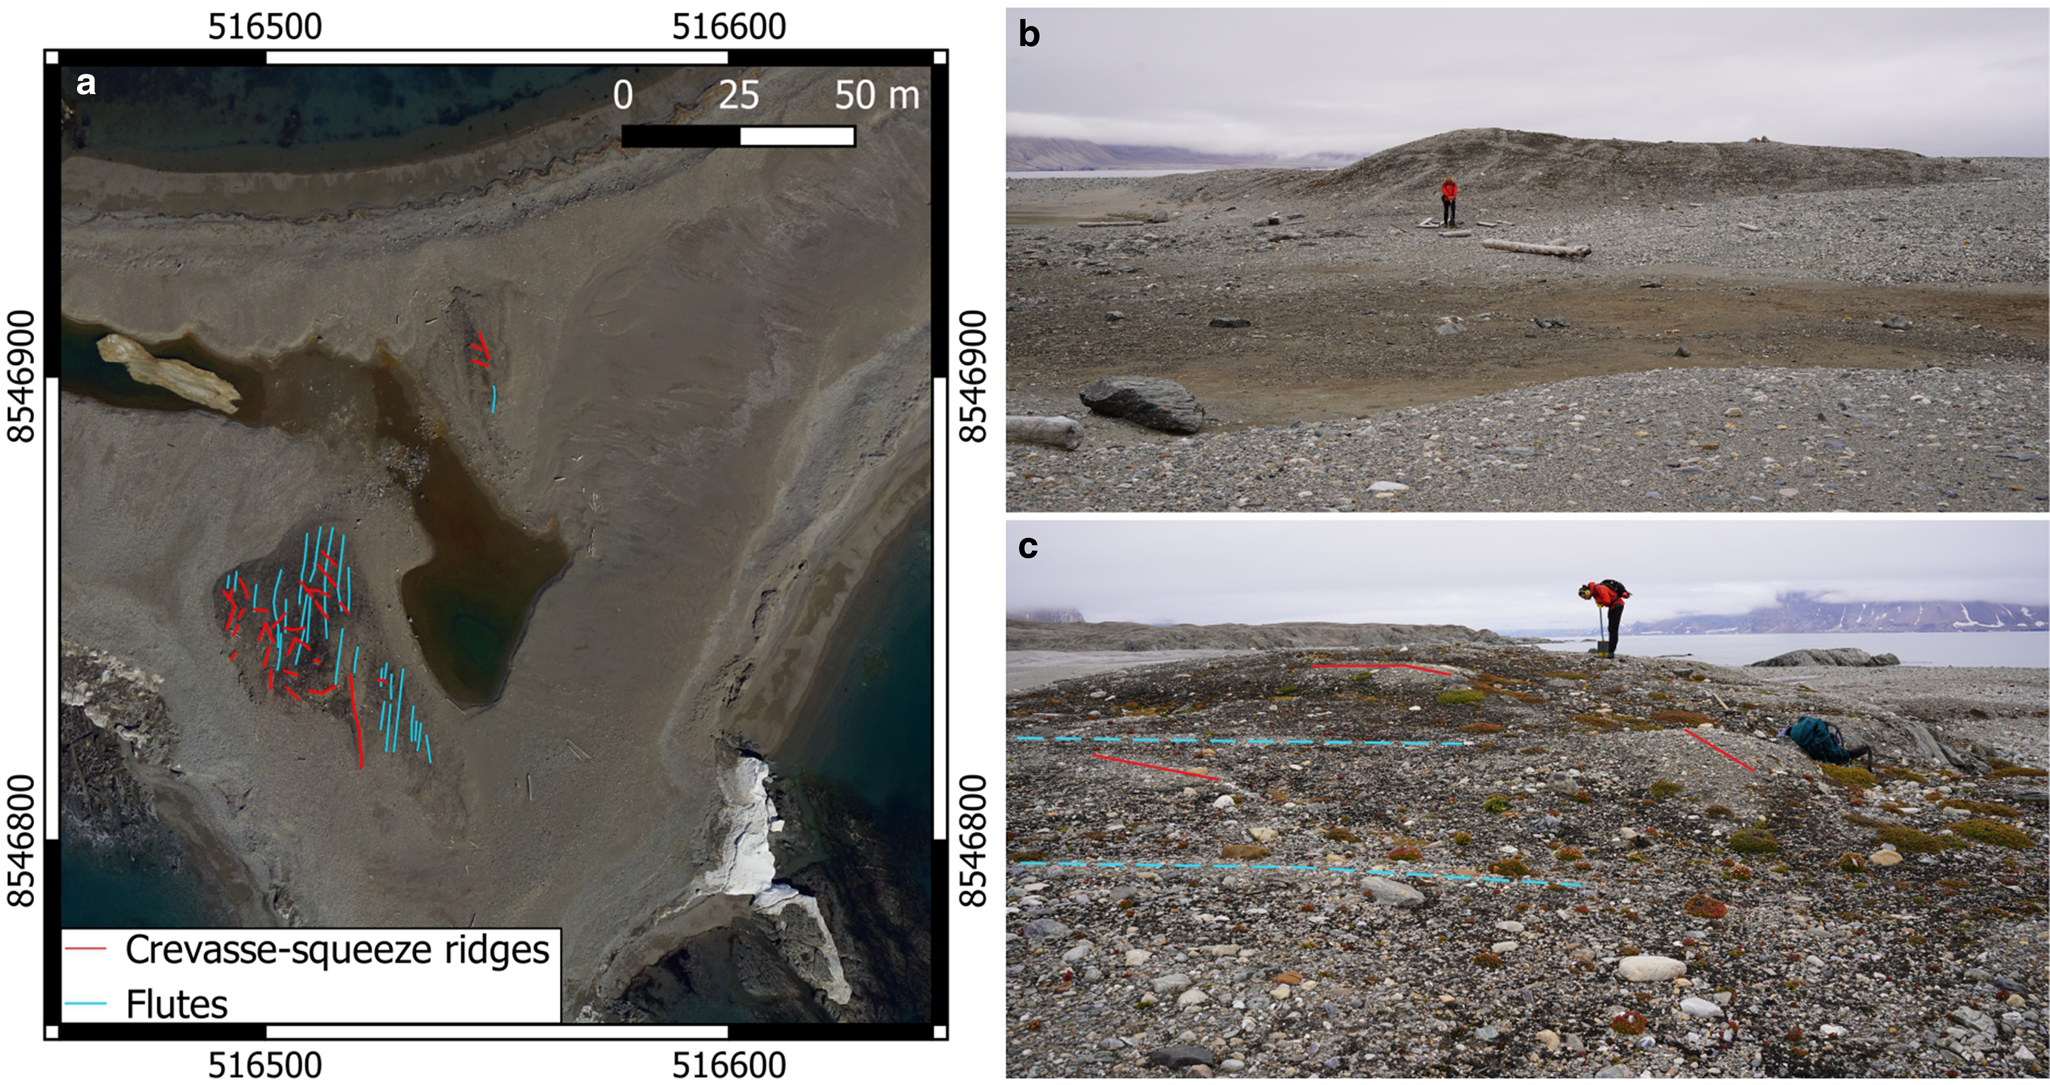
Figure 6. (a, b) Roches moutonnées on Oseanograftangen overprinted with fluted till and CSRs. Note the extensive beaches and storm ridges around the hills and remaining of the plain south of the lake, indicating the flutes and CSRs reworking by coastal processes. (c) Levelled flutes (parallel; blue lines) and CSRs (oblique and transverse; red lines). The latter take the form of low ridges (0.3–0.5 m) or diamicton trails a few centimetres high.
Crevasse-squeeze ridges (CSRs): Low, diamicton ridges oriented transverse or oblique to ice-flow direction and superimposed on flutes are interpreted as CSRs. CSRs are composed of the same till as flutings and their formation involves till infilling of basal crevasses that have opened during a surge and subsequent emergence of ridges from stagnating ice during the quiescent phase (e.g. Boulton and others, Reference Boulton1996; Rea and Evans, Reference Rea and Evans2011; Farnsworth and others, Reference Farnsworth, Ingólfsson, Retelle and Schomacker2016; Ben-Yehoshua and others, Reference Ben-Yehoshua, Aradóttir, Farnsworth, Benediktsson and Ingólfsson2023). The landforms are a key characteristic of the geomorphological record produced by surging glaciers and have been reported in the forefields of numerous glaciers in Svalbard with both confirmed and undocumented surge histories (e.g. Heintz, Reference Heintz1953; Boulton and others, Reference Boulton1996; Glasser and others, Reference Glasser, Hambrey, Crawford, Bennett and Huddart1998; Ottesen and Dowdeswell, Reference Ottesen and Dowdeswell2006; Farnsworth and others, Reference Farnsworth, Ingólfsson, Retelle and Schomacker2016; Ottesen and others, Reference Ottesen, Dowdeswell, Bellec and Bjarnadóttir2017; Flink and Noormets, Reference Flink and Noormets2018; Aradóttir and others, Reference Aradóttir2019). The morphology of CSRs in the forefield of Hansbreen ranges from distinct, intersecting ridges c. 0.5 m high to remnants of ridges or mounds and sediment trails reflecting the characteristic criss-cross pattern of CSRs. A network of well-defined cross-cutting ridges c. 0.5 m high, up to 3.5 m wide and up to 50 m long that overlay dense flutes can be seen emerging from the downwasting glacier snout in the northwestern part of the forefield (Fig. 5). The most prominent ridges approach the height of 0.8 m (Fig. 5d). In contrast, CSRs on the Baranowski Peninsula appear as indistinct ridges in the field and are best identified on the orthophotomaps. However, in the 1980s they were visible as abundant, distinct diamicton ridges transverse or oblique to underlying flutes (Fig. 7). In the eastern forefield, CSRs occur less frequently and are mostly individual diamicton ridges and mounds 6–40 m long and 0.3–0.5 m high overprinted on highly degraded flutes (Figs 6 and 8). The ridges are located among numerous cross-cutting diamicton trails a few centimetres high, which mimic the networks of CSRs and flutings. Similar features interpreted as the remains of CSRs were described in western Svalbard by Ben-Yehoshua and others (Reference Ben-Yehoshua, Aradóttir, Farnsworth, Benediktsson and Ingólfsson2023). In the southernmost forefield, transverse and oblique CSRs are superimposed on fluted till draped on two roches moutonnées (Fig. 6). Their morphology ranges from distinct, short ridges and mounds approaching 0.3–0.5 m in height, to degraded, intersecting ridges a few centimetres high taking the form of diamicton trails.
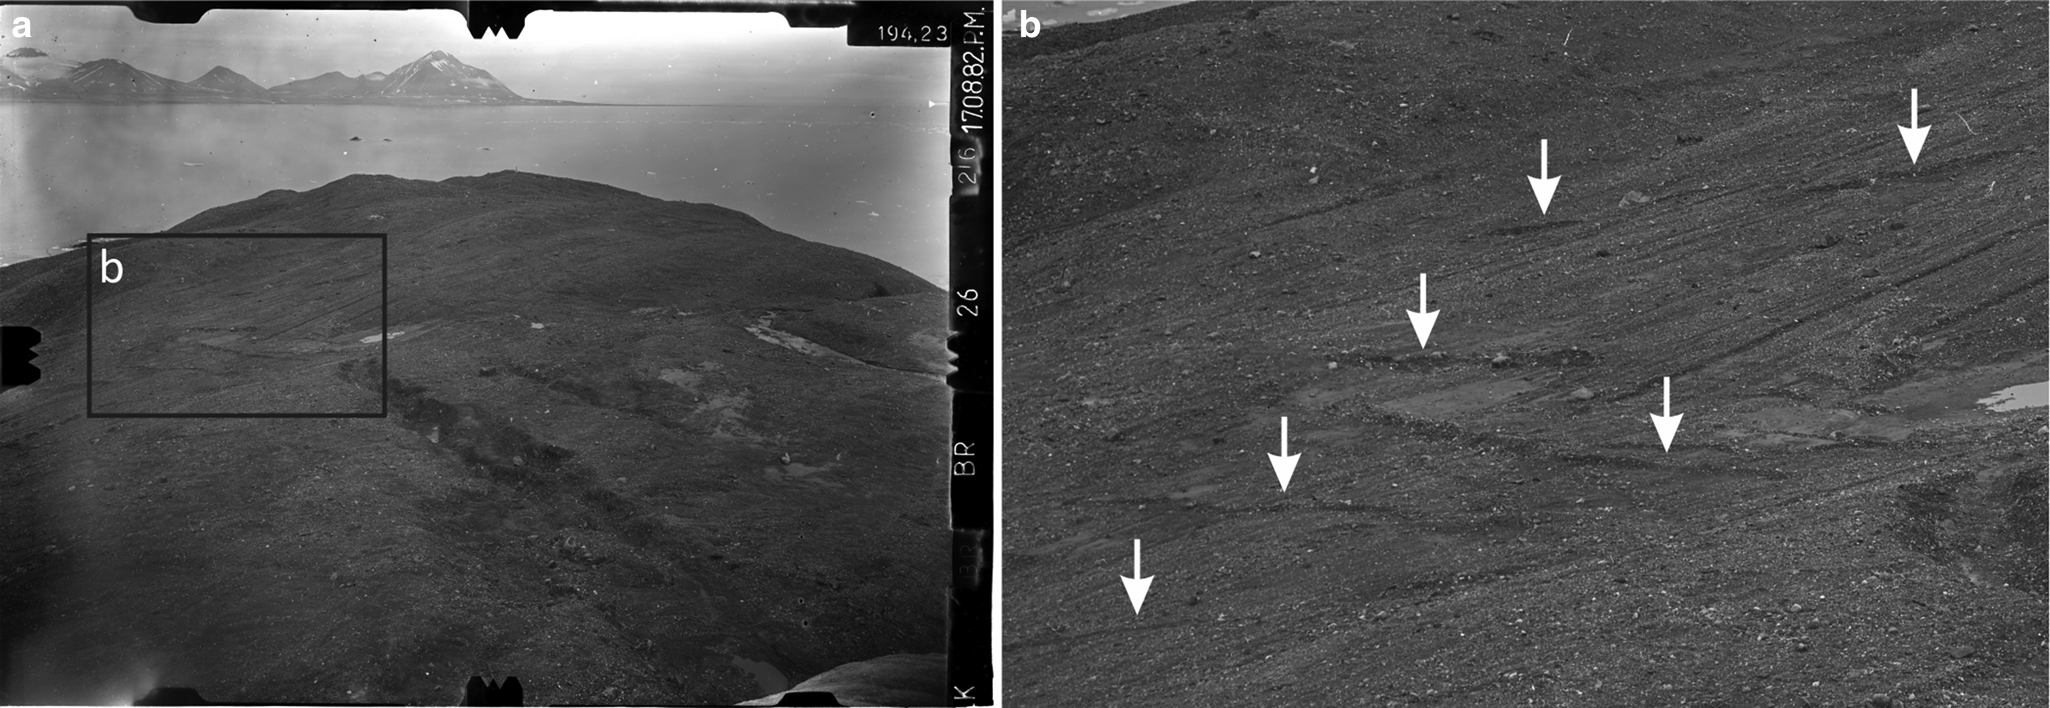
Figure 7. (a, b) Terrestrial photogrammetric photograph of the Baranowski Peninsula from 1982. Note long, parallel-sided flutings and low CSRs (white arrows) oblique and transverse to the flutes. Today, CSRs in this site are sparse and have an indistinct appearance in the field.
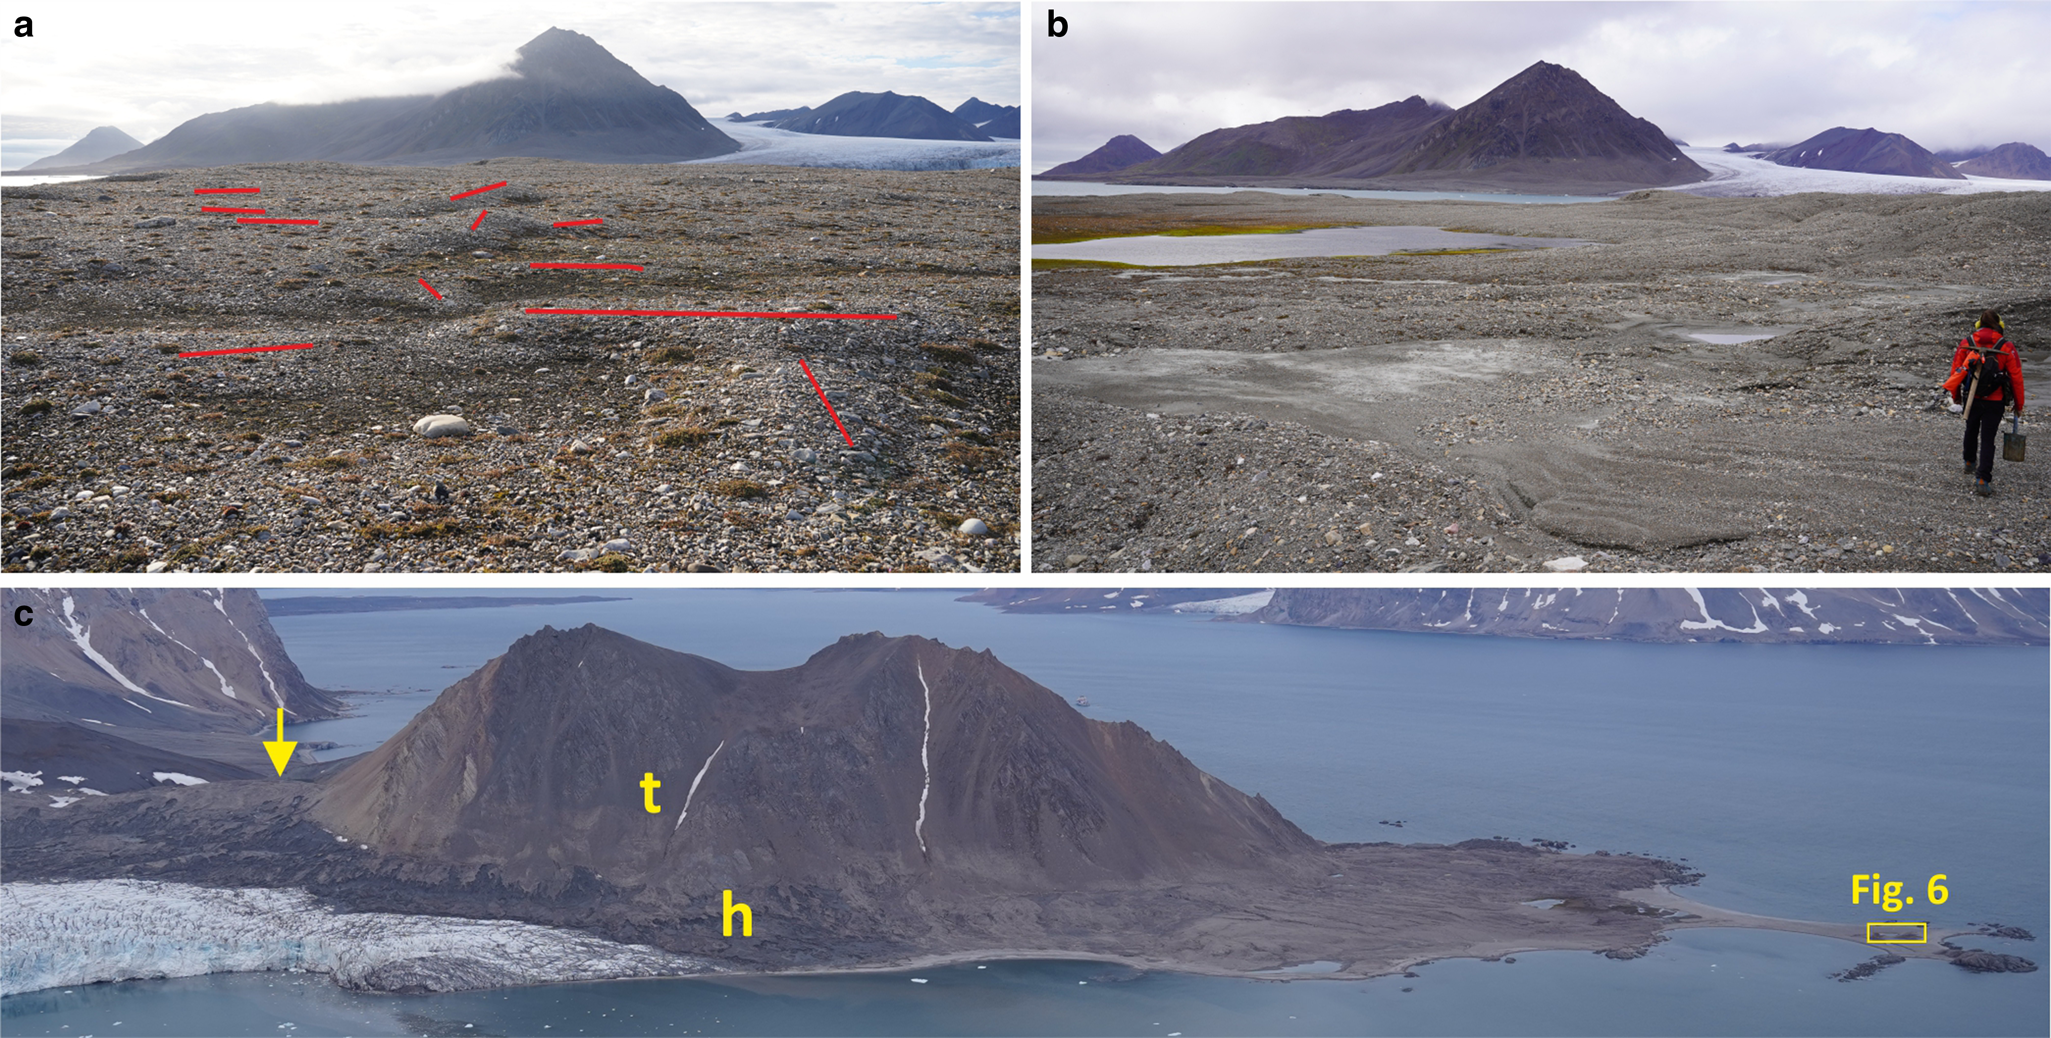
Figure 8. (a) Low, obliterated CSRs c. 0.3–0.5 m high among sediment trails reflecting the cross-cutting pattern of CSRs and flutings at the foot of Fannytoppen. (b) Ice-cored hummocky moraine in this area. In the background, hummocky moraine and trimline on the slopes of Fugleberget. (c) Hummocky moraine (h) and trimline (t) on the Fannytoppen slopes. The arrow marks the lateral terminal moraine and the rectangle illustrates the location of the roches moutonnées with CSRs on Oseanograftangen. (a–c) Photos A. Osika.
Eskers: Low, locally eroded sinuous eskers are visible in the eastern forefield on the till plain with fluvial overprinting. The ridges are 70–90 m long, 1–3 m wide, up to 0.5 m high and dissected by meltwater channels. They can be recognized by their surface of compact, sub-angular to rounded clasts ranging from fine gravels to 30 cm boulders with absent finer fractions. Based on their sinuous morphology, we interpret them as landforms developed in stagnant ice during the quiescent phase.
Hummocky moraine: Hummocky moraine occurs on the ice-proximal side of the lateral terminal moraine (Fig. 3). In the western part of the forefield, it takes the form of low, ice-cored, aligned hummocks, depressions and ponds, transitioning to the north into regular, ice-cored, low-amplitude linear ridges, interpreted as controlled moraine (Evans, Reference Evans2009). The formation of hummocky and controlled moraines involves entrainment, transport and melt-out of debris on a stagnant glacier snout, leading to the accumulation of supraglacial debris cover (Boulton, Reference Boulton1968; Rachlewicz and Szczuciński, Reference Rachlewicz and Szczuciński2000; Schomacker and Kjær, Reference Schomacker and Kjær2008; Evans, Reference Evans2009; Ewertowski and others, Reference Ewertowski, Kasprzak, Szuman and Tomczyk2011). In controlled moraine, the supraglacial debris retains distinct linearity reflecting the inherited pattern of englacial debris concentrations (Evans, Reference Evans2009). In the eastern forefield, hummocky moraine occurs as a complex of irregular, partly ice-cored, low-amplitude mounds and depressions at the proximal zone of the lateral terminal moraine (Fig. 8). The second assemblage is a complex of low, recently exposed ice-cored hummocky moraines adjacent to the slopes of Fannytoppen and Flatryggen. The surficial sediments are clast-rich, matrix-supported diamictons with large clasts of metamorphic and sedimentary rocks (Skolasińska and others, Reference Skolasińska, Rachlewicz and Szczuciński2016). Abundant fragments of marine mollusc shells can be found up to the Flatpasset saddle between Fannytoppen and Flatryggen at c. 150 m a.s.l. (Fig. 2). The development of hummocky moraines requires entrainment and transport of large volumes of debris, which is particularly effective and widespread during the active phase of surging (Evans and Rea, Reference Evans and Rea1999; Lovell and others, Reference Lovell2015a). Therefore, they are an important component of the surging glacier landsystems, although they are not independently diagnostic of surge-type behaviour (Evans and Rea, Reference Evans, Rea and Evans2003).
Lateral terminal moraine: The outer, most prominent moraine belts are interpreted as lateral terminal moraines that extend underwater as a frontal terminal moraine (Fig. 3). In the western forefield, the lateral terminal moraine occurs as a conspicuous controlled moraine belt with sub-parallel units reflecting the former englacial structures in the glacier snout (cf. Evans, Reference Evans2009). The outer moraine belt is 1130 m long, up to 200 m wide, 30 m high and ice-cored as evidenced by electrical resistivity tomography (Glazer and others, Reference Glazer, Dobiński, Marciniak, Majdański and Błaszczyk2020), but the internal structure is unknown. The transverse profile is asymmetric with a steeper distal slope. In the south-eastern forefield, the lateral terminal moraine takes the form of two arcuate ridges 570 and 580 m long, 30–50 m wide and up to 8 m high, dissected by proglacial channels. The ridges are probably ice-cored based on the evidence of ongoing de-icing processes. The relief of their southern margins is subdued and resembles the adjacent hummocky moraine. In turn, the lateral terminal moraine on Flatpasset (Fig. 8c) occurs as a distinct, arcuate ridge 420 m long, up to 30 m wide, 6 m high and probably ice-cored. The northern part merges with ice-cored hummocky moraine, whereas the south-western part is associated with a trimline on the adjacent Fannytoppen slope. The lateral terminal moraines are composed of clast-rich diamicton with sub-angular to sub-rounded, and occasionally angular large clasts of metamorphic and sedimentary rocks. We interpret them as the outer and oldest ridges of controlled moraines, formed by debris entrainment during glacier advance and supraglacial melt-out of sediments from stagnating ice, preserving the ice core from degradation (cf. Evans, Reference Evans2009).
Trimline: Trimlines can be traced on the eastern and south-eastern slopes of Fugleberget at 174–70 m a.s.l. and the western slopes of Fannytoppen at 173–32 m a.s.l. (Figs 3 and 8). We interpret them as the maximum thickness of Hansbreen during the surge (cf. Yde and others, Reference Yde2019). The imprint is discontinuous due to paraglacial reworking and formation of talus cones. A gradual elevation decline corresponds to widening and lateral spread-out of the glacier tongue. Well-developed trimlines from the LIA are typical for Svalbard glaciers and their formation and distribution are primarily controlled by bedrock erodibility (Rootes and Clark, Reference Rootes and Clark2022). According to their study, erosional trimlines are slightly more common among surging and tidewater glaciers in Svalbard compared to land-terminating glaciers or glaciers with no known surge history.
Submarine forefield
Drumlinized seafloor and streamlined glacial lineations: The drumlinized seafloor comprises c. 750 m wide zone in the proximal part of the submarine forefield, taking the form of streamlined topography with drumlinoids, low-amplitude streamlined ridges and grooves (Figs 2 and 3). In the central zone, an oval, symmetrical ridge 260 m long and 90 m wide, interpreted as a drumlin, can be observed between a similar ridge with an indistinct appearance and a prominent drumlinoid 190 m wide. In the western part, an assemblage of distinct, flow-parallel, low-amplitude ridges and grooves up to 430 m long can be observed on the slopes of an overdeepening that extends to a depth of 94 m. The ridges are up to 5 m high, 30 m wide and the distance between their crests is usually 40–60 m. We interpret these as streamlined glacial lineations, which indicate high velocities during glacier advance and are a key characteristic of the submarine forefields of tidewater surge-type glaciers in Svalbard (e.g. Flink and others, Reference Flink2015, Reference Flink, Hill, Noormets and Kirchner2018; Dowdeswell and Ottesen, Reference Dowdeswell and Ottesen2016; Ottesen and others, Reference Ottesen, Dowdeswell, Bellec and Bjarnadóttir2017; Streuff and others, Reference Streuff, Cofaigh, Noormets and Lloyd2018). Based on their morphology and elongation ratios, the ridges represent a continuum between elongated drumlins and mega-scale glacial lineation, indicating subglacial streamlining (MSGL; Stokes and Clark, Reference Stokes and Clark2002; Spagnolo and others, Reference Spagnolo2014).
Esker: A single, sinusoidal ridge in the inner part of the forefield, which can be traced to an R channel in the nearby land-terminating part of the glacier is interpreted as an esker, resulting from the infilling of the subglacial conduit with sediments during decreasing meltwater discharge (Ottesen and others, Reference Ottesen2008). The ridge is 390 m long, up to 10 m wide, 2 m high and faces east for the first 185 m before turning south. The distinct morphology of the first segments contrasts with blurred distal part c. 90 m long ending at the recessional moraine. Eskers have been documented in the forefields of many tidewater glaciers in Svalbard and, in the case of surge-type glaciers, inferred to have developed after surge termination (Ottesen and others, Reference Ottesen2008; Dowdeswell and Ottesen, Reference Dowdeswell and Ottesen2016; Flink and others, Reference Flink, Hill, Noormets and Kirchner2018; Noormets and others, Reference Noormets, Flink and Kirchner2021).
Small moraine ridges – CSRs and / or De Geer moraines: Small ridges oriented subparallel to the calving front and overprinting the flow-parallel ridges of streamlined bedforms can be traced across the inner part of Hansbukta. The transverse, locally branching and cross-cutting ridges approach 10–20 m in width and 3 m in height with spacing of 15–50 m. Their spatial pattern and abundance compared with the number of winter glacier advances (Błaszczyk and others, Reference Błaszczyk2021) and the proximity of CSRs in the terrestrial forefield (Fig. 3) imply that the ridges are probably submarine CSRs formed during a surge (e.g. Ottesen and others, Reference Ottesen2008; Dowdeswell and Ottesen, Reference Dowdeswell and Ottesen2016). Based on a similar appearance, some ridges could be De Geer moraines, also known as small annual retreat moraines or push moraines (e.g. Streuff and others, Reference Streuff, Forwick, Szczuciński, Andreassen and Cofaigh2015; Flink and Noormets, Reference Flink and Noormets2018). The formation of De Geer moraines involves the pushing of sediments during seasonal winter advances (Boulton, Reference Boulton1986; Ottesen and Dowdeswell, Reference Ottesen and Dowdeswell2006). The landforms are widespread in the proximal but not visible in the central or outer parts of the forefield, possibly because they have been buried by sediments from meltwater plumes.
Recessional moraines: Several distinct transverse ridges, larger than those described above, can be observed primarily in the central and outer parts of the forefield. The ridges are oriented sub-parallel to the calving front, up to 10–15 m high and partly buried in glacimarine sediments (Ćwiąkała and others, Reference Ćwiąkała2018). In the proximal forefield, a chain of crescent ridges c. 5 m high corresponds to several winter advances to a similar position in 2013–2015. The most conspicuous ridges correspond with glacier advances in 1957–1959, 1973–1977 and during the 1990s (Jania, Reference Jania and Kostrzewski1998; Ćwiąkała and others, Reference Ćwiąkała2018; Błaszczyk and others, Reference Błaszczyk2021). We interpret the ridges as recessional moraines associated with minor readvances interrupting the overall glacier retreat (Robinson and Dowdeswell, Reference Robinson and Dowdeswell2011; Flink and others, Reference Flink2015; Streuff and others, Reference Streuff, Cofaigh, Noormets and Lloyd2018).
Terminal moraines: Two terminal moraines can be observed in the submarine forefield of Hansbreen, each of them associated with a debris flow lobe. The outermost terminal moraine takes the form of a large, crescent, transverse ridge beyond Hansbukta, emerging onshore as the ice-cored lateral terminal moraines and marking the LIA maximum of Hansbreen (Figs 2 and 3). The total length of the LIA terminal moraine approaches 5100 m with a submarine part of c. 3300 m. The arcuate form indicates the radial splaying of the glacier beyond the constraining mountain ridges. The indentation in the distal flank is related to the abrupt break in the slope into a deeper fjord basin, which has prevented the full development of the moraine (cf. Dowdeswell and others, Reference Dowdeswell, Ottesen and Bellec2020). The outermost terminal moraine of Hansbreen was described in detail by Ćwiąkała and others (Reference Ćwiąkała2018). The submarine ridge is plain-topped, c. 13 m high, with clear margins in the central, but extensively blurred in the lateral parts and located in a water depth of 10–25 m. Rock outcrops, fields of megaripples, iceberg pits and ploughmarks can be identified on the moraine surface (Ćwiąkała and others, Reference Ćwiąkała2018). On the proximal flank, four oval, flat-floored depressions 28–55 m in diameter and 2 m deep are interpreted as kettle holes. Near Oseanograftangen, the moraine surface is eroded by a channel-like feature interpreted as a glacifluvial incision, 2–7 m deep, 160–250 m wide, and with blurred margins reworked by sediment flows (Figs 2 and 3). In Isbjørnhamna, the outermost terminal moraine is subdued and overprinted with a debris flow lobe associated with an inner terminal moraine.
The inner terminal moraine occurs as transverse ridge segments up to 3 m high, semi-parallel to the outer terminal moraine and corresponding to the glacier extent in 1938 (Figs 2 and 3). We imply that terminal moraines have been formed by surges based on their resemblance to surge terminal moraines of Svalbard tidewater glaciers, in particular the association with well-developed debris flow lobes (e.g. Flink and others, Reference Flink2015; Burton and others, Reference Burton, Dowdeswell, Hogan and Noormets2016; Noormets and others, Reference Noormets, Flink and Kirchner2021). The morphology of the inner terminal moraine of Hansbreen is similar to the moraines of Tunabreen or Blomstrandbreen, corresponding to surges in the 20th century (Flink and others, Reference Flink2015; Burton and others, Reference Burton, Dowdeswell, Hogan and Noormets2016). In each site, the terminal moraines of subsequent surges are significantly smaller than the LIA terminal moraine and often discontinuous across the fjord. The formation of submarine terminal moraines involves thrusting and pushing of sediments during glacier advances as well as depositional processes during glacier stillstand, which may be long-lasting on a sill (e.g. Benn and Evans, Reference Benn and Evans2010; Ottesen and others, Reference Ottesen, Dowdeswell, Bellec and Bjarnadóttir2017; Lovell and others, Reference Lovell2018).
Debris flow lobes: We identified two glacigenic debris flow lobes in the forefield of Hansbreen. The outermost lobe overprints the distal flank of the large terminal moraine, the adjacent flat-floored area of Isbjørnhamna and a steep northern side of the Hornsund Fjord beyond the outermost terminal moraine (Figs 2 and 3). In Isbjørnhamna, the lobe is flat-surfaced with clear outer margins, several rock outcrops and small, circular depressions, which are probably iceberg pits. Towards the break in slope into a deeper part of Hornsund, the lobe surface becomes hummocky with abundant iceberg pits, ploughmarks and minor sediment slides and flows. Similar topography can be observed beyond the central and eastern parts of the outermost terminal moraine with several prominent downslope-oriented flow structures. The ice-proximal margins of the moraine are clear, apart from the area adjacent to the moraine incision affected by mass-wasting processes. The second debris flow lobe is associated with the inner terminal moraine and superimposed on the top of the outermost, large terminal moraine in Isbjørnhamna. The landform has distinct margins and flow direction to the south-west (Figs 2 and 3). According to published backscattering data, the sediment flow lobes are composed of fine-grained or mixed material contrasting with coarse-grained surficial sediments of the terminal moraines (Ćwiąkała and others, Reference Ćwiąkała2018). Glacigenic debris flow lobes result from the bulldozing or pushing of seafloor sediments in front of the advancing terminus during surging and subsequent slope failure on the distal side of the glaciotectonic moraine (Dowdeswell and Ottesen, Reference Dowdeswell and Ottesen2016; Lovell and others, Reference Lovell2018). The steep topography beyond the outermost terminal moraine has presumably controlled the development of the associated debris flow lobe, as they usually take the form of extensive gently sloped lobes in flat-floored areas (e.g. Dowdeswell and others, Reference Dowdeswell, Ottesen and Plassen2016; Flink and others, Reference Flink, Hill, Noormets and Kirchner2018; Streuff and others, Reference Streuff, Cofaigh, Noormets and Lloyd2018).
Smooth glacigenic seafloor: Smooth seafloor with flat-floored depressions separated by transverse moraine ridges comprises a major part of the submarine forefield (Figs 2 and 3). The maximum depth of depressions increases towards the current glacier front. We interpret these as glacially overdeepened basins filled with sediments from meltwater plumes, previously described by Tegowski and others (Reference Tegowski, Trzcinska, Kasprzak and Nowak2016) and Ćwiąkała and others (Reference Ćwiąkała2018). The basin-fill sediments partly bury the moraine ridges from minor readvances of Hansbreen. The sediment thickness ranges from 10 m in the central to 25 m in the southernmost part of the submarine forefield and the estimated mean sediment accumulation rate in particular basins ranged between 0.25 and 0.4 m a−1 (Ćwiąkała and others, Reference Ćwiąkała2018). In the topography of the smooth seafloor, Ćwiąkała and others (Reference Ćwiąkała2018) documented fields of megaripples, pockmarks, iceberg pits and ploughmarks.
Pockmarks: Pockmarks occur in the southernmost part of the forefield as small, circular depressions with diameters and depths approaching 15 and 1 m, respectively. The distribution of pockmarks in the basin adjacent to the frontal terminal moraine was documented by Ćwiąkała and others (Reference Ćwiąkała2018), who suggested their possible origin as gas migration along faults or seepage of pore water due to very high sedimentation rate. Widespread craters and mounds related to methane release develop in the Arctic seabed after deglaciation (Andreassen and others, Reference Andreassen2017). Apart from geological factors (e.g. Weniger and others, Reference Weniger2019), pockmarks in Svalbard fjords may form as a result of water escape from rapidly deposited glacigenic debris flow lobes related to surging (Ottesen and others, Reference Ottesen2008; Forwick and others, Reference Forwick, Baeten and Vorren2009). Pockmarks in Hansbukta may be of similar origin considering the high sediment accumulation rate in the basins (cf. smooth glacigenic seafloor; Ćwiąkała and others, Reference Ćwiąkała2018). In addition, we infer that their formation may be associated with the burying of organic-rich sediments during glacier advance.
Hansbreen on archival maps and photographs (1872–1936)
Historical maps
The first published sketch map of the Hansbreen snout (scale 1: 200 000) was prepared in 1872 during the Austro-Hungarian North Pole Expedition (Peterman, Reference Peterman1874). The glacier was also presented on a 1: 200 000 map from the Russian–Swedish expedition in 1899–1901 (Wassiliew, Reference Wassiliew1925). The frontal position can be traced on a 1: 100 000 map based on reconnaissance photogrammetric surveys of the Hornsund area in 1918 during the Norwegian expeditions in 1917–1921 (Fig. 9a; Hoel, Reference Hoel1929). In these maps, Hansbreen occupies Hansbukta and the north-eastern part of Isbjørnhamna, covering the Baranowski Peninsula and Oseanograftangen. However, the maps are not detailed enough to accurately assess the extent and possible fluctuations of the glacier. Hence, our study is primarily based on archival photographs documenting the extent and surface morphology of Hansbreen.
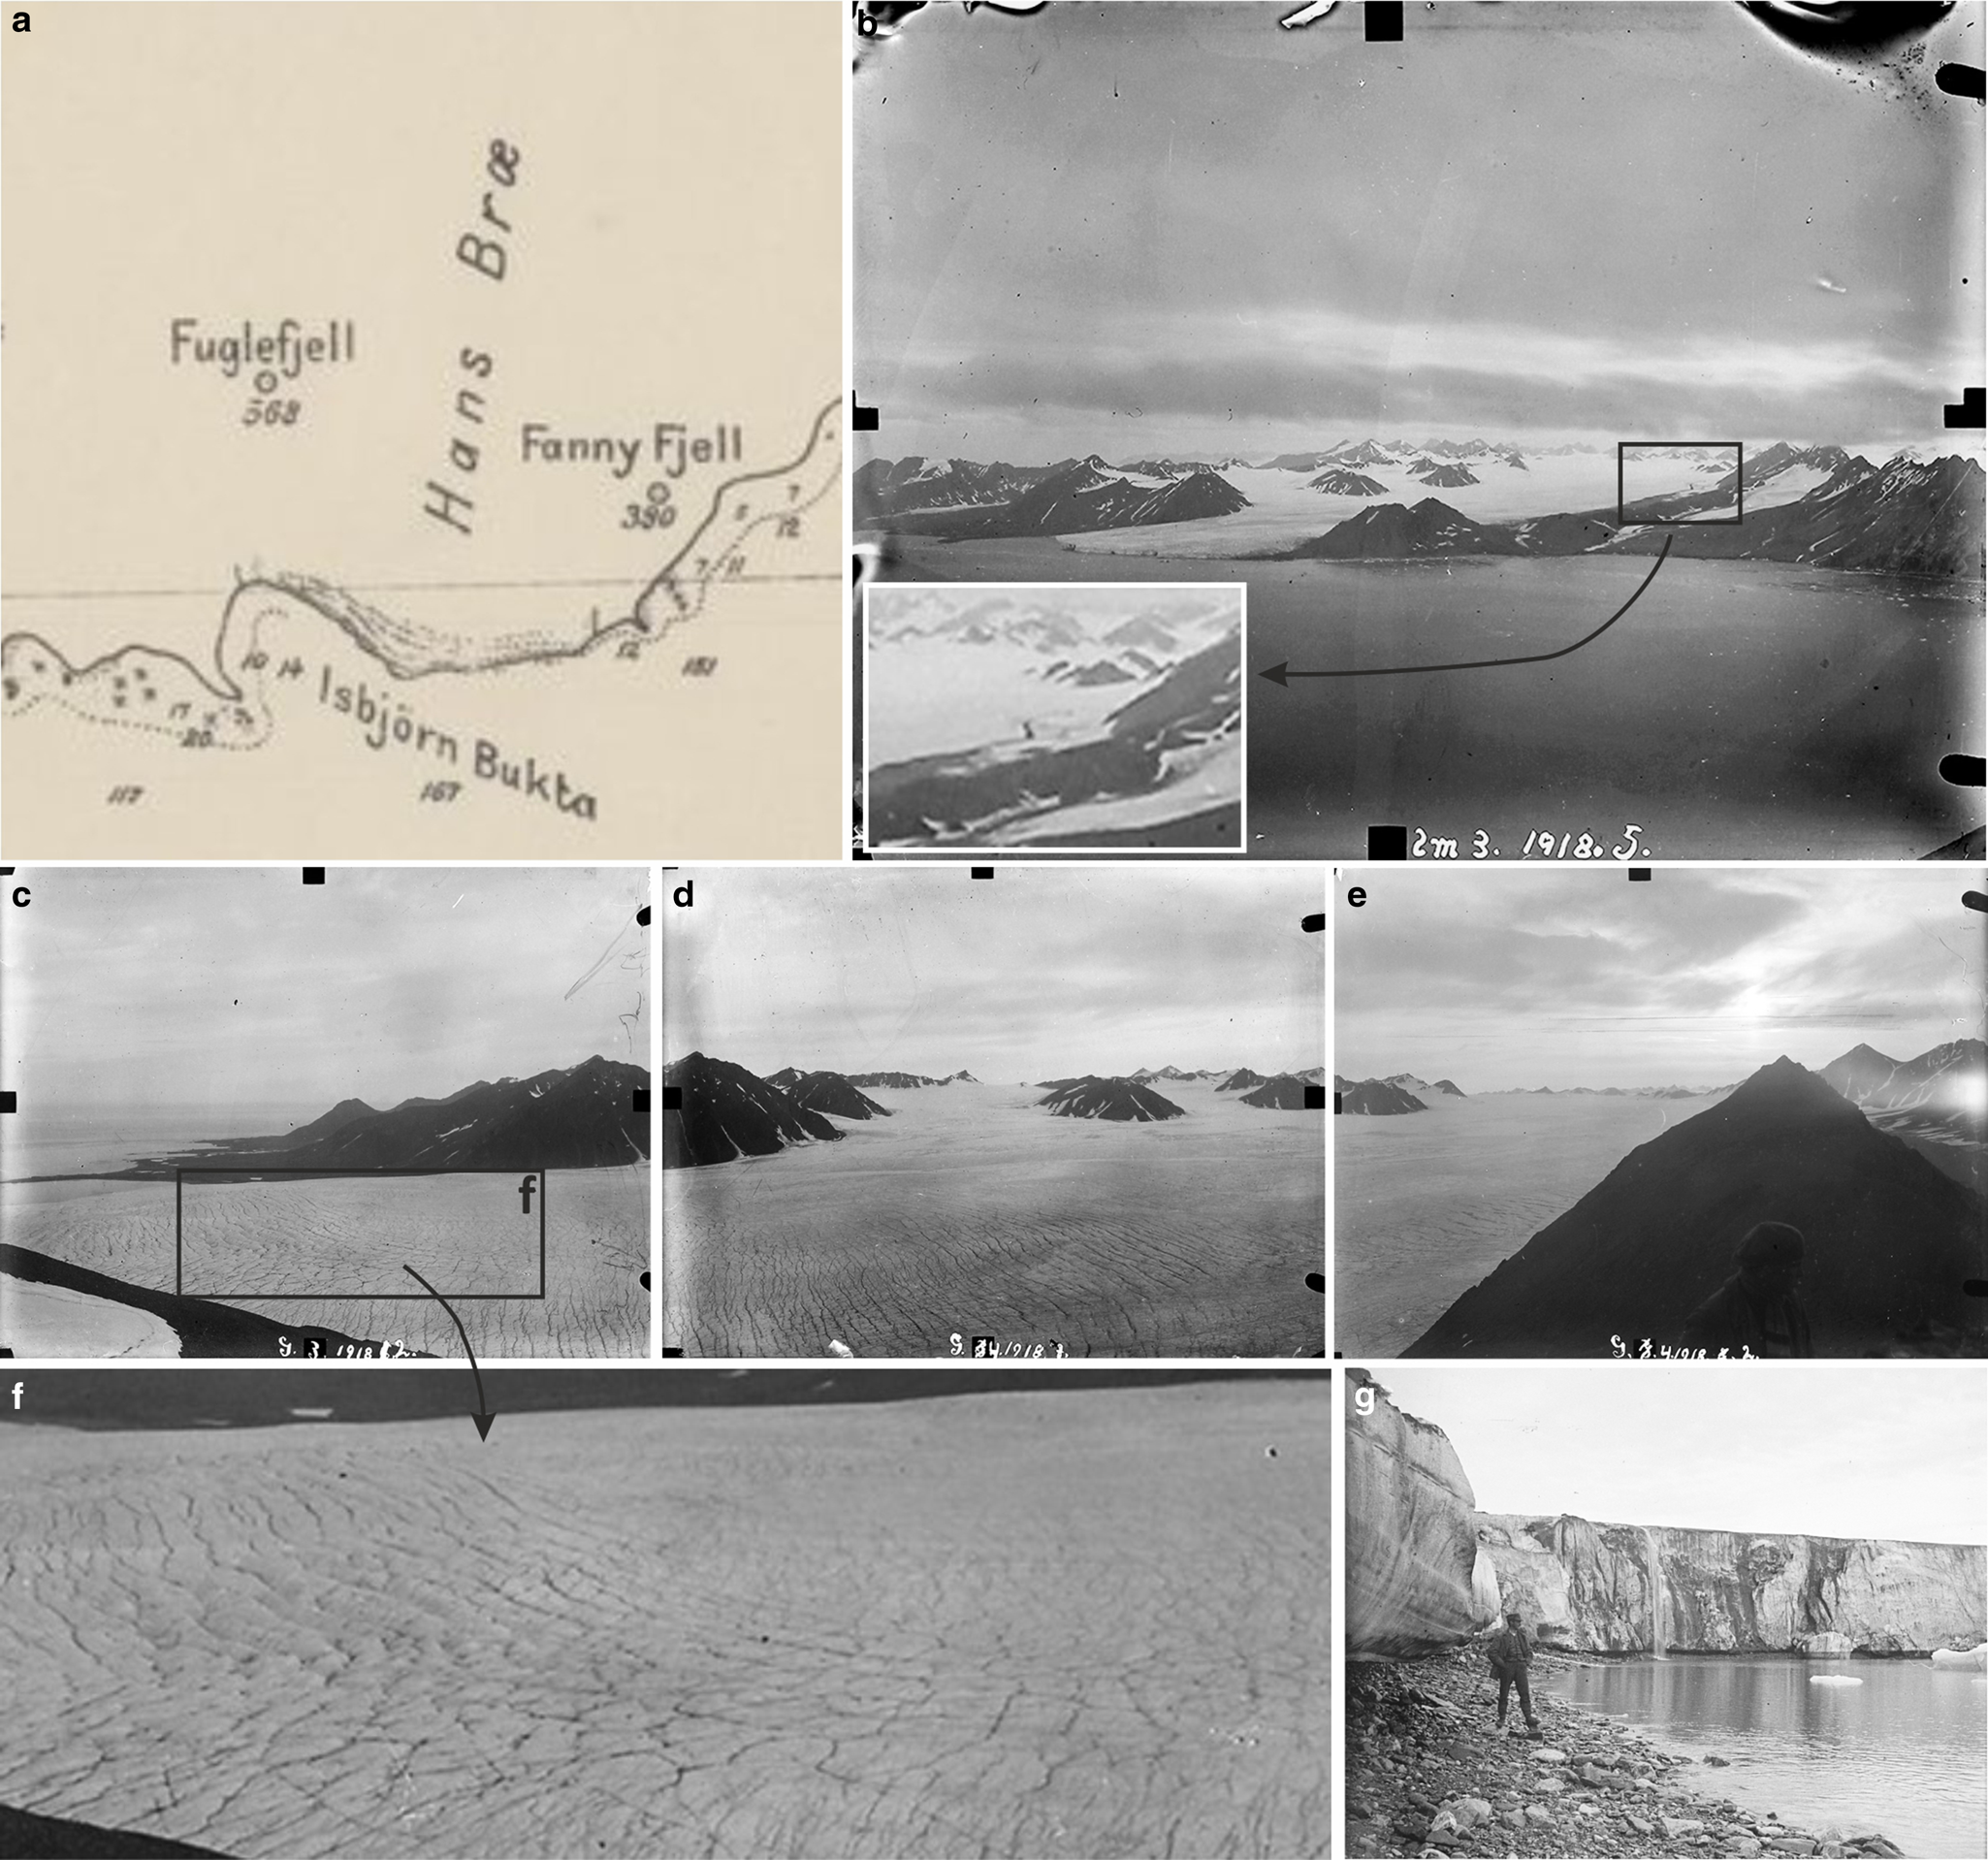
Figure 9. (a) Hansbreen on a 1: 100 000 map ‘Spitsbergens Kyst, Hornsund til Dunder Bay’ based on the Norwegian Spitsbergen expeditions in 1917–1921 with photogrammetric measurements in Hornsund in 1918 (public domain, https://data.npolar.no). (b–g) Terrestrial photogrammetric documentation of Hansbreen from 1918. (b) The radially expanded glacier snout after surge advance. Note a folded medial moraine in the eastern part of the glacier. (c–f) A complex network of narrow, cross-cutting crevasses and crevasse traces documented from Fannytoppen. (g) The glacier front in Isbjørnhamna. Note a waterfall from an active supraglacial channel in the background. (b) © Olaf Holtedahl, Norsk Polarinstitutt (modified), (c–f) © Jørgen Gløersen, Norsk Polarinstitutt (modified), (g) © Adolf Hoel, Norsk Polarinstitutt (cropped and modified).
Archival photographs
Unique photographic documentation of Hansbreen from the late 19th and early 20th centuries was collected by the Austro-Hungarian expedition in 1872 and the Norwegian expedition in 1918. In 1936, Hansbreen was documented on oblique aerial photographs during the Norwegian mapping campaign of Svalbard (Luncke, Reference Luncke1936). The photographs provide data on the glacier extent, surface morphology, ice structure in the ice cliff and geomorphological features, which shed light on the glacier dynamics. In addition, they are a vital source of data on geomorphological processes.
1872: Photographs from the Austro-Hungarian expedition in 1872 documented the terrestrial margins of Hansbreen and part of the calving front. In the western terrestrial zone, the glacial terminus had already reached its LIA maximum position (Fig. 10a). The marine-terminating zone was densely and chaotically crevassed with a conspicuous surface bulge (Fig. 10b). At the foot of Fannytoppen, the terrestrial margin of Hansbreen terminated as a steep ice cliff, exposing inclined and folded debris layers. The photograph also documented top-down and bottom-up crevasses and a convex surface profile (Figs 10c and d). In this part of the glacier, the terminus had not yet reached the LIA maximum, today marked by the lateral terminal moraine adjacent to rocky raised marine terraces. The proglacial outwash plains mapped outside the terminal moraine were also absent in this photograph (Figs 3 and 10c).
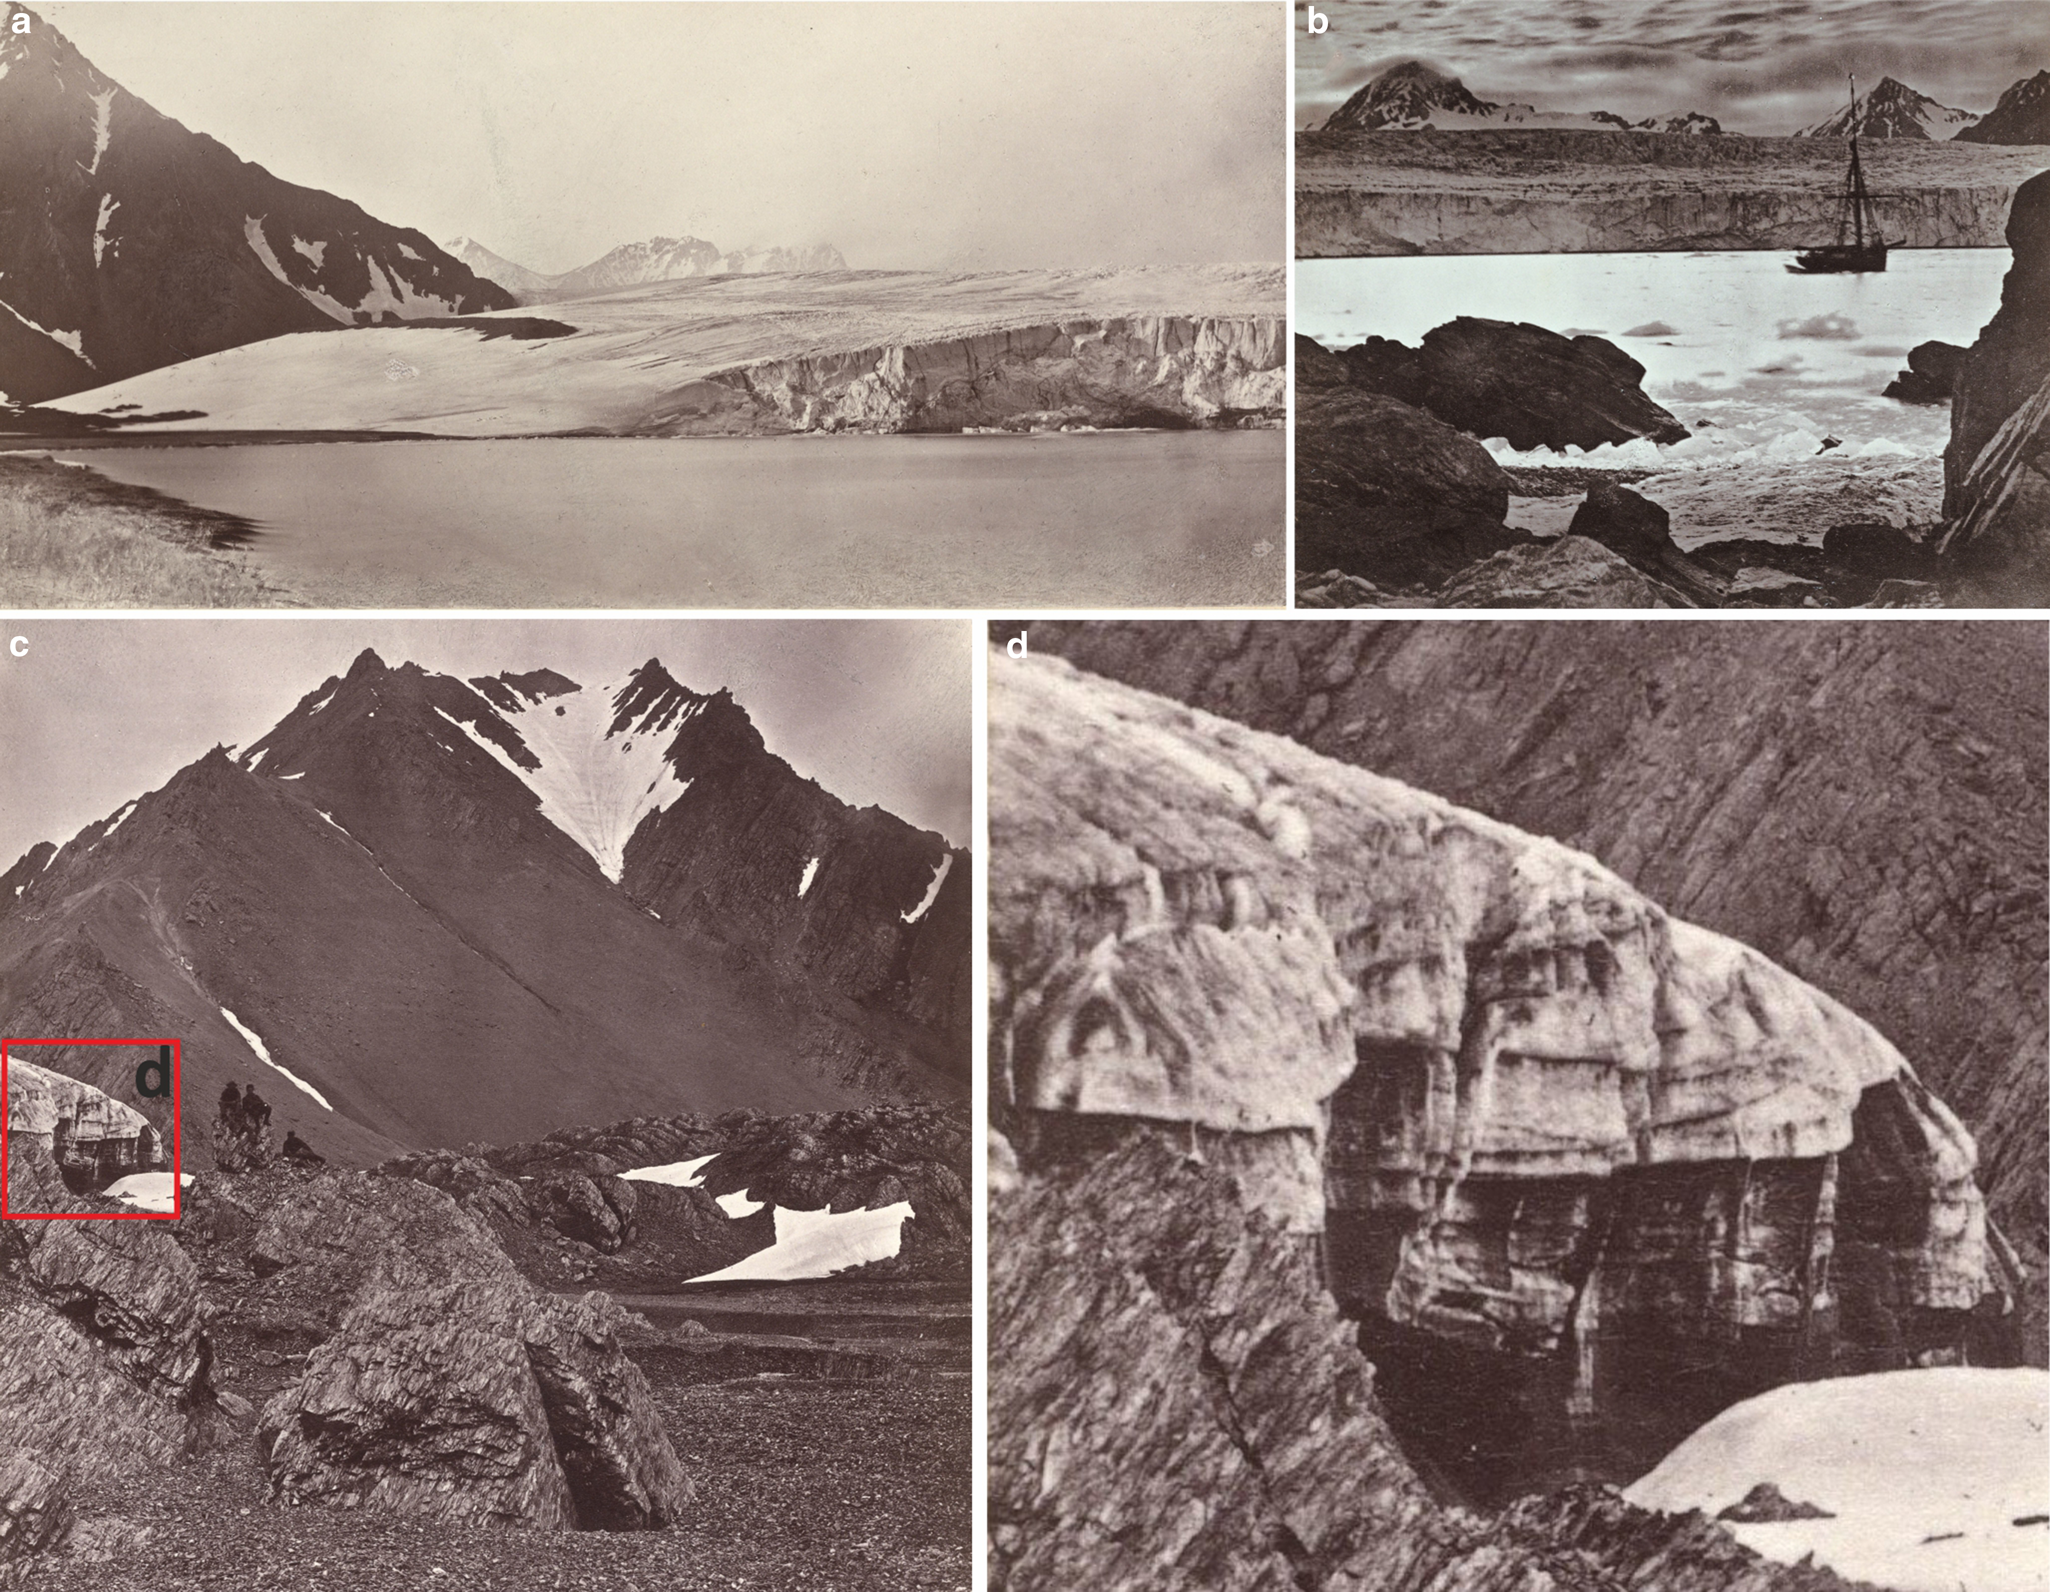
Figure 10. Photographs of Hansbreen from the Austro-Hungarian expedition in 1872. (a) The western terrestrial margin of the glacier. (b) Crevassed marine-terminating zone with a conspicuous surface bulge. (c, d) The eastern terrestrial margin, where the glacier had not yet reached the maximum extent. Note folded and inclined debris layers, top-down and bottom-up crevasses exposed on the ice cliff and a convex surface profile of the glacier. © ÖNB Vienna: Image ID 00299043, 00480587 and 00444839 (cropped and modified).
1918: The Norwegian Spitsbergen expedition in 1918, led by Adolf Hoel and Sverre Røvig, conducted reconnaissance photogrammetric measurements in Hornsund. The comprehensive documentation, including photogrammetric photos, overlays the entire glacier. At that time, the glacier front was anchored on the small Hansholmane islands and Oseanograftangen (Figs 9a and b). The extent of the terrestrial margins was similar to that of 1872, but the calving front positions are difficult to compare due to insufficient data from the previous photographs. Glacier-free unnamed islands within the terminal moraine belt suggest a slight retreat from the maximum LIA position. A photograph from the southern side of Hornsund revealed a folded median moraine between Hansbreen and one of the eastern tributaries (Fig. 9b). The two black features on the calving front can be observed in other photographs and could be interpreted as the mouths of subglacial channels. The photos from Fannytoppen documented a dense, complex network of intersecting crevasses and crevasse traces extending high up on the main trunk of the glacier (Figs 9c–f). Most crevasses were narrow, which allowed the expedition to cross the glacier (Hoel, Reference Hoel1929). The photographs also documented a steep ice cliff in Isbjørnhamna with supra- and englacial sediments and a waterfall at the ice front (Fig. 9g). Compared to 1872, this part of the glacier had a smooth topography in 1918.
1936: By 1936, the glacier had retreated beyond Hansholmane, but the terminus was still anchored on Oseanograftangen and the Baranowski Peninsula (Fig. 11). The glacier front was relatively straight and slightly expanded in the central zone. The downwasting of the stagnant terrestrial margins had led to the development of the ice-cored moraine complexes. The lateral moraines of the eastern tributary glaciers had merged into a wide belt along the glacier margin. As a result, the folded moraine of the 1918 photo was no longer visible as it was probably squeezed to the eastern lateral moraine. The surface morphology was dominated by crevasse traces and wide transverse crevasses in the frontal zone. Some crevasse traces reflected the intersecting pattern of crevasses documented in 1918.

Figure 11. Hansbreen in the oblique aerial photograph from 1936. © Norwegian Polar Institute.
Discussion
Geomorphological records of surging
The forefield of Hansbreen with CSRs, fluted till plains, hummocky moraines, high trimlines, drumlinized seafloor, glacial lineations, De Geer moraines, terminal moraines with debris flow lobes and other components (Fig. 3) indicates at least one surge event. Such landform assemblages are consistent with surging glacier landsystem models in terrestrial and submarine environments (Evans and Rea, Reference Evans and Rea1999, Reference Evans, Rea and Evans2003; Ottesen and Dowdeswell, Reference Ottesen and Dowdeswell2006; Ottesen and others, Reference Ottesen2008, Reference Ottesen, Dowdeswell, Bellec and Bjarnadóttir2017; Flink and others, Reference Flink2015; Aradóttir and others, Reference Aradóttir2019).
The key features diagnostic for the surges of Hansbreen are CSRs, glacial lineations and two glacitectonic terminal moraines with debris flow lobes. Terrestrial CSRs and flutings occur up to the southernmost part of field (Figs 2–8). In Svalbard, CSRs networks emerging from stagnating ice may be related to surge episodes from years to over a century ago (Lovell and others, Reference Lovell2015a; Farnsworth and others, Reference Farnsworth, Ingólfsson, Retelle and Schomacker2016). CSRs and flutings in the terrestrial forefield of Hansbreen correspond with the submarine features. The rapid ice flow during the surge is evidenced by the streamlined glacial lineations (Figs 2 and 3; Ottesen and others, Reference Ottesen2008, Reference Ottesen, Dowdeswell, Bellec and Bjarnadóttir2017; Streuff and others, Reference Streuff, Cofaigh, Noormets and Lloyd2018), although their absence would not preclude a surge event (Aradóttir and others, Reference Aradóttir2019). The submarine CSRs and glacial lineations appear only in the inner part of Hansbukta, but they might have been more widespread in the past and buried later with glacimarine sediments. A restricted extent or absence of CSRs on the fjord floor, but occurrence on land, were evidenced in the forefield of surge-type Blomstrandbreen (Burton and others, Reference Burton, Dowdeswell, Hogan and Noormets2016; Farnsworth and others, Reference Farnsworth, Ingólfsson, Retelle and Schomacker2016) and the glacial system of Trygghamna (Aradóttir and others, Reference Aradóttir2019). Hansbreen has not developed a terrestrial thrust-block moraine diagnostic of surging, but such landforms are not widespread in the lateral forefields of surge-type tidewater glaciers in Svalbard (Lønne, Reference Lønne2016; Lovell and Boston, Reference Lovell and Boston2017). The slightly curvilinear ridges of the lateral terminal moraines and the submarine large terminal moraine indicate the radial expansion of the glacier snout when entering the Hornsund Fjord (Figs 2, 3, 9). The occurrence of terrestrial CSRs up to the southernmost part of the forefield (Figs 3 and 6), the dimensions of the submarine terminal moraine and the occurrence of a debris flow lobe on its distal flank imply that the maximum LIA extent of Hansbreen was related to a surge. The lateral terminal moraine on the Flatpasset saddle (Figs 2 and 3) marks the glacier's attempt to pass the mountain ridge during this surge advance when the glacier entrained marine sediments with mollusc shells and deposited with diamicton up to 150 m a.s.l.
The inner terminal moraine with a debris flow lobe is the main evidence of a possible second surge. The lobe has overprinted the large terminal moraine and the flow direction of sediment was to the south-west, perpendicular to the inner moraine (Figs 2 and 3). The inner moraine corresponds to the frontal position of Hansbreen in 1938, which was similar or, in some parts, slightly more extensive than in 1936 (Fig. 2). The dimensions of the moraine and the sediment lobe are notably smaller than those from the LIA maximum. However, in Svalbard, surge terminal moraines from the 20th century tend to be less prominent than surge moraines from the LIA and may have similar morphology to recessional moraines (Burton and others, Reference Burton, Dowdeswell, Hogan and Noormets2016). Surge end moraines of Tunabreen from 1930, 1971 and 2004 are much lower than the outermost moraine belt from the 1870s surge and only two surge moraines have adjacent debris flow lobes (Flink and others, Reference Flink2015). The younger debris flow lobe of Hansbreen has similar dimensions to debris flow lobes on the outermost surge moraines of Blomstrandbreen (Streuff and others, Reference Streuff, Forwick, Szczuciński, Andreassen and Cofaigh2015, Reference Streuff, Cofaigh and Wintersteller2022). This glacier has not developed debris flow lobes at all during the subsequent surges in the 20th century (Burton and others, Reference Burton, Dowdeswell, Hogan and Noormets2016). The formation of the inner surge moraine of Hansbreen may have been limited by the scarce supply of sediment from resistant metamorphic rocks in the glacier basin that had been redeposited during the older surge. Low surge end moraines with small or without debris flow lobes may also reflect a short-active surge phase, which limits the sediment supply to the glacier terminus (Flink and others, Reference Flink2015). In addition, most of the moraine ridges in the central and southern Hansbukta have been partly buried with glacimarine sediments, which mask their primary size. If the inner terminal moraine had a continuation across Hansbukta, it also might have been buried and subdued.
Historical records of surging
1872 – ongoing surge: The photographs of Hansbreen from the Austro-Hungarian expedition in 1872 reveal characteristic features of an active surge phase (Fig. 10). The glacier surface was densely crevassed with a conspicuous bulge, which we interpret as a surge front propagating downglacier (e.g. Sund and others, Reference Sund, Eiken, Hagen and Kääb2009; Lovell and Fleming, Reference Lovell and Fleming2023). A surge bulge reflects the mass displacement from the reservoir area and builds up in a high friction zone near the glacier front (Haga and others, Reference Haga2020). The ice thickness at the south-western margin corresponded to the trimline on edge between the eastern and southern slopes of Fugleberget (Fig. 2). Most of the southern slope is overprinted with talus cones and it was not possible to identify a clear trimline over there (Figs 2, 3, 10a). The vertical ice extent in 1872 was not documented on the other mountain slopes. The south-eastern margin of Hansbreen had a convex surface profile and a steep ice cliff with debris-rich structures (Figs 10c, d). Similar features are typical for the termini of surging glaciers (e.g. Lovell and others, Reference Lovell2015a; Ingólfsson and others, Reference Ingólfsson2016; Sobota and others, Reference Sobota, Weckwerth and Nowak2016; Lovell and Fleming, Reference Lovell and Fleming2023) and we suggest they fed the subsequent controlled moraines in this area (Fig. 3). The glacier extent in this area was smaller than marked by the LIA lateral terminal moraine. Hence, we imply that the surge was underway and the glacier was advancing to the maximum LIA position.
1918 – quiescent phase: Photographic documentation from the Norwegian Spitsbergen expedition in 1918 provides evidence for a glacier in the quiescent phase. The radially expanded snout was anchored on capes and small islands, and the glacier extent corresponded to the outermost submarine terminal moraine and the lateral terminal moraines. The ice thickness was similar to the trimlines mapped on the Fugleberget slopes and the southern slope of Fannytoppen (Figs 3 and 9). The frontal position did not change significantly between 1872 and 1918 (Koryakin, Reference Koryakin1974; Jania, Reference Jania1988). We suggest it was linked to anchoring the terminus on the terminal moraine and skerries with the prevailing thinning of the glacier tongue by the surface ablation rather than limited frontal ablation in shallow water. The water depth on the terminal moraine ranges from 2 to 15 m and does not exceed 25 m on the ice-proximal side of the belt (Fig. 2). The southernmost extent of the calving front was on the Hansholmane islands, which were probably one of the pinning points within the moraine belt (Figs 1, 2, 3, 9a and b). The mouths of subglacial channels could be observed on the calving front (Figs 9a and b) and the location of one of them seemed to correspond with an incision in the submarine terminal moraine (Figs 2 and 3), which suggests possible glacifluvial origin of this feature. The surface morphology of Hansbreen revealed compelling evidence for a surge before 1918, such as a folded medial moraine and a dense, complex network of intersecting crevasses and crevasse traces extending high up on the main trunk of the glacier (Fig. 9). We infer that abundant healed crevasses and their cross-cutting pattern were associated with rapid ice flow while surging in 1872. In 1918, the glacier terminus in Isbjørnhamna had a smooth topography and an active supraglacial channel with a waterfall at the ice cliff, which suggests closed crevasses in this part of the glacier during the quiescent phase (Fig. 9g). Similar spectacular features can be observed on the front of Bråsvellbreen (https://toposvalbard.npolar.no/) after decades of the quiescent phase in the aftermath of its surge in 1938 when the glacier tongue was badly crevassed (Schytt, Reference Schytt1969).
Late 1930s – limited evidence for a subsequent surge: In the western part of the forefield, the inner terminal moraine with a debris flow lobe suggests a younger surge of Hansbreen, which might have occurred in the first half of the 20th century (Fig. 2). Oblique aerial photographs from 1936 do not indicate a fully active surge (stage 3 according to Sund and others, Reference Sund, Eiken, Hagen and Kääb2009) as the surface morphology was dominated by crevasse traces, wide transverse crevasses were confined to the frontal zone, the terrestrial margins were stagnant, and the calving front was relatively straight and slightly expanded only in the central zone (Fig. 11). These data alone do not allow a qualitative assessment of the upper part of the glacier for evidence for the first two stages of the active surge phase expressed by changes in the glacier thickness (Sund and others, Reference Sund, Eiken, Hagen and Kääb2009). In August 1938, Pillewizer (Reference Pillewizer1939) measured the unusually high surface velocity of Hansbreen using the terrestrial photogrammetric method of Finsterwalder (Reference Finsterwalder1931), which could suggest an active surge phase, and his map indicates an advance in some parts of the glacier front compared to 1936 (Fig. 2). If such event occurred, it may have been related to the inner terminal moraine with a debris flow lobe. However, additional evidence is necessary to support this interpretation in its current state.
Reconciling glacial geomorphology and past dynamics of Hansbreen
The possible surge-type behaviour of Hansbreen has long been debated for the lack of evidence of an ongoing surge in the observation period (e.g. Jania, Reference Jania1988; Jania and Głowacki, Reference Jania and Głowacki1996; Rachlewicz and Szczuciński, Reference Rachlewicz and Szczuciński2000; Ćwiąkała and others, Reference Ćwiąkała2018). We present the records of at least one surge event. Photographic documentation of the glacier extent, surface morphology and ice structure in the ice cliff revealed characteristic features for the active surge phase in 1872 (Fig. 10) and quiescence in 1918 (Fig. 9). This advance was marked by the outermost terminal moraine, trimlines and the lateral terminal moraines (Figs 2 and 3). Sparse historical data may suggest a minor surge episode in the 1930s, but further investigation is necessary to confirm this event. The imprints of the possible younger surge are much weaker than the LIA surge and the only compelling geomorphological evidence is the inner terminal moraine with a debris flow lobe (Fig. 3).
Our interpretation differs from previous investigations, which did not conclude that surges had occurred. Ćwiąkała and others (Reference Ćwiąkała2018) analysed the submarine forefield and excluded the possibility of surging in the last c. 120 years based on the absence of streamlined glacial lineations, overridden recessional moraines, CSRs or a surge moraine with a debris flow lobe. However, drumlinized seafloor, streamlined glacial lineations and CSRs are not visible in the multibeam data collected in 2008, which they used for geomorphological mapping. Such landforms occur in the inner zone of Hansbukta surveyed in 2014–2017 (Fig. 3). CSRs were also not identified in the terrestrial forefield of Hansbreen (Skolasińska and others, Reference Skolasińska, Rachlewicz and Szczuciński2016 and references therein), but part of the debris-rich structures in the passive ice cliff described by Rachlewicz and Szczuciński (Reference Rachlewicz and Szczuciński2000) resembled CSRs at the base of surge-type glaciers (e.g. Evans and Rea, Reference Evans, Rea and Evans2003; Lovell and others, Reference Lovell2015a). Apart from the north-western forefield, most CSRs are subdued and take the form of low ridges or sediment trails (Figs 6 and 8), similar to those described in Trygghamna (Aradóttir and others, Reference Aradóttir2019; Ben-Yehoshua and others, Reference Ben-Yehoshua, Aradóttir, Farnsworth, Benediktsson and Ingólfsson2023). CSRs in the Hansbreen forefield are less abundant, lower and worse preserved than in many surge-type glaciers in Svalbard, e.g. Nathorstbreen (Lovell and others, Reference Lovell2018), Sefströmbreen (Boulton and others, Reference Boulton1996), Tunabreen, Von Postbreen (Lovell and others, Reference Lovell2015a) or the Hornbreen-Hambergbreen glacier system (Osika and others, Reference Osika, Jania and Szafraniec2022). Therefore, previous investigations could have omitted them without high-resolution remote sensing data.
Our study shows the importance of compiling terrestrial and submarine geomorphology with historical records for reconstructing past glacier dynamics. However, if the archival data are sparse, the identification of surge-type glaciers is impeded by the low preservation potential of surge-diagnostic landforms or topographic or geological conditions meaning that they do not form in the first place (e.g. Hansen, Reference Hansen2003; Farnsworth and others, Reference Farnsworth, Ingólfsson, Retelle and Schomacker2016; Ingólfsson and others, Reference Ingólfsson2016; Gądek and others, Reference Gądek, Rojan and Suska-Malawska2022). Therefore, we infer that the number of Svalbard surge-type glaciers or decaying glaciers that surged in the past can be underestimated if the geomorphological fingerprints have been obliterated and historical records are lacking or unrecognized. One example may be a cold-based valley Tellbreen, which was thought not to have ever surged (Bælum and Benn, Reference Bælum and Benn2011). However, the basal sequence and glaciological structures revealed that it had experienced warm-based conditions and dynamic ice flow, most probably during the LIA (Lovell and others, Reference Lovell2015b).
Interestingly, the 1870s surge of Hansbreen occurred in a period of numerous surge events in Svalbard between 1860s–1900s (e.g. Fridtjovbreen in 1861; Liestøl, Reference Liestøl, Williams and Ferrigno1993, Kronebreen, Kongsvegen and Kongsbreen in 1869; Liestøl, Reference Liestøl1988, Von Postbreen in 1870; Liestøl, Reference Liestøl, Williams and Ferrigno1993, Nathorstbreen in the 1870s or 1880s; Liestøl, Reference Liestøl1977; Ottesen and others, Reference Ottesen2008, Sefströmbreen in 1882–1886; De Geer, Reference De Geer1910, Recherchebreen and Renardbreen at the turn of the 1870s and 1880s; Zagórski and others, Reference Zagórski2023, Scottbreen in 1880s; Zagórski and others, Reference Zagórski2023, Hambergbreen c. 1900; Wassiliew, Reference Wassiliew1925 or Paulabreen before 1898; Ottesen and others, Reference Ottesen2008). The 1930s was another decade of apparent surge clustering (e.g. Bråsvellbreen in 1936–1938; Schytt, Reference Schytt1969, Negribreen in 1935–1936; Liestøl, Reference Liestøl1969, Körberbreen in 1938; Liestøl, Reference Liestøl1969, Markhambreen in 1930–1936; Hagen and others, Reference Hagen, Liestøl, Roland and Jørgensen1993, Arnesenbreen in 1925–1935; Hagen and others, Reference Hagen, Liestøl, Roland and Jørgensen1993 or Etonbreen, Rijpbreen and Clasebreen in 1938; Hagen and others, Reference Hagen, Liestøl, Roland and Jørgensen1993), although, despite some evidence, a surge of Hansbreen in this period remains questionable. Such synchronicity of surge advances might suggest regional factors affecting glacier dynamics. The reconstructed winter surface air temperatures in Longyearbyen were higher in the 1860s and early 1870s than in the 1850s or late 1870s (Divine and others, Reference Divine2011). The 1920s and 1930s corresponded to the early 20th-century climate warming in Svalbard (Nordli and others, Reference Nordli2020) and we speculate that these surges may have been related to increased water content at the glacier beds from enhanced summer melt and produced by frictional heating (cf. enthalpy balance theory by Benn and others, Reference Benn, Fowler, Hewitt and Sevestre2019). However, this observation requires further studies on the LIA climate conditions and investigation into triggering factors of glacier surges (e.g. Benn and others, Reference Benn, Hewitt and Luckman2023).
Repeated surge events of many Svalbard glaciers with different durations of the quiescent phase (e.g. Tunabreen; Flink and others, Reference Flink2015, Blomstrandbreen; Burton and others, Reference Burton, Dowdeswell, Hogan and Noormets2016, Negribreen; Haga and others, Reference Haga2020) raise the question about a potential future surge of Hansbreen. In our opinion, the surface topography of Hansbreen, i.e. the low-lying accumulation area of the main trunk and significant ice supply by the western tributary glaciers, as well as the subglacial topography with overdeepenings along the centreline, will hinder the build-up of mass and triggering the next surge. A dramatic increase in solid precipitation will be critical to fill up the reservoir area(s) and allow the rapid transfer of large amounts of ice to the receiving zone. We can speculate that such conditions will not be fulfilled in the following decades under projected climatic conditions in Svalbard (Hanssen-Bauer and others, Reference Hanssen-Bauer2019). However, one should not exclude possible dynamic advances of the western tributary glaciers after retreat of the main trunk. The loose of the back-stress from the Hansbreen main tongue may lead to re-organization of the surface profiles of the tributary glaciers through re-advances (Farnsworth and others, Reference Farnsworth2017).
Conclusions
We present a reconstruction of the past dynamics of Hansbreen by combining geomorphological mapping of the terrestrial and submarine forefields with historical data from Spitsbergen expeditions in the 19th and 20th centuries. Landform assemblages, including CSRs, flutings, glacial lineations and terminal moraines with debris flow lobes are consistent with the published surging glacier landsystem models and indicate at least one surge of Hansbreen.
Photographic documentation from the Austro-Hungarian expedition in 1872 revealed evidence of an ongoing active surge phase, such as a surge bulge, extensive surface crevassing, top-down and bottom-up crevasses and a convex surface profile of the terrestrial margin. The terminus had not yet reached the surge maximum. This surge corresponded to the maximum LIA extent of Hansbreen, marked by the outermost submarine terminal moraine with a debris flow lobe, terrestrial lateral terminal moraines and trimlines.
In 1918, the glacier was in the quiescent phase and the calving front was anchored on small islands and capes. The photogrammetric photos from the Norwegian expedition revealed further evidence of the surge before 1918, including a folded medial moraine and a dense, complex network of intersecting healed crevasses extending high up on the main trunk of Hansbreen. There may have been a subsequent surge in the 1930s based on a minor submarine terminal moraine with a debris flow lobe but this potential event requires further investigation.
Under projected climatic conditions, the low-lying accumulation area of the main trunk will hinder the mass build-up, and a potential next surge will probably remain questionable in the following decades. However, surges of the western tributary glaciers should not be excluded, in particular as a dynamic response when they lose the back-stress from the receding main tongue.
Acknowledgements
This study was funded by the National Science Centre of Poland (grant no. 2021/41/N/ST10/02070). The publication was co-financed by the Institute of Earth Sciences at the University of Silesia in Katowice. We sincerely thank Joanna Szafraniec for her comments, and Małgorzata Błaszczyk, Michał Ciepły, Dawid Saferna and Kamil Kachniarz (University of Silesia in Katowice) for their support during the fieldwork. We thank the crew of the Polish Polar Station Hornsund for logistic support and hospitality. The research and logistic equipment of the Polar Laboratory of the University of Silesia in Katowice was used during the fieldwork. We thank the Norwegian Hydrographic Service for the bathymetric data from Hansbukta and Isbjørnhamna. We are especially grateful to Österreichische Nationalbibliothek and Norsk Polarinstitutt for providing historical photographs from the polar expeditions to Hornsund in 1872 and 1918. We thank the Editor Andrew Fowler and in particular Harold Lovell for constructive comments and the insightful review, which significantly improved this manuscript.
Author contributions
A.O.: conceptualization, field investigation, data analysis. J.J.: conceptualization, field investigation, data analysis, supervision. A.O. structured the paper and wrote the manuscript with support from J.J.
Conflict of interest
The authors declare none.
Data availability
We re-used several published datasets available at individual databases. A very high-resolution orthophotomap of the Hansbreen forefield is available at https://ppdb.us.edu.pl/geonetwork/srv/eng/catalog.search#/metadata/9b980572-2bcb-401f-a2e6-2a7a16428dd7 (supplementary data to Błaszczyk and others, Reference Błaszczyk, Laska, Sivertsen and Jawak2022). A DEM of these areas is available at https://ppdb.us.edu.pl/geonetwork/srv/eng/catalog.search#/metadata/69987fe3-f0ed-4fdc-b597-41dd5ae7d21a (supplementary data to Błaszczyk and others, Reference Błaszczyk, Laska, Sivertsen and Jawak2022). The bathymetric data of Hansbukta are available at https://ppdb.us.edu.pl/geonetwork/srv/eng/catalog.search#/metadata/27151f9a-b3c4-4955-8db7-0365861f3dd6 (supplementary data to Błaszczyk and others, Reference Błaszczyk2021). Front positions of Hansbreen are available at https://ppdb.us.edu.pl/geonetwork/srv/eng/catalog.search#/metadata/05e2c69a-5645-4488-bc88-630beb03a462 and https://ppdb.us.edu.pl/geonetwork/srv/eng/catalog.search#/metadata/77c6fbd4-1a07-47b1-a663-559970517841 (supplementary data to Błaszczyk and others, Reference Błaszczyk, Jania and Kolondra2013, Reference Błaszczyk2021). Archival photographs from 1872 are available at https://onb.digital/search/766393 and from 1918 at https://bildearkiv.npolar.no/fotoweb/. Upon publication, the vector layers (shapefiles) of the geomorphological map will be available in the open database ZENODO: https://doi.org/10.5281/zenodo.13646525.


 Open access