INTRODUCTION
In Western Europe Salmonella is with Campylobacter the leading cause of bacterial foodborne infection in humans with the serotypes Enteritidis and Typhimurium being responsible for about 75% of cases [Reference Fisher1]. In France, it has been estimated that, in the 1990s, foodborne salmonellosis accounted for 30 500–42 000 symptomatic documented infections, which resulted in 5700–10 200 hospitalizations and 90–540 deaths [Reference Vaillant2]. Salmonella holds its reservoir principally in domestic and wild animals, in particular poultry and pigs. The transmission to humans is mainly through the consumption of contaminated foodstuffs of animal origin [Reference Benenson and Chin3], eggs and egg products representing a substantial proportion of implicated foods [Reference Haeghebaert4, Reference Delarocque-Astagneau5].
The burden of Salmonella on health and its economic impact are substantial [Reference Trevejo6] which justifies controls and prevention programmes throughout the food chain. Poultry is a target of particular importance, and the prevention of Salmonella contamination of eggs and poultry meat a is a priority. The French Ministry of Agriculture and Fishing, referring to a 1992 European directive [7], implemented in October 1998 a control programme targeted to Salmonella Enteritidis (SE) and Typhimurium (ST) serotype infections in poultry [8]. The programme consists of systematic screening at defined intervals for SE in breeding flocks, future layer flocks and layer flocks. Apart from the omission of the obligatory screening for ST in the layer flocks, the other controls are identical for this strain as for SE. One-day-old chicks are controlled, and at the age of 4 and 16 weeks faecal samples and environmental swabs are taken and analysed. The same sampling procedure is carried out at ages 24, 40 and 55 weeks. When a flock is positive for SE or ST, the animals are slaughtered, eggs heat treated and the breeding area cleaned, and disinfected.
In order to assess the impact of these veterinary intensive measures on the incidence of salmonellosis caused by SE and ST in France, we conducted a time-series analysis of human surveillance SE and ST data and on a control-series of salmonellosis related to serotypes of non-poultry origins. By using intervention models, we evaluated whether the implementation of control measures was associated with a decrease of SE and ST incidence after implementation and attempted to quantify this.
MATERIALS AND METHOD
General design and data used
In this ecological study we analysed and quantified the temporal association between the incidence of salmonellosis caused by SE, ST and control serotypes and the implementation of specific control measures in poultry breeding. The study population included residents of metropolitan France between 1 January 1992 and 31 December 2003. A case is defined as a resident of metropolitan France from whom SE, ST or a non-poultry-associated serotype was isolated between 1 January 1992 and 31 December 2003 and subsequently sent for serotyping at the Salmonella National Reference Centre (NRC).
The data used in the analysis are the monthly number of Salmonella strains (Enteritidis, Typhimurium, control serotypes) serotyped by the NRC. The NRC receives Salmonella strains for serotyping from a network of collaborating laboratories representing one third of all hospitals and private French laboratories [Reference Grimont and Bouvet9]. Data at the NRC were available from January 1978 onwards. Because the increased number of strains received by the NRC related to the egg-associated SE infection epidemic of the1980s may have been amplified by its intense media coverage, and therefore by increased awareness of the general public and physicians, we limited our analysis to the period between 1992 and 2003 during which we assumed that such a potential surveillance bias was much more limited.
As their source of infection in humans is predominantly related to eggs, egg products and poultry meat consumption and since they were specifically targeted by the measures put in place by the Ministry of Agriculture and Fishing in 1998, Enteritidis and Typhimurium serotypes were used for our analysis. The control group comprised of serotypes that are rarely isolated from poultry based on data recorded by Salmonella animal surveillance in France [Reference Brisabois10]. They included S. Panama, S. Dublin, S. Derby, S. Wien, S. Kedougou, S. Ibadan, S. Litchfield, S. Oranienburg and S. Poona.
Analysis
When modelling time-series it is necessary to observe a long series of values in a stationary mode. The basic model employed is termed an autoregressive moving average model (ARMA), with certain adaptations included to accommodate series exhibiting non-stationary (e.g. trend) and seasonal variation. To identify such models, a procedure was proposed by Box & Jenkins [Reference Box and Jenkins11] and is now commonly referred to as the ‘Box & Jenkins’ approach.
Assuming that some change in the environment at a specific point in time t*, causes the mean of the series to change, it is possible to use special types of dummy variables called step functions and impulse functions to build intervention models. Note that the observations prior to the time period t* and those for t* and after should be drawn from the same ARMA model with change only to the means. Extension of the Box & Jenkins methodology for estimating intervention models is found in Box & Tiao [Reference Box and Tiao12]. It would not be appropriate to include even a brief description of the approach in this paper. Instead the reader is referred to various papers [Reference Chatfield13–Reference Harvey and Koopman17], all of which summarize the approach as well as giving examples of its application.
RESULTS
Descriptions of the time-series
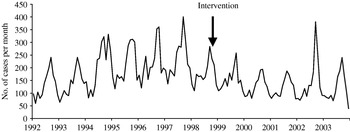
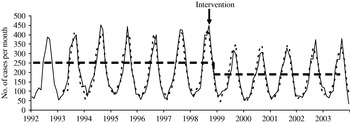
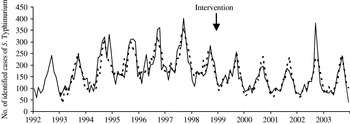
A total of 52 439 isolates of SE, 23 746 of ST and 6505 control isolates were received and serotyped by the NRC during the study period which included 144 months of observations. Salmonella multiplication is facilitated by a temperature of ⩾20°C, which means that there is a higher frequency of infections in summer than in winter. In accordance, the three time-series clearly exhibit a seasonality period of 12 months (Figs 1–3). No apparent secular trend was observed for SE and non-poultry serovars. However, for ST we observed a small increase from 1992 to 1997 and a decrease starting at the beginning of 1998 to 2000 which then seemed to stabilize afterwards, despite a higoher value in September 2002.

Fig. 1. Observed number of monthly cases of salmonellosis due to Salmonella Enteritidis, France, 1992–2003.

Fig. 2. Observed number of monthly cases of salmonellosis due to Salmonella Typhimurium, France, 1992–2003.

Fig. 3. Observed number of monthly cases of salmonellosis due to one of the nine non-poultry serovars, France, 1992–2003.
After the control programme was initiated (October 1998), monthly SE values became lower (Fig. 1), indicating a potential positive effect of the programme. For ST we also observed a decrease (Fig. 2) but this was 1 year before the control programme started. For non-poultry serovars, no decrease was observed (Fig. 3).
Model identification prior to the intervention
Since the intervention date is available, we first modelled series from January 1992 to October 1998 excluded. Inspection of the autocorrelation functions of the series shows a strong seasonality without any apparent trend (even for ST), so the seasonally different series Y t=X t−X t−12 (where {X t, t=1, 78} is the observed time-series) is modelled. Models were estimated by maximum likelihood using the arima procedure of SAS software [Reference Watier and Richardson16].
As can be seen below, all identified models are ARMA (p, q) which explains in an understandable manner the relationships between the observations with various terms dependence (autoregressive part) and a residual seasonality (moving average). This last term reflects small fluctuations in the periodicity of the series.
The estimated residuals are in accordance with a Gaussian white-noise series (independent normal variable with zero mean and constant variance).
The best model that we identified for SE series can be written as follows:
where Y t=X t−X t−12.
This model indicates a short-term dependence between the observations with significant parameters at lags 1 and 3. Indeed, the number of SE isolates recorded for month t depends on the number for the month before t−1 and 3 months before t−3. As mentioned above the identified model presents a residual seasonality (εt−12). Finally, it can be seen in Figure 4 that the fit of the models is good.

Fig. 4. Comparison of the observed values (––––) and one-step ahead forecast (- - - -) for Salmonella Enteritidis, France, 1992–2003.
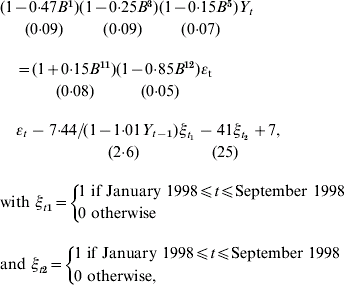
For ST, we identified the following multiplicative model:
where Y t=X t−X t−12 and B iX t=X t−i.
This is a more complex model than for SE which can be explained by the important number of different lysotypes which constitute the ST serotype.
However, the text below indicates a more long-term dependence between the observations (month t with months t−1, t−3, t−4, t−5, t−6, t−8 and t−9) with a short-term dependence (t−1, t−3, t−4, t−5) with higher parameters than for the longer terms (t−6, t−8, t−9) indicating a stronger link with previous observations. We also observed a residual seasonality with significant parameters at lags 11, 12 and 13 but with small parameters at lags 11 and 13.

As can be seen in Figure 5, the model fits well.

Fig. 5. Comparison of the observed values (––––) and one-step ahead forecast (- - - -) for Salmonella Typhimurium, France, 1992–2003.
For the control-series (Fig. 3) the time-series is very irregular. The series was modelled as an ARMA (1, 12).
where Y t=X t−X t−12.
This is the simplest model with a very short-term dependence and a small residual seasonality. Indeed, the number of recorded serotypes included in the control-series at month t only depends to those recorded 1 month before.
Intervention model
Assuming that the intervention does not affect the phenomena which generated the series prior to it, we used the model established for the period between 1992 and 1998 to model the series after. As the control measures took place after October 1998, we add to the entire study period (1992–2003) a function of intervention f(ξt)=ωοξt. The considered input is a unit step function ξt, with ξt=1 for all t greater or equal to October 1998 and ξt=0 elsewhere. We obtain the following model: Y t=f(ξt)+u t, with u t=the previously identified model. In accordance with the observed SE time-series, the response variable was a simple change in the means of the series which could arise with some delay.
We tested the effect of the intervention on different months starting from October 1998 and identified the following final statistical model:
with ![]() The time-series is therefore modelled as an ARMA function plus a step function that flags the occurrence of an event affecting the series after this date with a significant decrease observed as early as December 1998 (ξt+2), (Fig. 4). We note a short-term dependency, with the number of salmonellosis for a particular month depending on the number of salmonellosis found the month before (Y t−1) and 3 months before (Y t−3) and a residual seasonality (εt−12).
The time-series is therefore modelled as an ARMA function plus a step function that flags the occurrence of an event affecting the series after this date with a significant decrease observed as early as December 1998 (ξt+2), (Fig. 4). We note a short-term dependency, with the number of salmonellosis for a particular month depending on the number of salmonellosis found the month before (Y t−1) and 3 months before (Y t−3) and a residual seasonality (εt−12).
As ST displayed a progressive decrease since January 1998 compared to SE an intervention from January 1998 to October 1998 with a more complex response (a progressive decrease) allowing a delay was additionally introduced in the model. We identified the following model:

where Y t=X t−X t−12 and B iX t=X t−i.
For the control time-series, the simple intervention model described for SE was estimated. Introducing an intervention model did not detect any impact of 1998 control measures on the series.
In spite of the relatively low number of cases for this time-series, we observed a simple model close to the model for SE and ST with a short-term dependence and residual seasonality. If the number of strains in the control-series had decreased substantially, we would not have been able to construct an intervention model for the control-series because the number of remaining cases would have been too small. However, such a substantial decrease would have been detected by simply looking at the incidence curves, and we did not observe an important decrease. However, a small decrease in the number of cases would not hinder the calculation of a model. Therefore, we are not confident that, if such a decrease in the number of cases had existed, we would have been able to bring it to light.
For all analysed time-series, parameter estimates of the ARMA part of the intervention model are quite similar compared to those estimated before the control measures. Residuals are also in accordance with a Gaussian white-noise series. Concerning the potential effect of control measures, we found a significant single drop starting in December 1998 (−46·3ξt+2) for SE. This represents a reduction of 555 annual cases (95% CI 148–964, P=0·01) on the period December 1998 to December 2003 which corresponds to an average annual decrease of 21% after control measures were initiated.
For ST, a significant progressive decrease is observed from January 1998 until April 1999 [−7·44/(1−1·01Y t−1)] which accounts for about less than 85 cases per month (95% CI 13–136, P=0·01) compared to the previous period. From May 1999 onwards a decrease (![]() ) of 492 annual cases (95% CI 0–1092, P=0·10) compared to the period prior to implementation of the measures is also observed, although not statistically significant (P=0·1). The lack of statistical significance may relate to the previous intervention term included in the model. Indeed, introducing only one intervention function, as for SE, leads to a significant decrease of 864 annual cases (95% CI 187–1530, P=0·01) since May 1999. However, fit of this last model is not as good as the one previously presented. For the control-series, no change was observed after October 1998. Finally, our estimated intervention models fit well on the whole period as can be seen in Figure 5.
) of 492 annual cases (95% CI 0–1092, P=0·10) compared to the period prior to implementation of the measures is also observed, although not statistically significant (P=0·1). The lack of statistical significance may relate to the previous intervention term included in the model. Indeed, introducing only one intervention function, as for SE, leads to a significant decrease of 864 annual cases (95% CI 187–1530, P=0·01) since May 1999. However, fit of this last model is not as good as the one previously presented. For the control-series, no change was observed after October 1998. Finally, our estimated intervention models fit well on the whole period as can be seen in Figure 5.
DISCUSSION
Our study suggests a direct effect of the targeted measures against Salmonella implemented in 1998 in poultry breeding. By using intervention models we estimated an average decrease of 555 cases of SE per year, a decline of 21% compared to 1998 and no effect for the control-series. For ST, an average decrease of 492 cases per year was estimated after the intervention, although marginally significant (P=0·1).
The use of intervention models based on the method developed by Box & Tiao, allows us to retrospectively evaluate the effect of an intervention if appropriate data, all collected in the same manner and at regular intervals are available. The evaluation of an intervention using the ‘before–after’ or ‘here–there’ approaches has many limitations. It is necessary to control for a large number of factors which may have influenced the variable of interest, in order to ensure that the conditions of the study and the nature of the population do not vary too much between the two phases or places of the analysis. This information is also difficult to collect retrospectively. Within these limits, the method used in this paper appears to be an interesting and efficient compromise, provided that the data used were not biased.
The fast impact of the implemented measures on SE (starting in December 1998) may reflect the poultry industry's anticipation of the measures. In fact, before 1998 poultry breeders could participate voluntarily in official hygienic and sanitary control (OHSC) measures [Reference Drouin18] that promoted similar measures as those that became mandatory in 1998, although not for layer stocks and without the slaughter of positive flocks. The marginal effect of the intervention for ST may be explained by the fact that the 1998 intervention may have coincided with another event leading to a progressive decrease since January 1998 that could either reflect a natural reaction observed after the increase from 1992–1997 or a ‘pre-intervention’ effect. In this case, however, it would be difficult to explain why the same observation was not seen for SE.
The decrease seems less important for ST than for SE. This may relate to the extent of the measures put in place in October 1998. Unlike SE, the measures implemented for ST did not apply to layer flocks. It is probable that, despite the measures taken upstream, battery chickens remained contaminated with ST through the environment and could then transmit the contamination to their eggs. It is known that 47% of ST strains of animal origin do not come from poultry [Reference Brisabois10] with 40% of isolates being of bovine origin. In France, minced beef and raw-milk cheese producers have implemented stricter hygiene rules and regular tests for the presence of Salmonella on their suppliers with withdrawal of positive lots from the market (personal communication, G. Portejoie, French Ministry of Agriculture). These measures can be considered to have become fully operational in 1996 for the cheese production chain and in 1998, for the production of minced beef and have probably contributed to the decrease of ST that occurred before the full implementation of measures targeted to the poultry production.
The use of a control time-series allowed the comparison of the potential effect of the intervention on two series ‘exposed to the intervention’ to a ‘non-exposed’ time-series. The lack of a decrease in the control-series comprised of Salmonella serotypes is rarely found in poultry after the intervention is in favour of a causal effect of the intervention on the decreases seen for SE and ST since a decrease for the control-series would have probably reflected other concomitant phenomena, natural or not, that could have affected all Salmonella serotypes independent of specific measures taken in poultry breeding or a surveillance bias.
The data recorded by the NRC are not exhaustive. A limited proportion of patients infected by Salmonella seek medical attention and get a stool culture in a laboratory that sends Salmonella isolates to the NRC for serotyping. Although this surveillance system has limitations, we believe that it provides a reliable tool for monitoring trends of salmonellosis incidence in France. Strains received at the NRC come from acute cases of salmonellosis in most instances and the delay between onset and date of reception by the NRC is within 1–2 weeks. The surveillance system has been stable over time with about a third of French biomedical analysis laboratories (21% of 5679 private laboratories and 80·1% of 458 hospital laboratories in 1999) [ sending strains of Salmonella for serotyping to the NRC on a voluntary basis. The analysis of three years within our period of study: 1992, 1998 and 2003, reveals that 1524, 1497, and 1411 laboratories respectively participated in the surveillance of salmonellosis incidence. The slight decrease of participating laboratories is mostly related to the fact that small laboratories tend to group together in larger ones.
The relationship between the anti-Salmonella policy implemented in poultry breeding by the Ministry of Agriculture and Fishing, and the decrease in the number of cases of SE and ST infections in humans should also be interpreted with some caution because there was no randomization and the surveillance system, and although it was judged appropriate to monitor the trend of salmonellosis over time in France it may not be representative of the total population [Reference Vaillant19]. However, the laboratories that collaborate with the NRC are well distributed over France which limits a potential representativeness bias.
As not all laboratories participate in the surveillance system, the importance of the impact of the measures have probably been largely underestimated: the decrease of 555 cases of salmonellosis due to SE and 492 cases of salmonellosis due to ST prevented annually are therefore only a small proportion of the total number of cases prevented in the general population. Moreover, since hospital laboratories were the major contributors of strains to the NRC (80% of hospital laboratories compared to 21% of private laboratories), i.e. stains from more seriously ill patients, the decrease that we quantified probably applies mostly to more serious cases.
A similar decrease of salmonellosis have also been observed in several other European countries that implemented control measures in poultry breeding following the European directive of December 1992. Great Britain introduced the systematic vaccination of its breeds against SE and ST and observed a decrease of cases of salmonellosis after 1997 [Reference Cogan and Humphey20]. However, four countries had an increase for the two serotypes despite the European directive [Reference Fisher1], but none had introduced effective measures against Salmonella in poultry breeding. Time-series and intervention models could then be used to evaluate the impact of measures taken against Salmonella in poultry breeding in other European countries. In France, a decrease in the number of salmonellosis cases caused by other avian serotypes such as S. Hadar or S. Infantis has also been observed [Reference Grimont and Bouvet9]. This may suggest an indirect effect of the measures implemented in poultry breeding on these serotypes but requires further evaluation.
Despite the positive impact of the measures implemented in 1998 the number of human cases of SE and ST remains high and epidemics still occur. A reinforcement of the control measures is consequently needed. A modification of the directive which appeared in February 2003 [21], extends the 1998 measures to include other avian serotypes and to other species, for instance turkeys. Complementary measures, notably in the layer channel, can be envisaged, particularly for ST. These additional measures are, however, expensive and cost-effectiveness analysis of their additional benefits will be needed.
We must not, however, overlook the fact that the prevention of Salmonella infection relies also on the improvement of hygiene measures all along the food chain through the hazard analysis control critical point (HACCP) approach, and by individual education on food hygiene and practices such as the appropriate cooking of meats and eggs, particularly among high-risk groups.
DECLARATION OF INTEREST
None.


