Introduction
Avalanche forecasts vary according to spatial and temporal scale and data collected or information available before making a forecast. A systematic approach to verification can profit from a classification system for forecasts. Such a system is presented for the first time in this paper, based on time and spatial scales and data available.
In avalanche forecasting, errors increase if model constraints and data input do not match the scales (time and spatial) or if redundant variables or prediction categories are retained. Given the variety and classes of forecasts there can be two stages to verification: (1) ensuring that data available and model constraints match the scales (time and spatial) and that only variables or portions of the model which are necessary are retained, and (2) verification of the corrected model using data from field testing. It is not useful to proceed to verify a model which is not a physical match for the problem attempted. In this paper, I discuss the process and present an example of the first stage of verification for the experience-based public-danger scale for back-country warnings. The analysis results in a simplified scale which takes into account human perception, the root cause of most back-country avalanche accidents.
Classification of Avalanche Predictions
To provide a framework to discuss verification of avalanche forecasts, it is useful to classify forecasts in relation to data used. The discussion here is in two parts: classification of the data used in avalanche forecasting, and the classification scheme in terms of data predicted or measured/observed. The classification scheme follows the logic of Reference LambeLambe (1973) for geotechnical predictions. To frame the discussion, it is useful to have the definition and goal of avalanche forecasting. I propose these as:
Definition: Avalanche forecasting is the prediction of current and future snow instability in space and time relative to a given triggering (deformation energy) level.
Goal: The goal of avalanche forecasting is to minimize the uncertainty about instability introduced by the temporal and spatial variability of the snow cover (including terrain influences), any incremental changes in snow and weather conditions and any variations in human perception and estimation.
Data used in forecasting
Data used to forecast avalanches consist of two general types: singular or case data about the specific situation at hand, and distributional data and information about similar situations in the past. The classification system below is stratified according to measurements or observations of singular data, but both singular and distributional data will normally be used to make a forecast. Distributional data (information) are not measured to make a forecast, but are contained in experience, rule-based expert systems or calculations such as nearest neighbours (Reference Buser, Butler and GoodBuser and others, 1987) from computer models.
Individual data elements can be further classified according to their informational entropy: the relevance and ease of interpretation for prediction of avalanche occurrences (Reference LaChapelleLaChapelle, 1980, Reference LaChapelle1985; Reference McClung and SchaererMcClung and Schaerer, 1993). Three general classes are identified:
-
III. Snow and weather data: mostly numerical, measured at, near or above the snow surface
-
II. Snowpack factors: data from the snowpack including snow structure, layering, snowpack parameters: mostly non-numerical
-
I. Stability factors: data such as stability tests which give direct information about avalanches (including avalanche occurrences).
Reference McClung and SchaererMcClung and Schaerer (1993) provide a comprehensive discussion of the factors. In general, the higher the class, the higher the informational entropy (uncertainty) with respect to prediction.
Classification scheme
Following Reference LambeLambe (1973), I place predictions into three main categories in terms of uncertainty in data and measurements available. The categories and descriptions are given in Table 1. The aim is to present an approximate method to class forecasts to frame discussion of verification.
Table 1. Classification for avalanche predictions
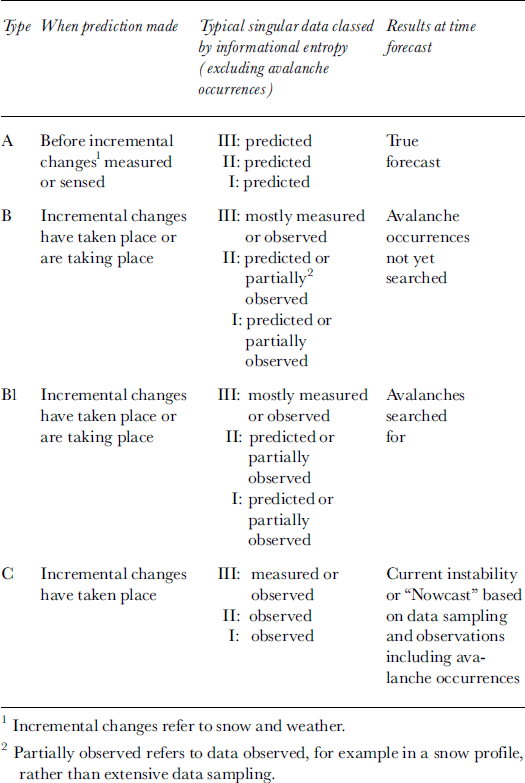
Almost all initial (early-morning) forecasts in ski or highway operations are type B since snow and weather observations are taken and sometimes stability tests are performed in a snow profile but often avalanche occurrences are not yet scanned for. Type A forecasts depend heavily on the accuracy of weather forecasts including snowfall, and, as such, they contain the inherent uncertainty of weather forecasts as well as the effects on snowpack instability Good snow and weather forecasting, combined using SAFRAN, Crocus and MEPRA models in France (Reference Durand, Giraud and MérindolDurand and others, 1998), provides a type A forecast. Prediction of the public-danger scale for 48 and 72 hours in advance (Reference Cagnati, Valt, Soratroi, Gavalda and SellesCagnati and others, 1998) is also a type A forecast. Type C forecasts are typically made in helicopter skiing operations or back-country travel after avalanche occurrences are scanned for and stability tests and skiing have been performed.
Typically, as the forecast progresses from A to C, the spatial scale of the forecast reduces and more information is sought. A type A forecast is usually targeted toward the synoptic or meso-scale, whereas type B forecasts are usually targeted toward the meso-scale. Type C forecasts are usually sought in back-country skiing including helicopter skiing where interest is on the micro-scale and extensive information is sought to make predictions for particular ski runs or terrain features. In general, as the scale of forecasts decreases, the difficulty increases (higher accuracy is sought) and people compensate by seeking more information, particularly of low entropy. The reader is referred to Reference McClung and SchaererMcClung and Shearer (1993) for a discussion of spatial scales in avalanche forecasting.
Avalanche forecasting is not an event, but an evolutionary process by which the forecast is updated as more information is collected. Table 1 reflects this evolutionary process as time proceeds. Back-country travellers often begin with only synoptic-scale information (e.g. type A or B such as public-danger scale bulletins), and this must be updated with low-entropy data to produce an optimal forecast relevant to the micro-scale (e.g. type C).
The reduction method (Reference MunterMunter, 1997) is a proposal to bypass low-entropy data collection such as stability tests or other information from snow profiles for micro-scale forecasting, but such a proposal can be easily discounted under conditions of highest probability of involvement (see Analysis section below) when avalanche occurrences may not be available. In these cases, other low-entropy data are of vital importance (Reference Fohn, Schweizer and SivardiereFöhn and Schweizer, 1995) and variations in human perception are greatest. There are no short-cuts to good avalanche forecasting.
Verification of Avalanche Forecasts
Verification of avalanche forecasts is linked to the spatial scale that forecasting is made for. Reference McClung and SchaererMcClung and Schaerer (1993) discuss three scales for forecasting: synoptic (a significant portion of a mountain range: order of 10 000 km2), meso (spatial scale such as a highway avalanche area or a typical ski area: about 100 km2) and micro (for an individual ski run or terrain feature including back-country skiing: ω1 km2). As the scale decreases, the need for accuracy increases, the forecast progresses from the general to the specific, and the verification problem changes from general to specific.
Verification at the synoptic scale (e.g. Reference Elder and ArmstrongElder and Armstrong, 1987) may consist of looking at the general picture of avalanche occurrences. Verification at the micro-scale requires extensive data sampling including test skiing, test profiles and avalanche-occurrence information.
Statistical models including neural networks, parametric discriminant analyses, non-parametric discriminant analyses (nearest neighbours) and expert systems are nearly all built using distributional data, and these models are normally applied at the meso-scale. Any such model built on distributional data cannot legitimately be verified by use of the data it is built on. Also, such models are valid only for the location from which training data are taken. They provide mostly type B forecasts.
Experience with computer-assisted forecasting (Reference McClung, Hipel and LipingMcClung, 1994; Reference Fohn, Schweizer and SivardiereFohn and Schweizer, 1995; Reference Schweizer and FohnSchweizer and Fohn, 1996) has shown that maximum expected accuracy is about 60–65% unless the expert help is applied (Bayesian statistics or interactive expert system), in which case accuracy improves to 70–75%. This is because data input consists largely of class III information which must necessarily give an incomplete picture of instability For example, the expert system MODUL of Reference Schweizer and FohnSchweizer and Fohn (1996) provides a type B forecast using class III, class II and class I (usually unavailable) information to achieve 70–75% accuracy. Similarly the study of Reference McClung, Hipel and LipingMcClung (1994) on verification of a numerical meso-scale forecasting model showed that the forecaster’s input of judgemental information (e.g. Bayesian prior), which can include class II and I information, must be combined with numerical predictions to achieve 70–75% accuracy.
Analysis: Public Danger-Scale Bulletins for Back-Country Applications
When verification of a model is attempted, it is often assumed that the model provides an adequate picture of reality and that the physical definition of the model is correct. The five-part public-danger scale was developed from extensive practical experience and data on avalanche occurrences, and there are now enough data on fatalities and accidents to perform simple analyses of the scale with respect to a parsimonious model for the number of prediction classes. Reference Fohn, Schweizer and SivardiereFohn and Schweizer (1995) and Reference Cagnati, Valt, Soratroi, Gavalda and SellesCagnati and others (1998) looked at verification of the five-part danger scale. I prefer first to use data on statistics of deaths and accidents to assess whether the model might be simplified or improved for back-country use: the first stage in model verification.
In this section, I present a simple analysis for the five-part public-danger scale as used in North America and Europe, with statistics on fatalities and accidents from Switzerland and France used to assess the model. The data include statistics on the deaths recorded (Switzerland: ten winters of data, 255 fatalities, 1981–91), accidents (involvements: including death, injury or avalanche release affecting people) recorded (France: five winters of data, 166 accidents, 1993–98) in each portion, Dk(k = 1,2,3,4,5: low, moderate, considerable, high, very high or extreme) of the danger scale and the fraction of time (exposure) that the danger scale was applied for each class (for typical descriptions of danger-scale classes and how they are applied in practice from data and experience, see Reference MeisterMeister, 1994; Reference Cagnati, Valt, Soratroi, Gavalda and SellesCagnati and others, 1998). The result of the analysis (given below) is that for back-country use a simpler model is possible by reducing the danger scale to four classes, with adjustment to account for variations in human perception.
Avalanche forecasting, including decisions, is part of a risk analysis. As such, there is a probabilistic nature to the problem which shapes the nature of forecasts including the number of reasonable levels or categories for the danger scale. When the danger level is specified by a forecaster, the result is a function of human perception of the forecaster which is conditioned by observations and judgemental estimates about the temporal and spatial state of instability of the snow cover. A back-country traveller using the danger-scale forecast makes use of it but adds his or her own perception of the situation. The result is that decisions are filtered through human perception from at least two sources. The number of levels in the danger scale and the wording attached to those levels can therefore have significant effects upon decisions. The number of levels should be consistent with an order-of-magnitude probabilistic analysis (not too many levels), and the descriptors attached to the levels should take into account human perception and its variations as contained in the goal of avalanche forecasting. The great majority of avalanche accidents and fatalities in western Europe and North America now occur in the back country (see Reference McClung and SchaererMcClung and Schaerer, 1993), and most of these are caused by human triggering. Thus, a major source of fatalities and accidents is failure in human perception: people perceived the state of instability of the snow cover to be something other than what it was. Any system for forecasting avalanches in the back country which does not take into account human perception is incomplete.
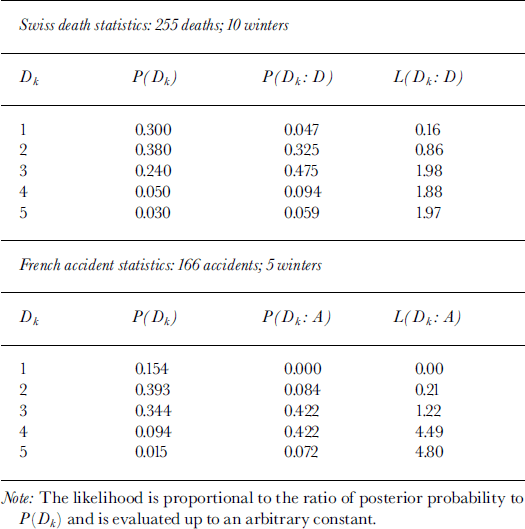
Since avalanche forecasting is related to a probabilistic risk analysis, it is useful to analyze data about the danger scale in a probabilistic sense. For the danger scale, I define a temporal exposure probability P(Dk) as the fraction of time for which danger-scale level Dk is applied. I define a conditional probability P(D : Dk) as the probability that death (D) occurs given that level Dk is applied, and similarly P(A : Dk), with A (accident) replacing D (death). The quantities P(D : Dk) and P(A : Dk) are both defined only if death or accident is assumed to occur, and they are both related to the likelihood of death or accident. Similarly, I define the conditional probabilities P(Dk : D) and P(Dk : A) as the probabilities that death or accident occur in Dk (given death or accident). The latter probabilities define posterior probabilities in a given danger level Dk in Bayes’ theorem as posterior probability α likelihood × exposure. By application of Bayes’ theorem, the posterior probability is obtained:

where C is a normalization constant, C = P(D). From the above equation, the likelihood L(Dk : D) is proportional to P(Dk : D)/P(Dk) up to an arbitrary constant (Edwards, 1992). The equation gives the elements of a probability mass function (pmf) for the posterior probability, P(Dk : D), combining likelihood and temporal exposure in danger level k if death occurs. An analogous expression for accident can be written by substituting A for D. The probability and likelihood elements are given in Table 2.
Table 2. Posterior probability for deaths (P(Dk: D)) and accidents (P(Dk:A)) and likelihood for deaths (L(Dk:D))andaccidents(L(Dk:A))
Analysis Results
Table 2 and Figures 1 and 2 show that maximum posterior probability is around the considerable (k = 3) range. Of further interest is that, for the posterior probability, the fraction of the pmf contained in danger level 5 is 0.059 (Swiss deaths) and 0.072 (French accidents). This suggests that overall posterior probability in danger level 5 (which combines time exposure in a danger-scale class k and likelihood in the class k) is a small proportion of the total pmf. I also analyzed data fromTyrol, Austria (46 fatalities; 5 years of data, 1993–98), and the results are similar to those produced by the Swiss data: ≥ 8 0% of the deaths occur in the moderate-considerable range, with none of the posterior probability or fatalities in danger level 5.
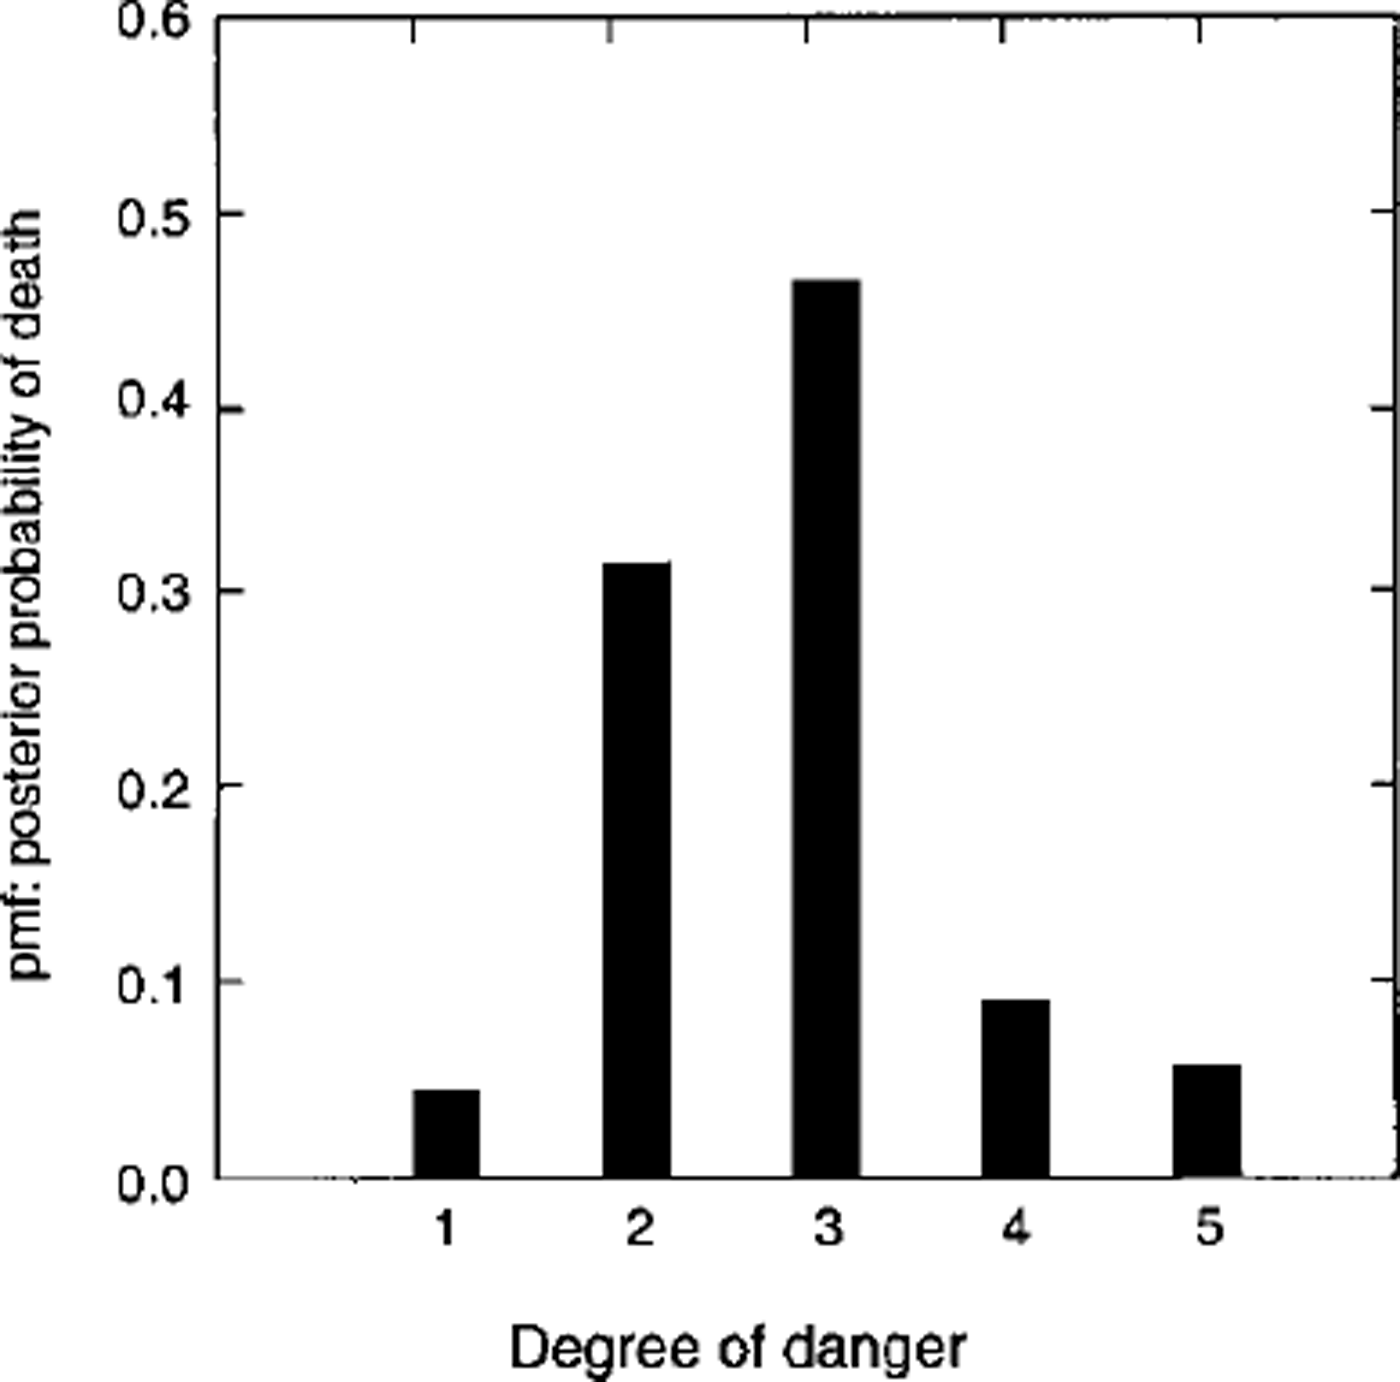
Fig. 1. Probability mass function (Pmf): posterior probability of death for public-danger scale levels 1 (low), 2 (moderate), 3 (considerable), 4 (high) and 5 (very high or extreme). Data are from fatalities in Switzerland.
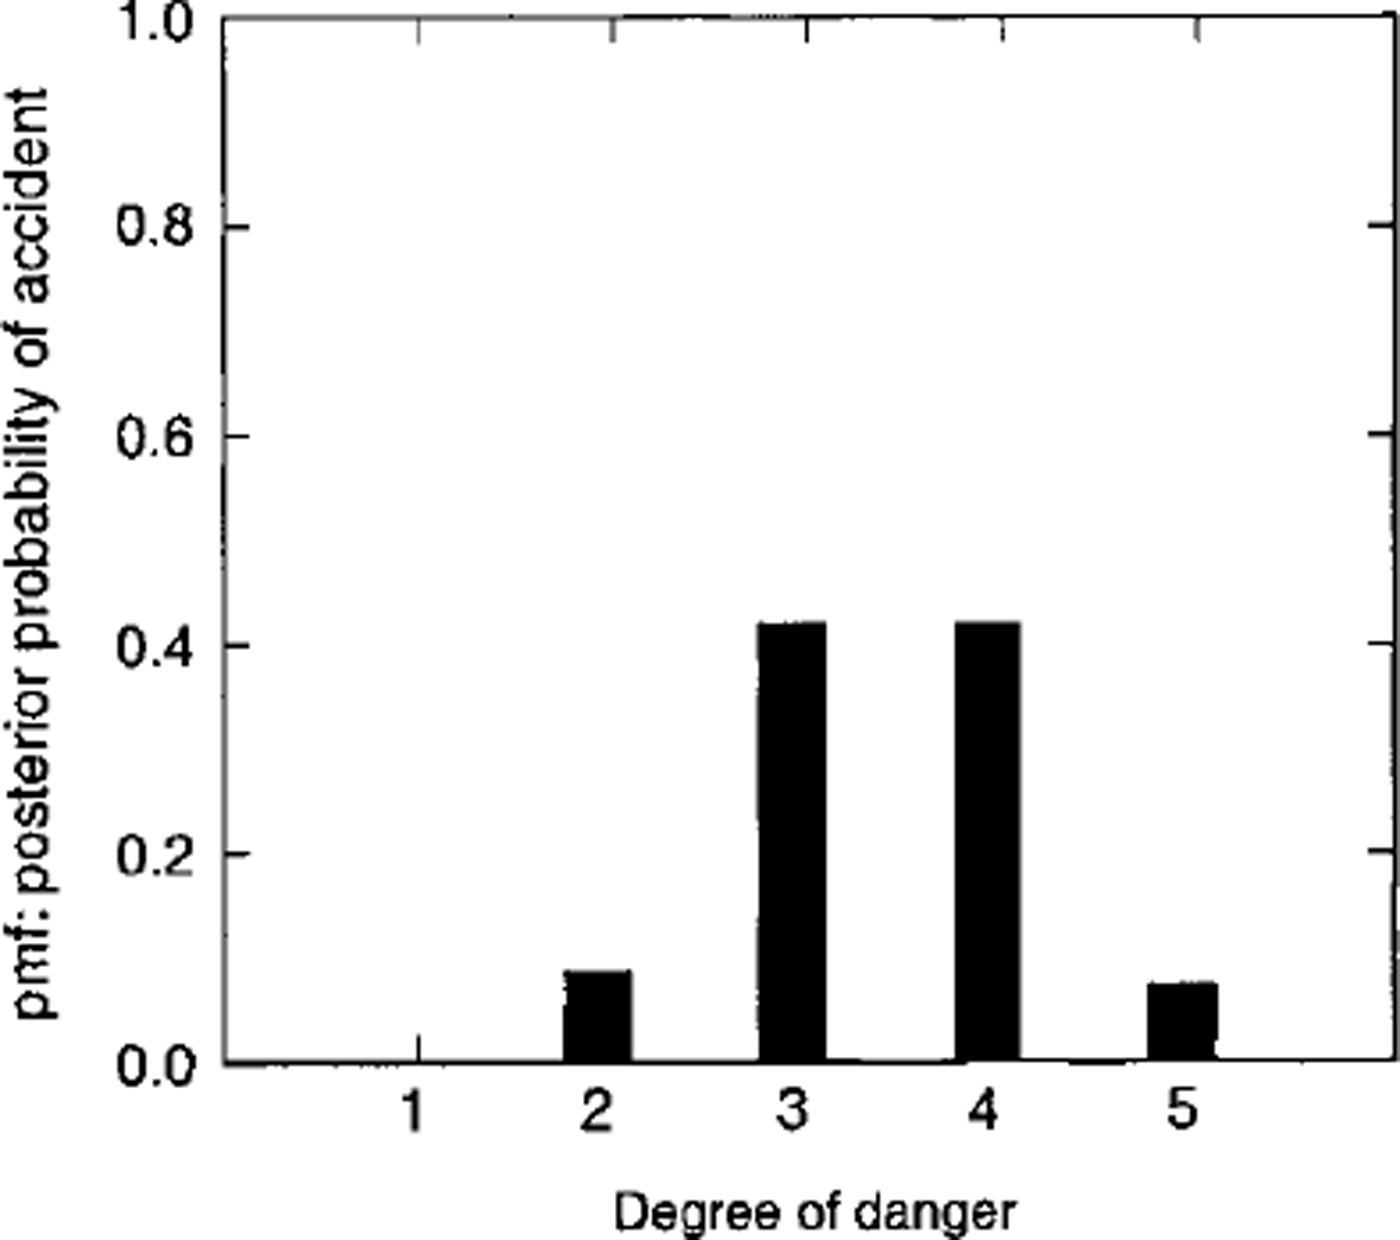
Fig. 2. Probability mass function (Pmf): posterior probability of accidents for public-danger scale levels similar to Figure 1. Data are from accidents in France.
Given that accident or death occurs, the likelihood expresses the likelihood of its occurring in Dk up to an arbitrary constant. Figure 3 shows the likelihoods for the death and accident statistics. For the present data, from Swiss death statistics, there is essentially no support for a hypothesis that deaths are more likely in level 5 than in level 4 or 3. French accident statistics show that accidents are slightly more likely in level 5 than level 4. Both datasets show that the likelihood increases sharply from the moderate (k = 2) to the considerable (A: = 3) level.
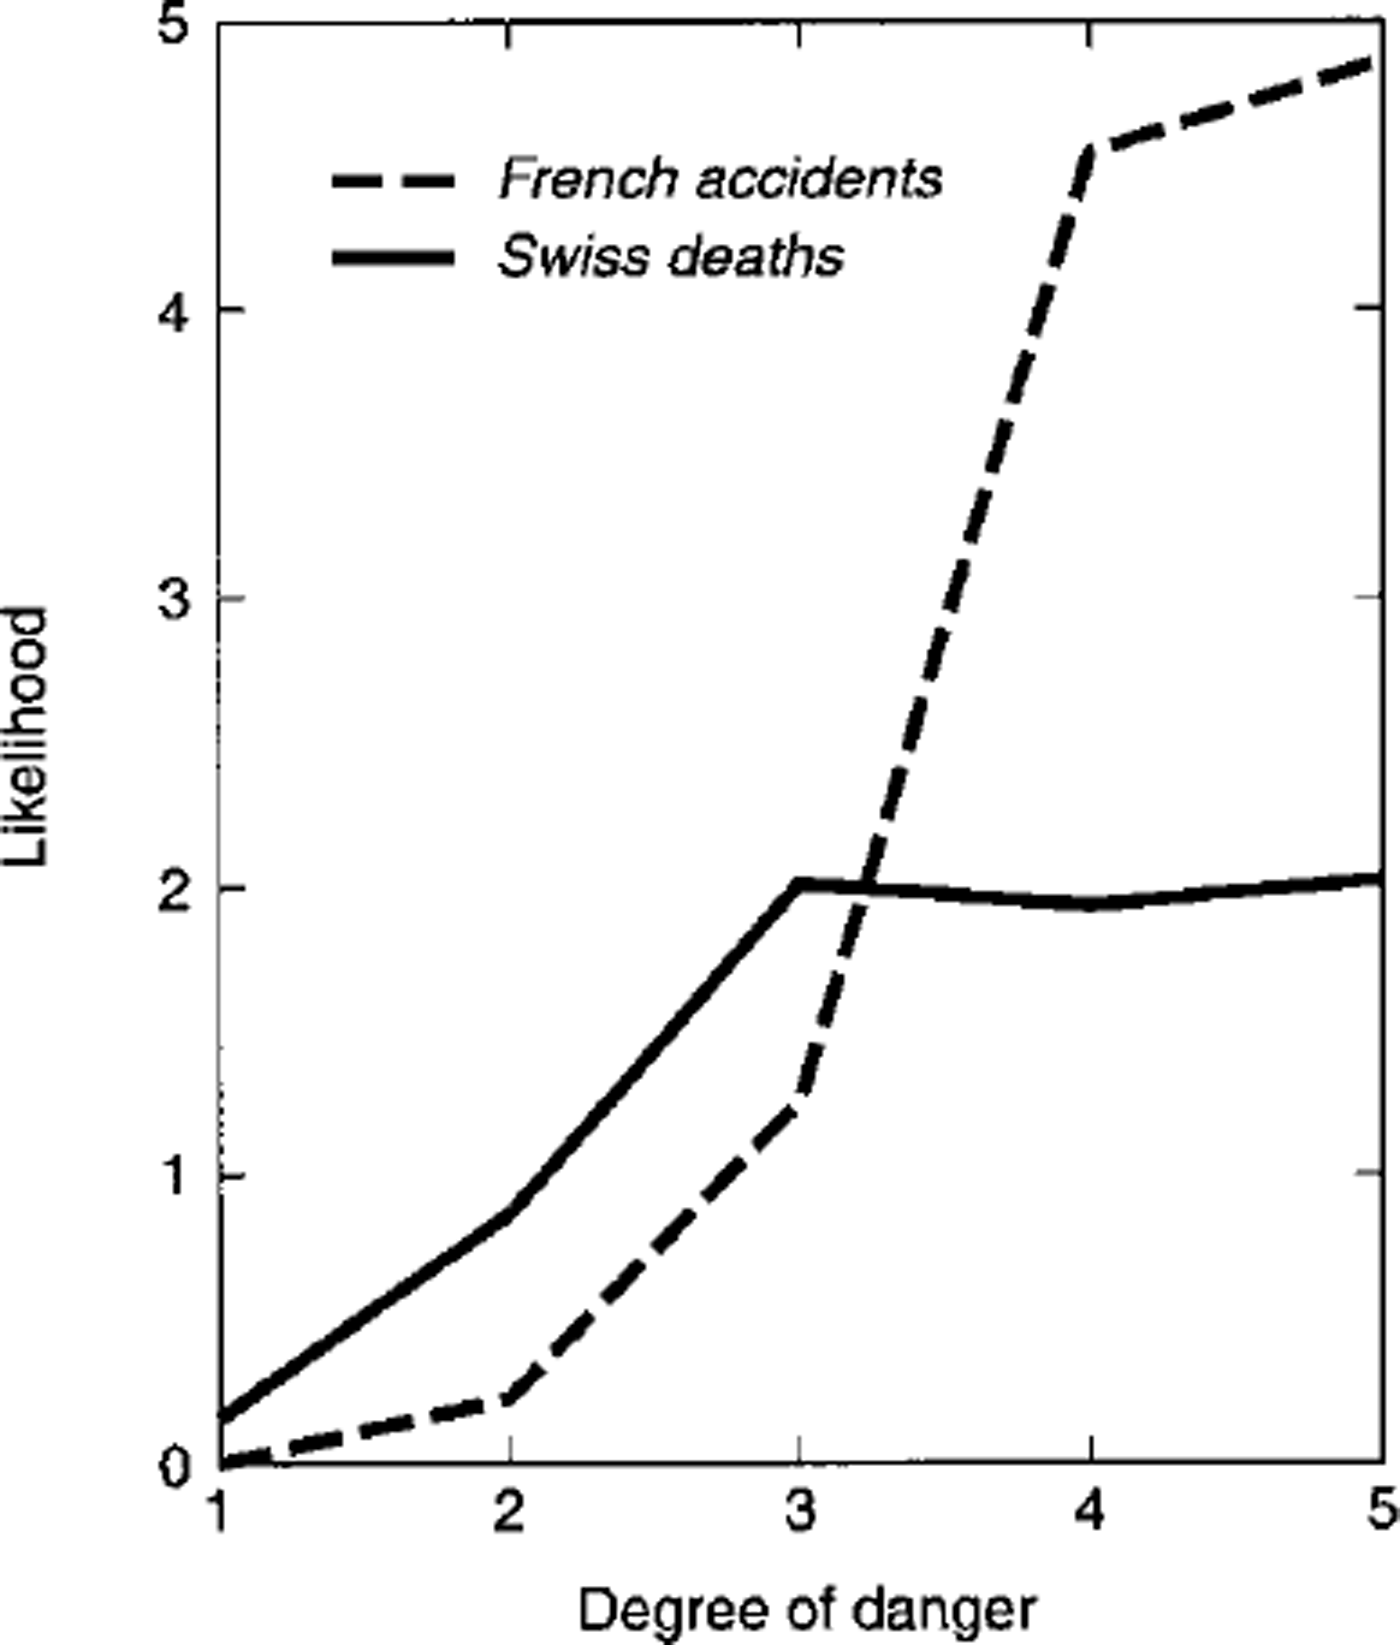
Fig. 3. Likelihood values that accidents or deaths occurper day of exposure vs danger-scale level.
The posterior probability and likelihood results can be combined to provide a suggestion for a simplified scale. The relatively low posterior probability in level 5 and the lack of sensitivity of likelihood in going from level 4 to 5 suggests that for back-country use levels 4 and 5 could be combined into one level, resulting in simpler scale: low and moderate (k = 1 and 2) could remain the same, with considerable (k = 3) called high to represent high probability and the jump in likelihood, while high (k = 4) and very high (k = 5) could both be called very high.
Both likelihood (L(Dk : Dor A)) and posterior probability (P(Dk : Dor A)) are important for avalanche forecasting. On a given day with a danger level specified by a forecast, one is most interested in the likelihood of death or accident for the day. The estimates in Table 2 (column 3: posterior probability) contain implicit information in terms not just of number of people exposed and time of exposure but also of variations in human perception. Both the posterior probability and the likelihood estimates are of interest for model assessment.
Both likelihood and posterior probability contain information (not precisely known) about the number of people exposed, since specification of the danger level influences that number. The unknown number of people exposed prevents a full, formal risk analysis but does not affect the Bayesian analysis above since the assumptions for application of Bayes’ theorem are not violated.
Likelihood-Function Models
I made numerical models of the likelihood values, P(Dk : D)/P(Dk) and P(Dk : A)/P(Dk), and the expresions are:

For the Swiss data on fatalities a similar expression was derived:
and a × 2 (chi-square) goodness-of-fit test to fatality numbers gave X 2 = 9.5 with 4 degrees of freedom (a = 0.05), indicating a good fit. These results indicate that likelihood increases approximately in a logarithmic fashion with Dk, and they mirror the lack of sensitivity of the ratios to Dk for k = 4 and 5, as implied by the data. The logarithmic dependence is encouraging since it is consistent with order-of-magnitude estimates typical of formal risk analyses.
Discussion
Avalanche forecasting is analogous to a probabilistic analysis to gauge the snowpack instability in space and time relative to a given triggering level. When human activity is contemplated and decisions are included, it becomes a risk analysis. Risk analyses normally proceed by order-of-magnitude estimates with a limited number of useful risk classes.
Any model gives an imperfect picture of reality in avalanche forecasting, and no model can be expected to predict accurately effects which are not contained in data input (entropy classes). The first stage in model verification may consist of correcting model deficiencies and/or illuminating inadequacies. Table 1 provides a framework for discussing forecast type based on scale in space and time and on data available. Once model input and predictive capability matches the physical problem, including scale and type, a second stage of verification can be appropriate. It is not useful to proceed with verification for models with a proliferation of parameters or mismatch of scale, data input, physical problem and model output.
The only data readily available to assess model characteristics for the public danger scale are low-entropy data from accident and death statistics and avalanche occurrences (or lack of them). In common with other aspects of avalanche-forecasting modelling, both high- and low-entropy data are used to specify Dk, including human experience, and verification must also involve high- and low-entropy data (Reference Fohn, Schweizer and SivardiereFohn and Schweizer, 1995).
The public danger scale was developed mainly from human experience and data on avalanches, but quantitative analysis suggests a simplified scale for application in the back country. The overall posterior probability (time exposure and likelihood in a danger class) contained in category 5 is fairly low (about 6–7% of the pmf) and the likelihood is nearly independent of Dk for categories 4 and 5. These results suggest that the scale could be simplified by calling D3 high and both D4 and D5 very high. In addition to a simpler scale, such modification would mean that the category with highest overall posterior probability and sharply increasing likelihood (from moderate to considerable) would be called high instead of considerable, giving a stronger warning signal to the public. Since most deaths and accidents in Western countries are caused by human triggering, the root cause of such accidents is a failure in human perception, which is something the danger scale should take into account.
For back-country applications, the same level of caution for human activities should be used for categories 4 and 5 so that decision changes would be minimal for these levels. However, the proposal here is for a higher level of caution for category 3 where it is most needed: accidents and fatalities are most prevalent and likelihood sharply increasing. In category 3, more people are exposed than at level 4 or 5 and variations in human perception of instability in the snow cover are expected to be greatest. The goal of avalanche forecasting includes reducing such variations.
From data analyzed thus far, the likelihood of death or accident increases approximately with the logarithm of Dk. This is encouraging since the forecasting process should mirror a probabilistic risk analysis with order-of-magnitude changes between danger levels.
The analysis in this paper applies only to danger-level warnings for back-country applications, not facilities or villages.
Acknowledgements
This research was funded by Canadian Mountain Holidays, Forest Renewal BC, the Natural Sciences and Engineering Research Council of Canada, and the Vice President Research and the Peter Wall Institute for Advanced Studies, both at the University of British Columbia. I am extremely grateful for this support. Data on Swiss fatalities were supplied by the Swiss Federal Institute for Snow and Avalanche Research, and data on French accidents by Association Nationale pour l’Etude de la Neige et des Avalanches (ANENA) and Météo France. Data from Tyrol were supplied by the Tyrol Avalanche Forecasting Office, Innsbruck. I am grateful for this generous sharing of information. The editing of P. Fohn and the suggestions of two able referees are gratefully acknowledged.


