INTRODUCTION
The nutritional requirements of broiler breeders (BBs) and the effect of dietary energy and nutrients on their performance have been reported previously (Latour et al. Reference Latour, Peebles, Boyle, Doyle, Pansky and Brake1996; Peebles et al. Reference Peebles, Zumwalt, Doyle, Gerard, Latour, Doyle and Smith2000a, Reference Peebles, Zumwalt, Doyle, Gerard, Latour, Doyle and Smithb). It has been demonstrated that the levels of dietary metabolizable energy (ME), crude protein (CP), amino acids and level of feed intake play an important role in BB performance in both maintenance and egg production (Wilson & Harms Reference Wilson and Harms1986; Harms & Ivey Reference Harms and Ivey1992; Harms & Russell Reference Harms and Russell1998). Investigating nutritional strategies to assess the production of poultry is a long-term task, expensive to conduct. Neural network (NN)-based methods are a relatively new option to model growth and production in animal systems. The NN model is a biologically inspired computing scheme that can uncover highly complex relationships between several input and output variables. A detailed description of NN terminology, development and application has been reported by several researchers (e.g. Cheng & Titterington Reference Cheng and Titterington1994; Basheer & Hajmeer Reference Basheer and Hajmeer2000). One sub-model of NN is the group method of data handling-type NN (GMDH-type NN) with an evolutionary method of genetic algorithm (GA; Nariman-Zadeh et al. Reference Nariman-Zadeh, Darvizeh and Ahmad-Zadeh2003). This approach has been applied successfully in several fields of poultry science (Ahmadi et al. Reference Ahmadi, Golian, Mottaghitalab and Nariman-Zadeh2008; Mottaghitalab et al. Reference Mottaghitalab, Faridi, Darmani-Kuhi, France and Ahmadi2010; Faridi et al. Reference Faridi, Mottaghitalab, Darmani-Kuhi, France and Ahmadi2011). The final form of this model is represented as polynomial equations (Farrow Reference Farrow and Farrow1984). Conducting a sensitivity analysis (SA) on the obtained polynomial equations reveals the sensitivity of model output to input variables. In other words, SA increases confidence in the model and its predictions by providing an understanding of how the model responds to changes in its inputs. Moreover, the SA identifies critical regions in the space of the inputs, establishes priorities for research and simplifies the model (Castillo et al. Reference Castillo, Minguez and Castillo2008; Saltelli et al. Reference Saltelli, Ratto, Andres, Campolongo, Cariboni, Gatelli, Saisana and Tarantola2008). Although the use of NN and SA techniques has led to successful application in a broad range of areas (Kucuk & Derebasi Reference Kucuk and Derebasi2006; Seyedan & Ching Reference Seyedan and Ching2006; Lee & Hsiung Reference Lee and Hsiung2009), the use of SA along with NN models is uncommon in poultry science. The aim of the present study was to use the GMDH-type NN to model early egg production (EEP) in BB based on the dietary intake levels of ME, CP, and the two first limiting amino acids, methionine (Met) and lysine (Lys). The SA method was utilized to evaluate the relative importance of input variables on model output and to determine the optimum levels of nutrient intake for obtaining the maximum EEP in BB.
MATERIALS AND METHODS
Data source
Data used in the current study were obtained from two local commercial BB farms (at Mazandaran, Iran, 36°28′E, 52°7′) (Ross 308) during EEP (24–29 weeks). Data were collected from three flocks, with 12 saloons (rooms within a poultry barn) each, where each saloon provided a data line. The average number of birds in each saloon was 3500, with initial weight of 3·05 kg at 24 weeks of age. In that period, the flocks produced 67 data lines. Each data line consisted of average dietary intake levels of ME (MJ/bird/day), CP (g/bird/day), Met (g/bird/day) and Lys (g/bird/day) and weekly egg production (eggs/bird) during 24–29 weeks of age. All flocks were in the first cycle of production and fed with maize–soybean meal diets. The feeding programmes were based on the Ross parent stock company (Ross Breeders Ltd 2005). The composition and calculated content of some of the BB diets in the production period are shown in Table 1. Forty data lines were randomly extracted and used to train the GMDH-type NN and the remainder (n=27) to test the model. Samples of the data pattern belonging to training and testing sets used to develop NN model in BB during EEP are shown in Table 2, while the range of data lines used to develop the GMDH-type NN model for EEP in BB are summarized in Table 3.
Table 1. Composition and calculated contents of some of the commercial diets fed during the production period (g/kg)
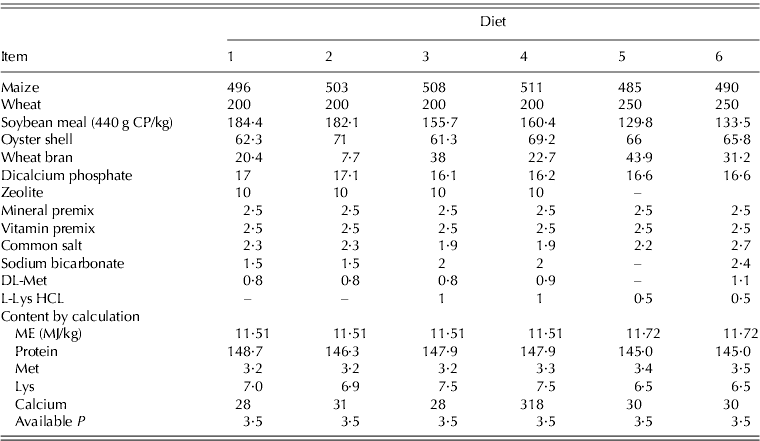
Table 2. Sample of training and testing sets (10 lines of each) used to develop the NN model for the EEP model in BB
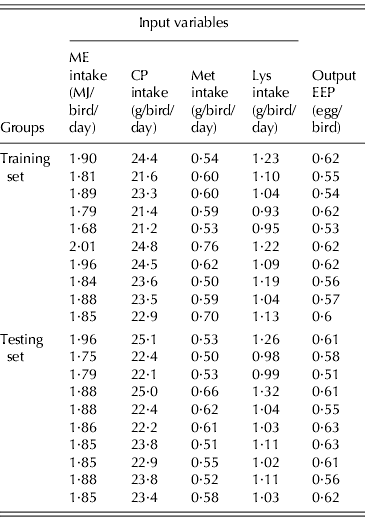
Table 3. Ranges of data (n=67) used to develop the group method of data handling-type neural network model for EEP in BB

* ME, metabolizable energy (MJ/bird/day); CP, crude protein (g/bird/day); Met, methionine (g/bird/day); Lys, lysine (g/bird/day).
† EEP, eggs/bird; the egg production is average production for 24–29 weeks of age.
Model development, SA and statistical procedures
In the present study, the GMDH-type NN with GA method was used to develop the EEP in BB. By means of the GMDH algorithm, a model can be represented as a set of quadratic polynomials. In this way, GA are deployed to assign the number of neurons (polynomial equations) in the network and to find the optimal set of appropriate coefficients of the quadratic expressions. Detailed descriptions of GMDH-type NN with GA method model terminology, development, application and examples of using this approach have been reported by several researchers (Atashkari et al. Reference Atashkari, Nariman-Zadeh, Pilechi, Jamali and Yao2005; Nariman-Zadeh et al. Reference Nariman-Zadeh, Atashkari, Jamali, Pilechi and Yao2005). The variables of interest in this model were the dietary intake levels of ME (MJ/bird/day), CP (g/bird/day), Met (g/bird/day), Lys (g/bird/day) and weekly egg production (eggs/bird) during early production (from 24 to 29 weeks of age). Datasets were imported into the software GEvoM for GMDH-type NN training (GEvoM 2009).To find the best structure, the GA parameter values of 600 generations, cross-over probability of 0·85 and mutation probability of 0·1 were set. However, the model produced by the GMDH-type NN is in the form of a complex equation and the effect of an input variable on the model is not clearly evident. Researchers are even more interested in the interpretability issue rather than the accuracy of the models, thus SA of the obtained model is carried out to evaluate the input parameters’ influence on model output. SA is the study of the relationship between the input and output of a model. In this way, the proposed EEP model is subjected to SA. Most of the SA met in the literature is based on derivatives. Indeed the derivative (∂y i/∂x i) of an output (y j, e.g. EEP) v. an input (x i, e.g. ME, CP, Met and Lys) can be inferred as a mathematical definition of the sensitivity of model output v. input variables (Zurada et al. Reference Zurada, Malinowski and Cloete1994; Saltelli et al. Reference Saltelli, Ratto, Andres, Campolongo, Cariboni, Gatelli, Saisana and Tarantola2008). In fact in this method, model output is derived with respect to each input variable. These derivations are represented as polynomial equations that are plotted in a special range for each investigated input variable while the other input variables postulated as a constant value. The plotted curve can be used to compare the sensitivity of model with variables, determining the most influential input and selecting the optimum value to optimize the output. In other words, maximum sensitivity of each input variable is considered as optimum value for maximizing the EEP model. The SA procedures were conducted using MATLAB software (Matlab Company 2008). The accuracy of the model was determined using coefficient of determination (R 2), mean square error (MSE), root mean square error (RMSE), mean absolute deviation (MAD) and bias.
RESULTS
The optimal structure of the evolved two-hidden layer GMDH-type NN was produced from the GA for modelling the EEP found with only two hidden neurons. This structure of the developed NN model reflects the design of the GA. The polynomial Eqns (1)–(3) show the quantitative relationships between input and output variables. These polynomial equations were obtained as


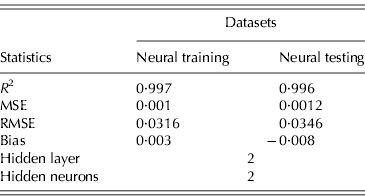
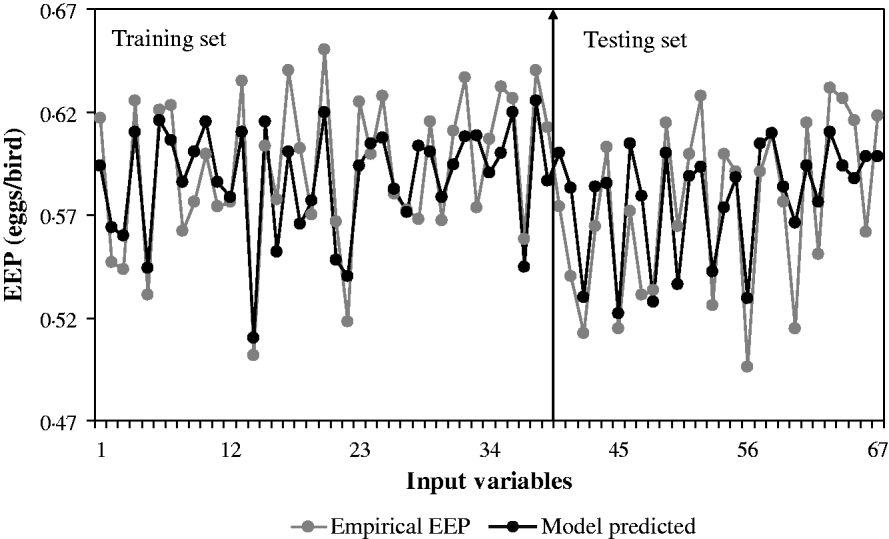
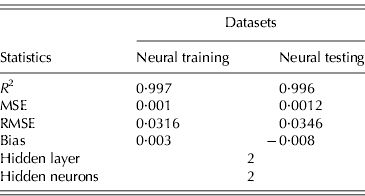
The ability of GMDH-type NN to predict EEP in BB is demonstrated in Fig. 1. Results of the developed GMHD-type NN models revealed close agreement between observed and predicted values of EEP. The statistical results for the training and testing set of the GMDH-type NN model are summarized in Table 4. Polynomial equations obtained by the GMDH model were subjected to SA. Corresponding EEP sensitivity statements obtained for each input variable were as follows in Eqns (4–7):


where F, x 1, x 2, x 3 and x 4 stand for EEP, ME, CP, Met and Lys, respectively. The SA results obtained for the EEP model for investigated dietary nutrients are shown in Figs 2–5. The variation in each variable in the plotted curve is kept within the data range, i.e. the considered variation of each input variable is in the range described in Table 3.
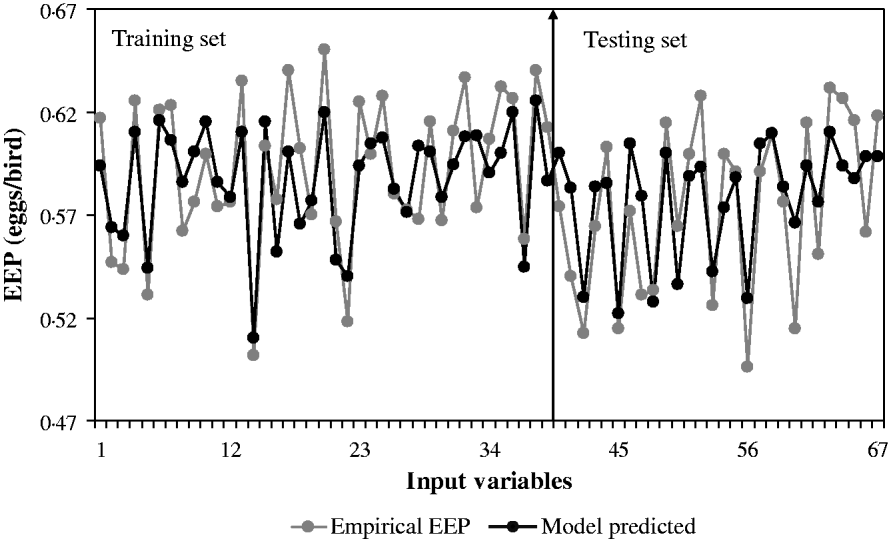
Fig. 1. NN model-predicted EEP in comparison with actual data in BB for the training and testing sets.
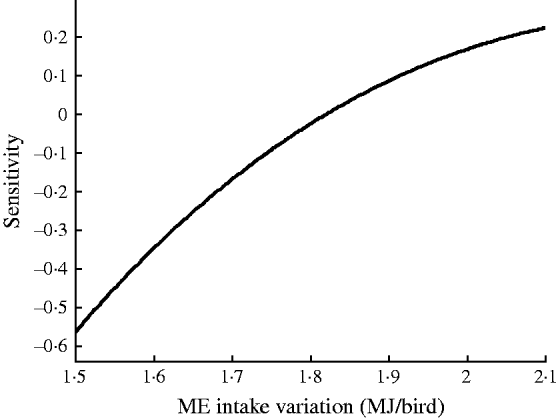
Fig. 2. Sensitivity of EEP in BB with respect to ME intake variation.
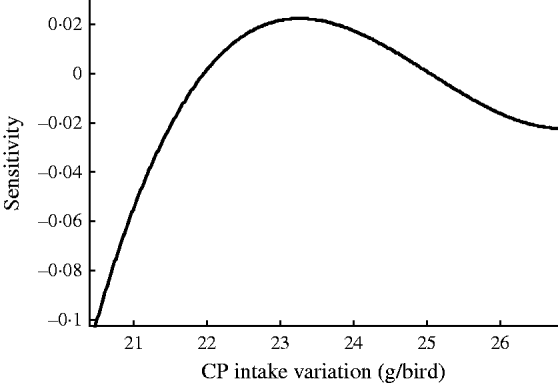
Fig. 3. Sensitivity of EEP in BB with respect to CP intake variation.

Fig. 4. Sensitivity of EEP in BB with respect to Met intake variation.
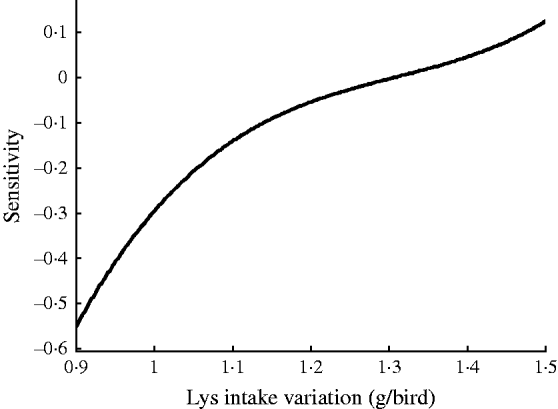
Fig. 5. Sensitivity of EEP in BB with respect to Lys intake variation.
DISCUSSION
Results showed that the evolved GMDH-type NNs have been successful in obtaining a model for the prediction of EEP in BB. All input variables were accepted by the model, i.e. the GMDH-type NN provides an automated selection of essential input variables and builds polynomial equations to model EEP. This is in agreement with previous studies aimed at investigating the effect of dietary nutrients on BB performance (Bornstein & Lev Reference Bornstein and Lev1982; Cave Reference Cave1984; Hudson et al. Reference Hudson, Lien and Hess2000). Overall calculated values of accuracy indices revealed that the training set provided a better prediction of EEP compared with that for testing (Table 4). This is in good agreement with Ahmadi et al. (Reference Ahmadi, Golian, Mottaghitalab and Nariman-Zadeh2008) who reported the same findings in the prediction of true ME content of feather meal using GMDH-type NN. As the NN models are developed based on the training sets, achieving higher values of accuracy in these groups are to be expected. Overall calculated values of bias showed higher values for the training set compared with that for testing. This is in agreement with Mottaghitalab et al. (Reference Mottaghitalab, Faridi, Darmani-Kuhi, France and Ahmadi2010), who investigated the ability of GMDH-type NN to predict caloric and feed efficiency in turkeys. Figures 2–5 show the SA results. As these figures demonstrate, the EEP model is considerably influenced by Met and Lys, the first and second limiting amino acid. However, EEP model sensitivity decreased with ME and CP variation, respectively. As Fig. 2 shows, ME intake of 1·9–2·1 MJ/bird/day provides the most increasing effect on model output. Results from SA of the EEP model for CP variation illustrate that maximum increasing effect of CP would be achieved at 23 g/day/bird (Fig. 3). These results are in agreement with Waldroup et al. (Reference Waldroup, Hazen, Russell and Johnson1976), who suggested 20–22 g protein/bird/day and 1·8 MJ ME/bird/day for BB fed with corn–soybean meal diets (Waldroup et al. Reference Waldroup, Hazen, Russell and Johnson1976). By the same token, Ross Breeder company's recommendations for ME and CP intake during early stages of egg production were 1·76 MJ/bird/day and 22·5 g/bird/day, respectively (Ross Breeders Ltd 2005). The protein variation provided least sensitivity in the proposed model. Low sensitivity of production in BB to protein variation may be a proof for the concept of studies designed to decrease protein in breeder diets and balance essential amino acids in order to decrease dietary costs and excretion of nitrogen to the environment (Lopez & Leeson Reference Lopez and Leeson1994, Reference Lopez and Leeson1995). The protein content of a BB feed can be lowered with supplemental Met and Lys. Moreover, the energy content of the diet will usually increase when protein is lowered and amino acids added. Therefore, a smaller amount of feed will be needed to meet the hen's energy requirement. In other words, use of supplemental Met and Lys will reduce daily protein intake and reduce nitrogen excretion (Harms & Russell Reference Harms and Russell1998). There is limited published information on special BB amino acid requirements, especially for Met and Lys (Harms Reference Harms1992). The SA of the EEP model to Met intake variation indicated that maximum increasing effect of this nutrient would be achieved at 0·65–0·8 g/bird/day (Fig. 4). This range could be considered as the optimum level of this nutrient. The range is higher than that suggested by Fisher (Reference Fisher1998) who reported the best performance of BB at 0·47 g Met/bird/day. However, the Ross Breeder company's recommendation for this period of production is 0·45 g/bird/day (Ross Breeders Ltd 2005). Based on Fig. 5, increasing effect of Lys intake is in the range of 1·3–1·5 g/bird/day. This is in agreement with previous studies which reported that the National Research Council (NRC 1984) recommended level of Lys intake (765 mg/bird/day) is not adequate and higher levels of Lys are needed to support good performance by BB (Spratt & Leeson Reference Spratt and Leeson1987; Harms Reference Harms1992; Fisher Reference Fisher1998). The higher values of nutrients suggested are probably because of genetic selection programmes which lead to increase in productivity and performance of BB, and subsequently higher nutrient requirements. The Ross female parent stock recommendation for Lys during 24–29 weeks of age was 0·975 g/bird/day (Ross Breeders Ltd 2005). The results indicated that nutrient recommendation for maximum performance in BB, provided by the SA results, is higher than those suggested by the Ross Breeders Ltd. Such differences in nutrient requirement levels may be due to differences in genetics, environments, dietary factors and the statistical method applied. However, it would be useful to evaluate the effect of the suggested values provided in the current study for the whole production cycle. It should be noted, however, as with other data-based models, the applicability of GMDH-type NN is very dependent on the data ranges used to develop the model. Obviously, additional research with a larger experimental dataset (data that produce larger ranges) will lead to a more appropriate and applicable model.
The present study showed that the GMDH-type NN can be used to predict EEP in BB based on dietary nutrient intake. The advantage of using GMDH-type NN is subjecting obtained polynomial equations to analysis of the sensitivity of output with respect to input variables. SA has several effects such as obtaining the first-order approximation solution, evaluating the parameters’ sensitivity, selecting proper variables and applying the results to give practical solutions.


