Introduction
Entomology collections across Canada are a valuable source of taxonomic, ecological, and biodiversity data. Each collection houses, maintains, and makes available preserved and labelled terrestrial arthropod specimens. Although physical specimens on pins, in ethanol, in envelopes, and on slides are the core material of collections, the data represented by those specimens are of immeasurable value to those working within and outside of the collections themselves. The digital age has allowed accelerated capture of the physical data of collections in electronic formats that can be shared around the globe.
There is general acknowledgement that digitised, publicly available biodiversity records are of immense value for researchers working outside of natural history collections (e.g., Cardoso et al. Reference Cardoso, Erwin, Borges and New2011; Nelson and Ellis Reference Nelson and Ellis2018; Miller et al. Reference Miller, Barrow, Ehlman, Goodheart, Greiman and Lutz2020; Abbott and Sandall Reference Abbott, Sandall, Cordoba-Aguilar, Beatty and Bried2022). Large datasets from entomology collections are regularly used for meta-analyses relating to taxonomy, conservation, evolution, and ecology. For instance, species distributions and historical changes in those geographical ranges can be observed using regionally focused entomological collection datasets (e.g., Favret and DeWalt Reference Favret and DeWalt2002; Brunke et al. Reference Brunke, Klimaszewski, Dorval, Bourdon, Paiero and Marshall2012; Vergara-Navarro and Serna Reference Vergara-Navarro and Serna2013). Consulting entomology collection records usually adds records of species not previously known to be present within a geographical region. As only one example out of many, by digitising the Illinois Natural History Survey (University of Illinois, Urbana–Champagne, Champagne, Illinois, United States of America) collection, Favret and DeWalt (Reference Favret and DeWalt2002) added four new species records to the relatively well-known species list of Ephemeroptera of Illinois. Conventional entomology collection label data (species identification, locality, and date) can be easily combined with other datasets, including physiological data, historical climatic data, land use data, genomic data, and population genetics studies. The long timescale of entomology collection data can be a useful historical complement to new studies that focus on intense monitoring of a target species in a limited geographical area (Kharouba et al. Reference Kharouba, Lewthwaite, Guralnick, Kerr and Vellend2018). In some cases, original meta-analyses of historical entomological data take on a focus that was likely inconceivable to the collectors of the original material. For example, Kharouba et al. (Reference Kharouba, Lewthwaite, Guralnick, Kerr and Vellend2018) completed a comprehensive review of studies that employed entomology collection data to investigate historical patterns of climate change impacts.
The unfortunate reality is that most entomology electronic databases lack substantial amounts of the collection’s specimen data. In a recent estimate, only 7% of specimen data in Canadian entomology collections has been digitally captured (Cobb et al. Reference Cobb, Gall, Zaspel, Dowdy, McCabe and Kawahara2019). Digital specimen records that do not contain a full complement of metadata (locality, georeferenced coordinates, collection date, collector, and species identification) are considered “skeletal” or incomplete. In some instances, records containing lower data resolution (e.g., family-level identifications and localities without coordinates) can still be used for limited analyses. An alternative approach is to improve or complete database records on a specimen-by-specimen basis.
Taxonomic inconsistencies and geospatial data anomalies are the two main sources of error in digitised biodiversity datasets (Nelson and Ellis Reference Nelson and Ellis2018). Updating out-of-date taxonomic terms and standardising locality coordinates is a time-consuming process that is often necessary with older specimen records (Giberson and Burian Reference Giberson and Burian2017). Even when data anomalies have been addressed, entomological collections data are often unevenly distributed temporally and spatially (Kharouba et al. Reference Kharouba, Lewthwaite, Guralnick, Kerr and Vellend2018). Entomological collections consist of specimens collected over decades or even centuries by sometimes hundreds of collectors. These specimens were not collected according to a predetermined pattern or design. One challenge of analysing digital entomology datasets is recognising any geographical and temporal specialisations or biases.
In this study, we examined a single, publicly available entomological collection of dragonflies and damselflies (Odonata) collected between 1913 and 2021 in British Columbia, Canada. We performed ecological, spatial, and taxonomic analyses to examine temporal, spatial, and methodological patterns. Although some completion was performed and inconsistencies were corrected, no additional collecting or curatorial efforts were made in this study. Our study provides new insights into the diversity of British Columbia’s Odonata and demonstrates the growing potential for entomologists and others to use and improve existing digitised records for biodiversity and conservation research.
Material and methods
The core dataset for this study was the Odonata collection at the Royal British Columbia Museum (RBCM), Victoria, British Columbia, Canada. The RBCM entomology collection is considered a small, tier-three collection (100 000–1 000 000 specimens) according to the categorisation of Cobb et al. (Reference Cobb, Gall, Zaspel, Dowdy, McCabe and Kawahara2019). The biodiversity of British Columbia’s Odonata was a targeted research and collections goal of the museum for many years, led by curator Dr. Rob Cannings (Cannings Reference Cannings2023a). Previous studies (Cannings Reference Cannings2019, Reference Cannings and Klinkenberg2023b; Cerini et al. Reference Cerini, Bombi, Cannings and Vignoli2021) have made use of portions of the dataset.
All Odonata database records were downloaded from the RBCM database on 7 February 2023. The dataset was trimmed to include only records that were confirmed to have been collected within British Columbia.
Data completeness was assessed for each record in regards to location, collection date, and taxonomic identification. For location data completeness, the degree of geographic accuracy was ranked. Full latitude and longitude coordinates were ranked higher than universal transverse Mercator (UTM) coordinates, which were ranked higher than a locality name alone, which was ranked higher than a blank location entry. For example, if a specimen had both latitude and longitude entries and a locality name entry, it was treated as having only a latitude and longitude entry. Overall data completeness was visualised with a Sankey diagram – a type of flow diagram that shows the proportion of data divided into different categories – using the R package ggsankey (Sjoberg Reference Sjoberg2021). The list of species names in the database was compared to the World Odonata List in the Catalogue of Life (Paulson et al. Reference Paulson, Schorr, Abbott, Bota-Sierra, Deliry, Dijkstra, Lozano, Banki, Roskov, Dőring, Ower, Hernández-Robles and Plata Corredor2023). Current conservation status for each species was derived from the October 2022 version of the Committee on the Status of Endangered Wildlife in Canada (COSEWIC) list (British Columbia Conservation Data Centre 2023). A heat map of Odonata specimen occurrences was produced using ArcGIS Pro, version 3.2.1 (https://www.esri.com). Coordinates were geographically limited to British Columbia with a screen unit point radius of 10, locked to a scale of 1:5 000 000. To provide a point of reference for where specimens were collected, an overlay of major highways was included. Habitat descriptions were extracted from all records and then manually assigned to categories. These data were then incorporated into a Venn diagram using the R packages, ggVenn (Yan Reference Yan2021) and ggVenndiagram (Gao et al. Reference Gao, Yu and Cai2021). Locations of specimen entries containing valid latitude and longitude coordinates, but not elevation records, were entered into Google Earth Pro (7.3.6.9345, 2022; www.google.com/earth), and elevation values were retrieved. Odonata species similarity between elevation ranges was calculated using the faunal similarity index (FS = NC/(N1 + N2 – NC), NC representing the number of species in common, N1 and N2 representing the numbers of species collected in each elevation range; Kearns Reference Kearns1992).
Results
We recovered a total of 34 687 specimen records of Odonata collected in British Columbia from 1913 to 2021. The number of digitised records in the RBCM collection is similar or greater than the number of specimens in several prominent Odonata collections elsewhere (Abbott and Sandall Reference Abbott, Sandall, Cordoba-Aguilar, Beatty and Bried2022, Table 23.2). A complete list of specimens with data is provided in the Supplementary material. Completeness of the dataset was evaluated in various ways (Fig. 1).

Figure 1. Sankey diagram of British Columbia Odonata specimen database entry completeness in the Royal British Columbia Museum entomology collection. Figure was created in R, version 4.2.3, with the ggsankey package (Sjoberg Reference Sjoberg2021).
Of the 34 687 records, 28 304 (81.6%) had full latitude and longitude data, 2450 (7.1%) had UTM data, 3876 (11.2%) had a locality name, and 57 (0.2%) had no location data beyond “British Columbia.”
For taxonomic completeness, entries were ranked by phylogenetic level. Of the 34 687 records, 33 223 (95.8%) had species-level identifications, 369 (1.1%) had genus identifications, 694 (2.0%) had family identifications, and 401 (1.2%) were identified only to order as “Odonata.” Of the 34 687 records, 34 622 (99.8%) included a collection date.
On a per family basis (Table 1), species-level identification ranged from 95.4% of records (Gomphidae) up to 100% of records (Cordulegastridae, Macromiidae, Calopterygidae, and Petaluridae). Collection date was recorded for more than 99% of records for all families. Complete latitude and longitude data were recorded for 52.5% (Cordulegastridae) to 100% of records (Petaluridae).
Table 1. Summary of data completeness for British Columbia Odonata specimens in the Royal British Columbia Museum entomology collection. Values represent the percentages of specimens having data present in the database for each Odonata family.

One historic taxonomic name in the dataset, Sympetrum occidentale Bartenev, 1915, needs to be updated to the current valid species Sympetrum semicinctum (Say, 1839) (Pilgrim and Von Dohlen Reference Pilgrim and Von Dohlen2007). One species, Enallagma exsulans (Hagen, 1861), was recorded in the dataset but is believed to range only as far west as Manitoba, Canada and Texas, United States of America. The 27 records of this species are likely misidentifications or mislabelled locations. Up until 1934, fewer than 50 species names were recorded for British Columbia in the database. By 2001, the number of species in the database plateaued at 85 species. Three species on Cannings’ (Reference Cannings and Klinkenberg2023b) British Columbia Odonata checklist, Archilestes californicus McLachlan, 1895, Enallagma civile (Hagen, 1861), and Pantala hymenaea (Say, 1839), are not present in the collection but were reported as present in British Columbia in other public sources (Cannings Reference Cannings1988; Cannings and Pym Reference Cannings and Pym2017; Lee and Cannings Reference Lee and Cannings2024). Sixteen species had no new records in the database over the past 20 years. For one species, Enallagma clausum Morse, 1895, the most recent record dates from July 1997. Of the nine British Columbia Odonata species currently listed by COSEWIC (British Columbia Conservation Data Centre 2023) as threatened or endangered, six have not had any new records added since 2008 (Table 2).
Table 2. Odonata species of British Columbia currently listed by the Committee on the Status of Endangered Wildlife in Canada (COSEWIC) and the number of specimens held by RBCM, date range of held specimens, and date of COSEWIC status assessments. RBCM, Royal British Columbia Museum

The number of records added to the database per decade began increasing in 1973 and continued to increase until a peak in 1993–2002 (Fig. 2). This period coincided with the concerted effort led by Rob Cannings, with the substantial participation of others, to document Odonata biodiversity in the province. Although 177 different collectors contributed specimens to the database, all species-level identifications were completed by only 41 individuals, with nearly 90% of the species identifications completed by just five individuals: Rob Cannings, Gord Hutchings, Richard Cannings, Syd Cannings, and Leah Ramsey (Fig. 3).
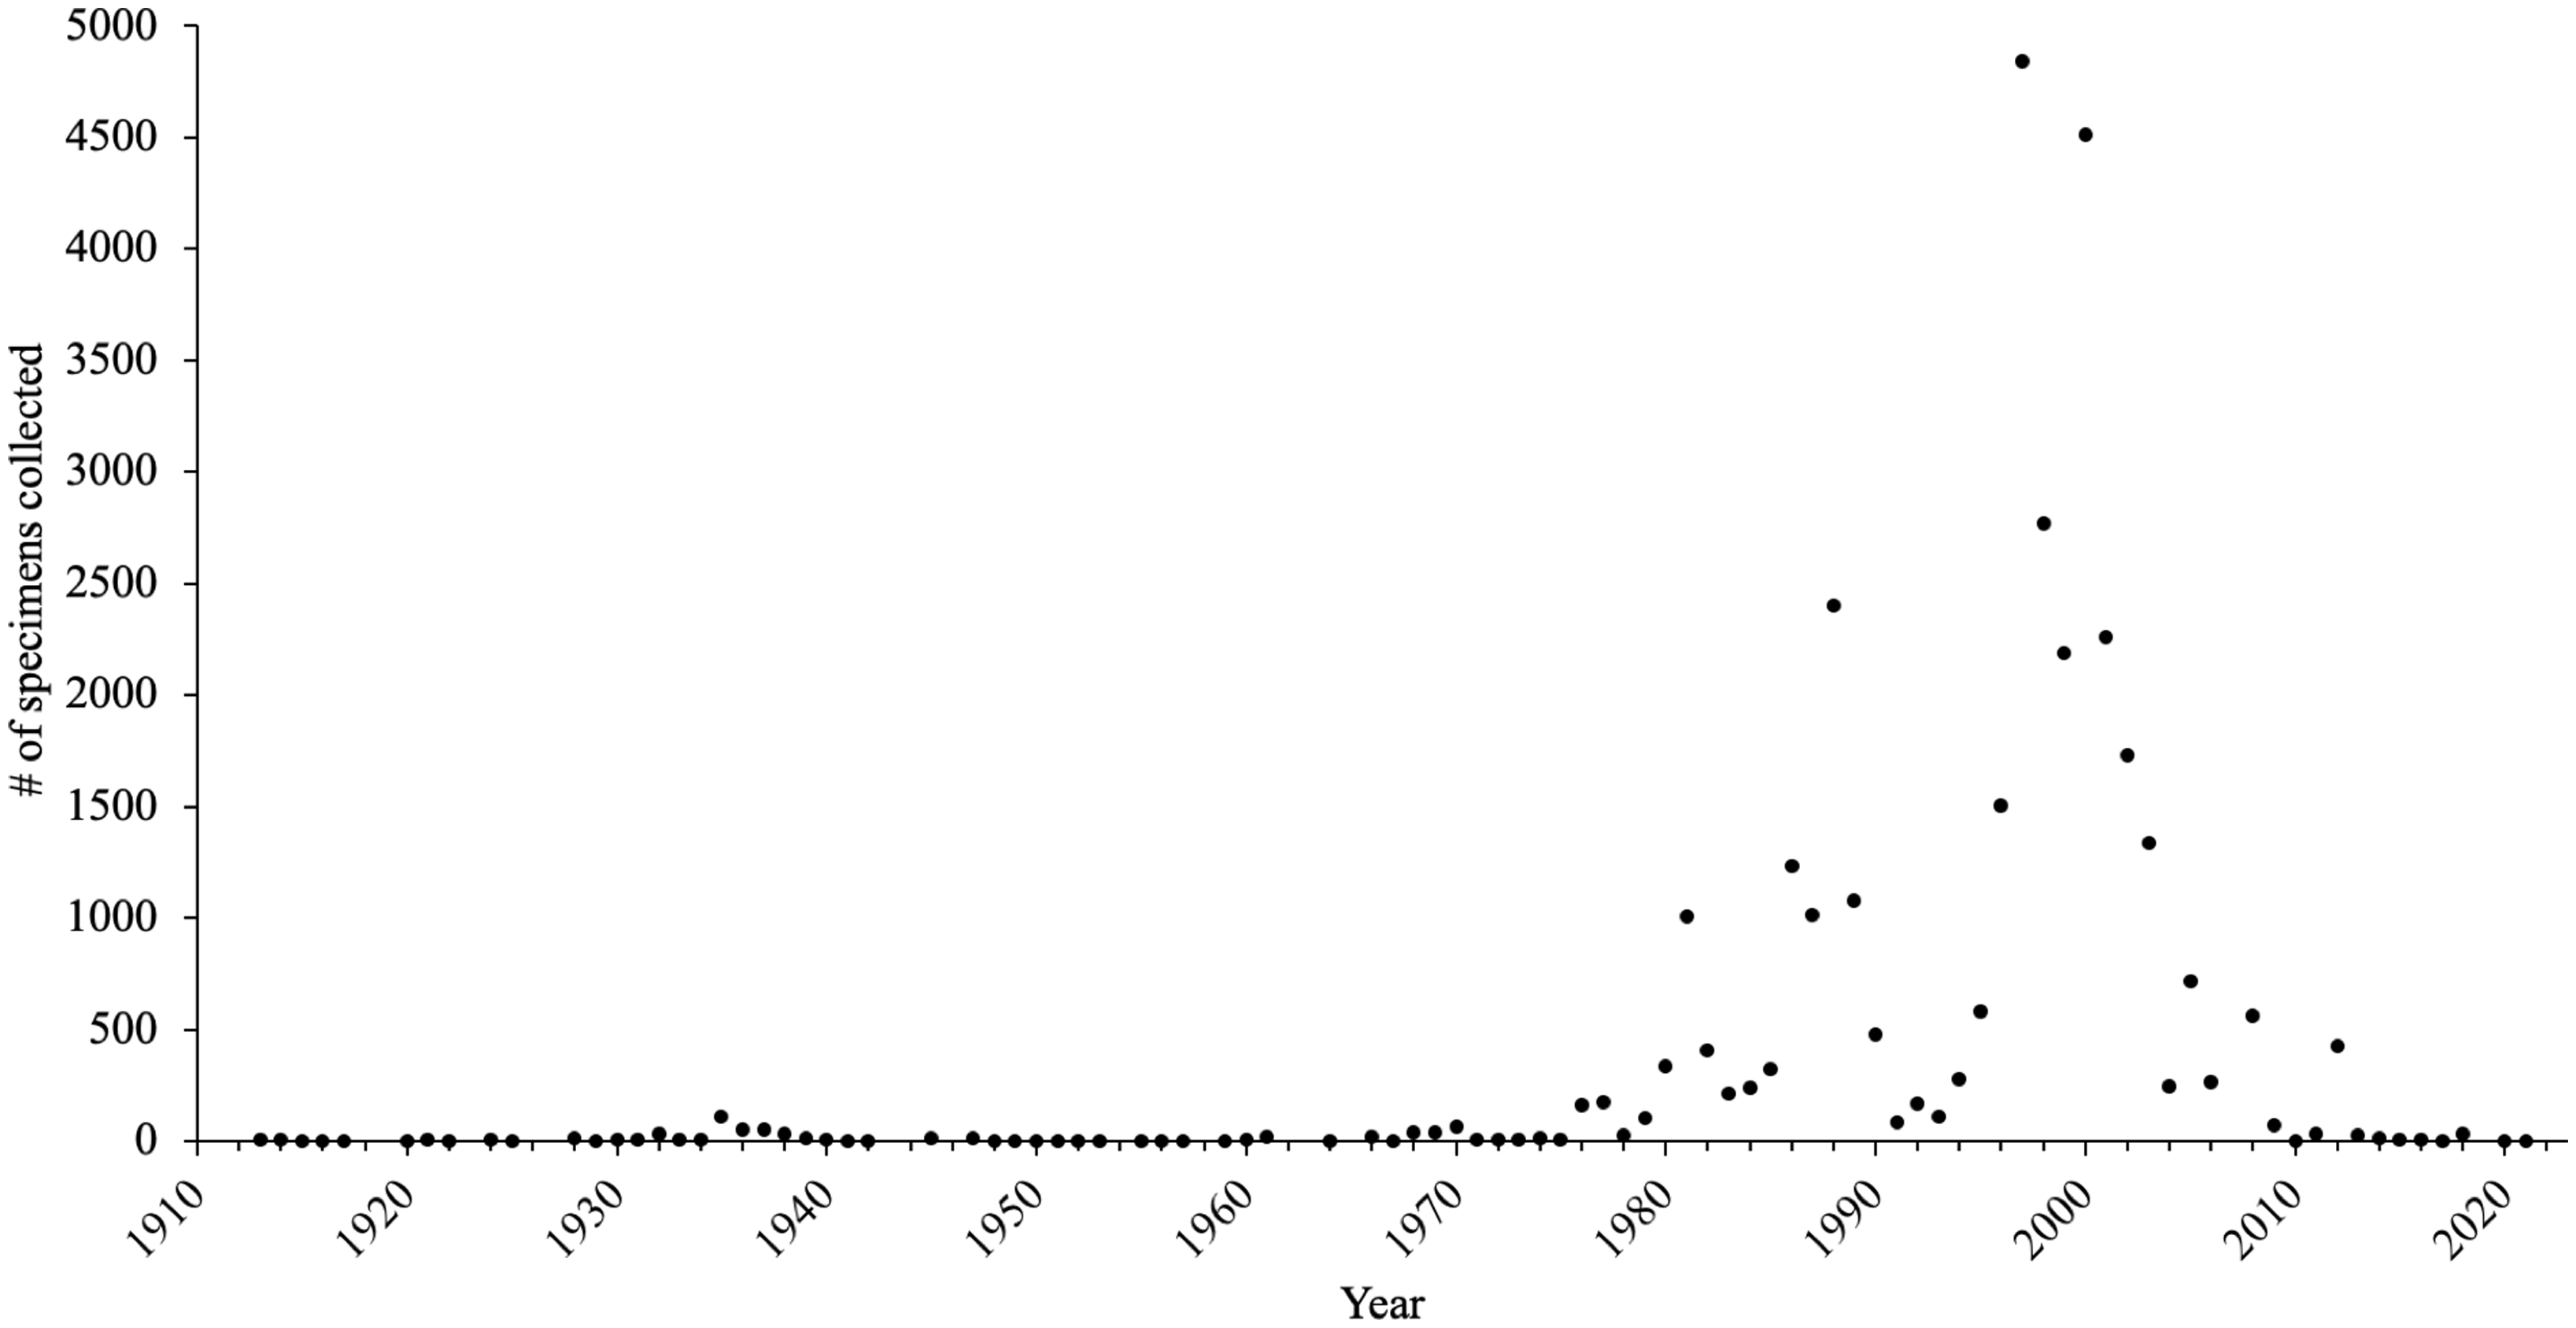
Figure 2. Number of British Columbia Odonata specimens collected by all collectors per year in the Royal British Columbia Museum entomology collection. Sixty-five records without dates were excluded; total number of records equals 34 622.
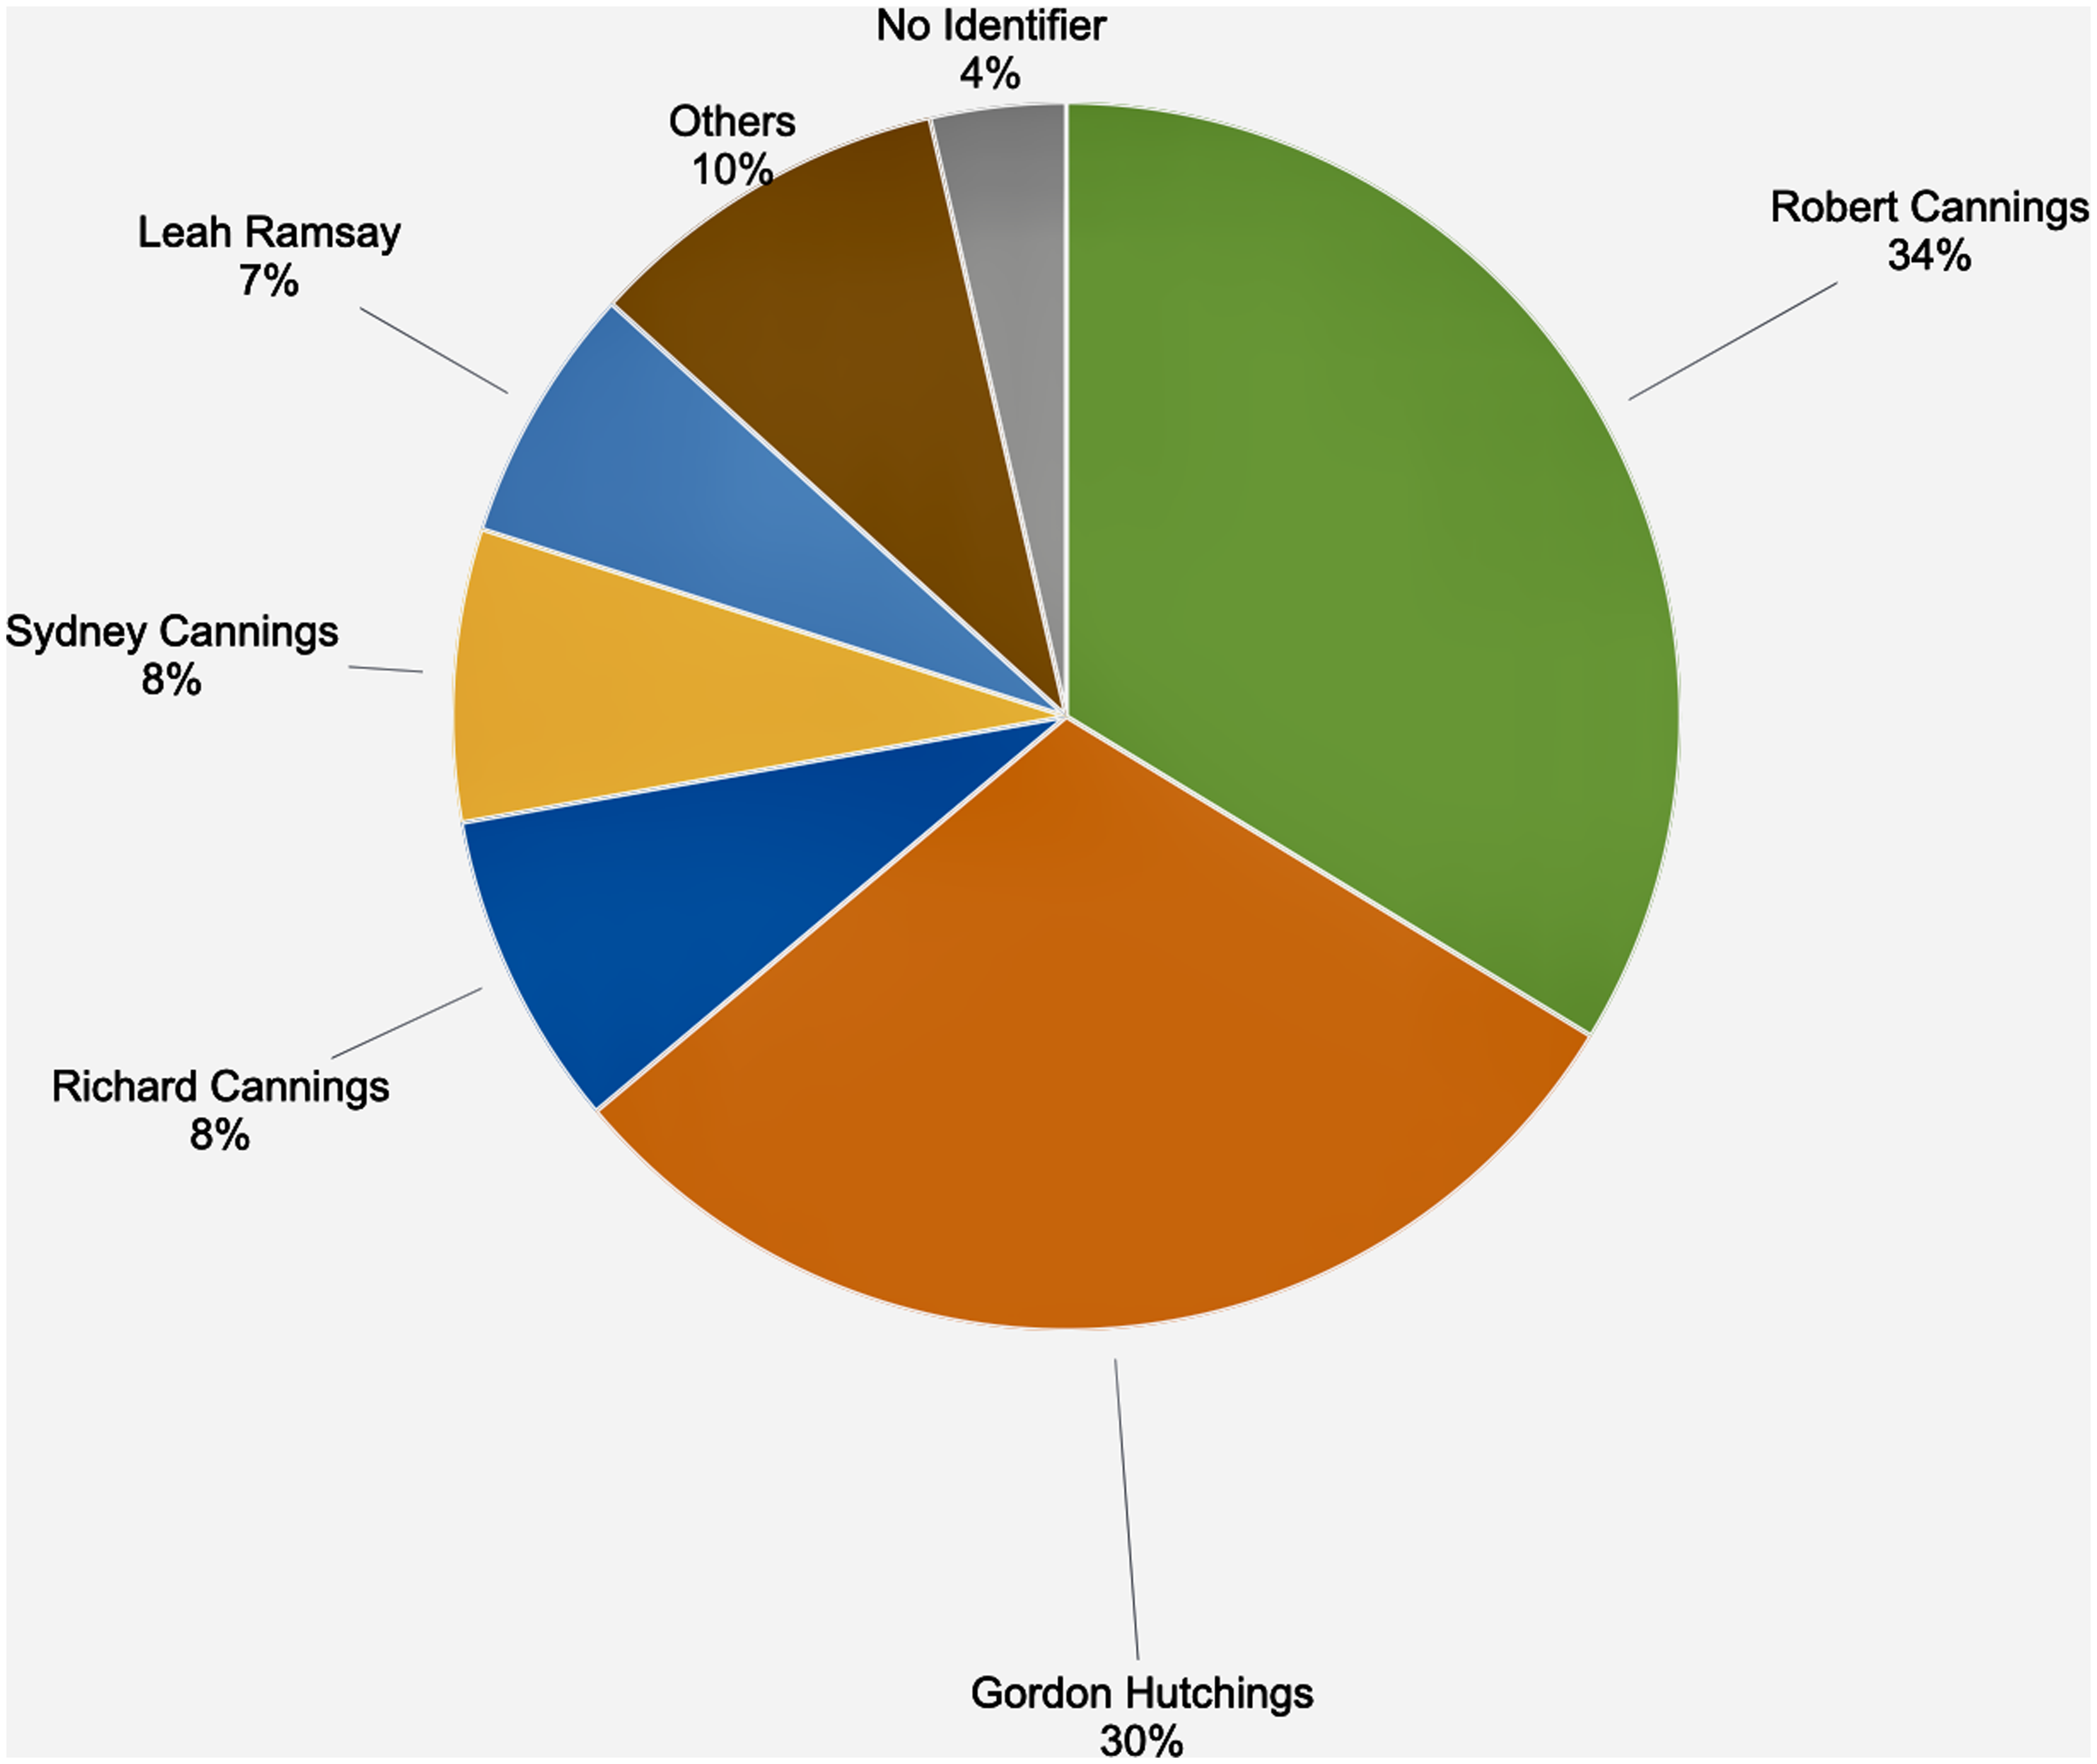
Figure 3. Identifiers of British Columbia Odonata specimens in the Royal British Columbia Museum entomology collection (n = 34 687).
Placing all database records with verified latitude and longitude data (28 239 records) on a single map (Fig. 4) revealed several patterns. Major collecting hotspots were southern Vancouver Island (including Victoria), the southwest mainland (including Vancouver), and the southern Okanagan Valley (including Penticton and Osoyoos). Outside of these areas, almost all records were along or near either Highway 97 or Highway 16. Few records originated from north of 56° N latitude or from the central coastal region eastwards to Highway 97. Some targeted collection events were evident in the data, including a major collecting effort on Brooks Peninsula, on northeastern Vancouver Island, in 1981 (Cannings and Cannings Reference Cannings and Cannings1983).
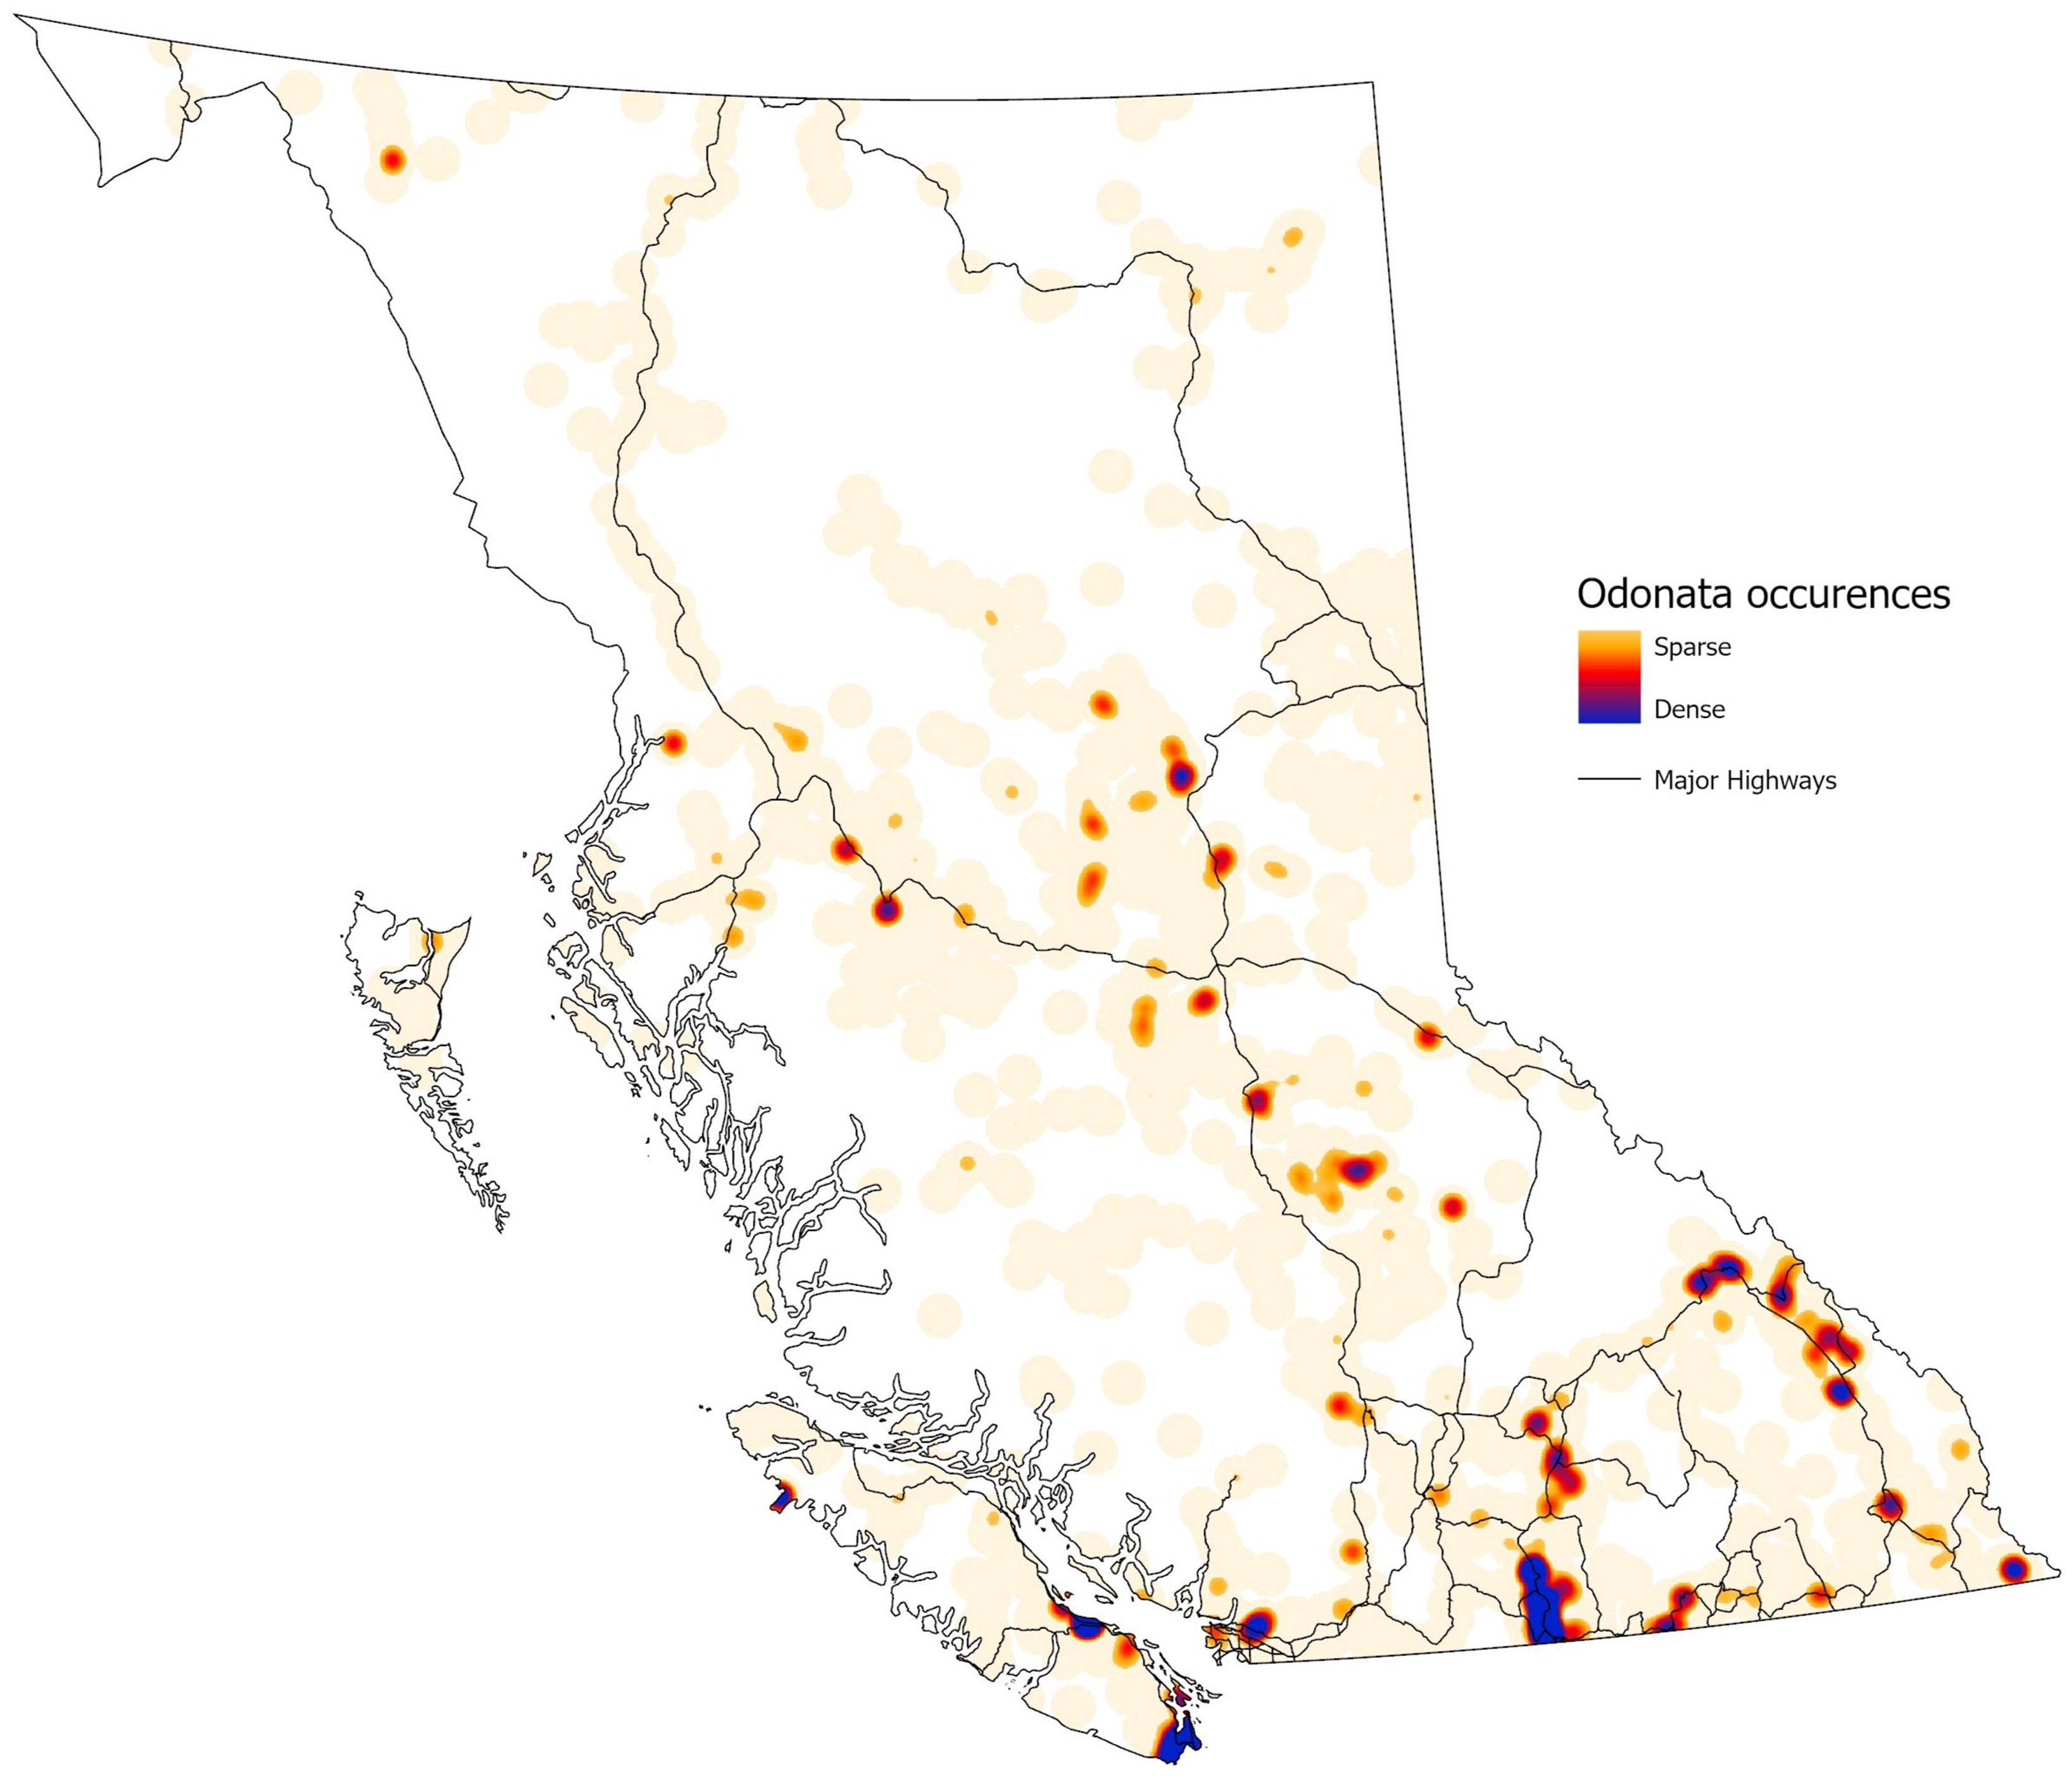
Figure 4. Heat map of British Columbia Odonata collection records in the Royal British Columbia Museum in relation to major highways throughout British Columbia. Map generated with ArcGIS Pro, version 3.2.1.
Grouping collecting localities according to ecoprovince (Demarchi Reference Demarchi2011) allowed further geographic analysis (Fig. 5). The number of records per ecoprovince varied, with the Southern Interior Mountains ecoprovince having the most records (6110), and – not including the small Southern Alaska Region – the Taiga Plains having the fewest (510). Species richness per ecoprovince also varied, with the Southern Interior having the most recorded species (69) and the Northern Boreal Mountains and Taiga Plains having the fewest (33 each). An analysis based on similarity of species composition using only presence–absence data of each species produced a dendrogram showing overall similarities and differences between 9 of 11 of British Columbia’s ecoprovinces (Fig. 6). The Southern Interior Mountains, Southern Interior, Coast and Mountains, and Georgia Depression ecoprovinces together formed one clade and the other northern and interior ecoprovinces form a second clade. This division of the province into two large metaregions aligns with the conclusions of Cerini et al. (Reference Cerini, Bombi, Cannings and Vignoli2021), who used similar data but a different analytical approach.
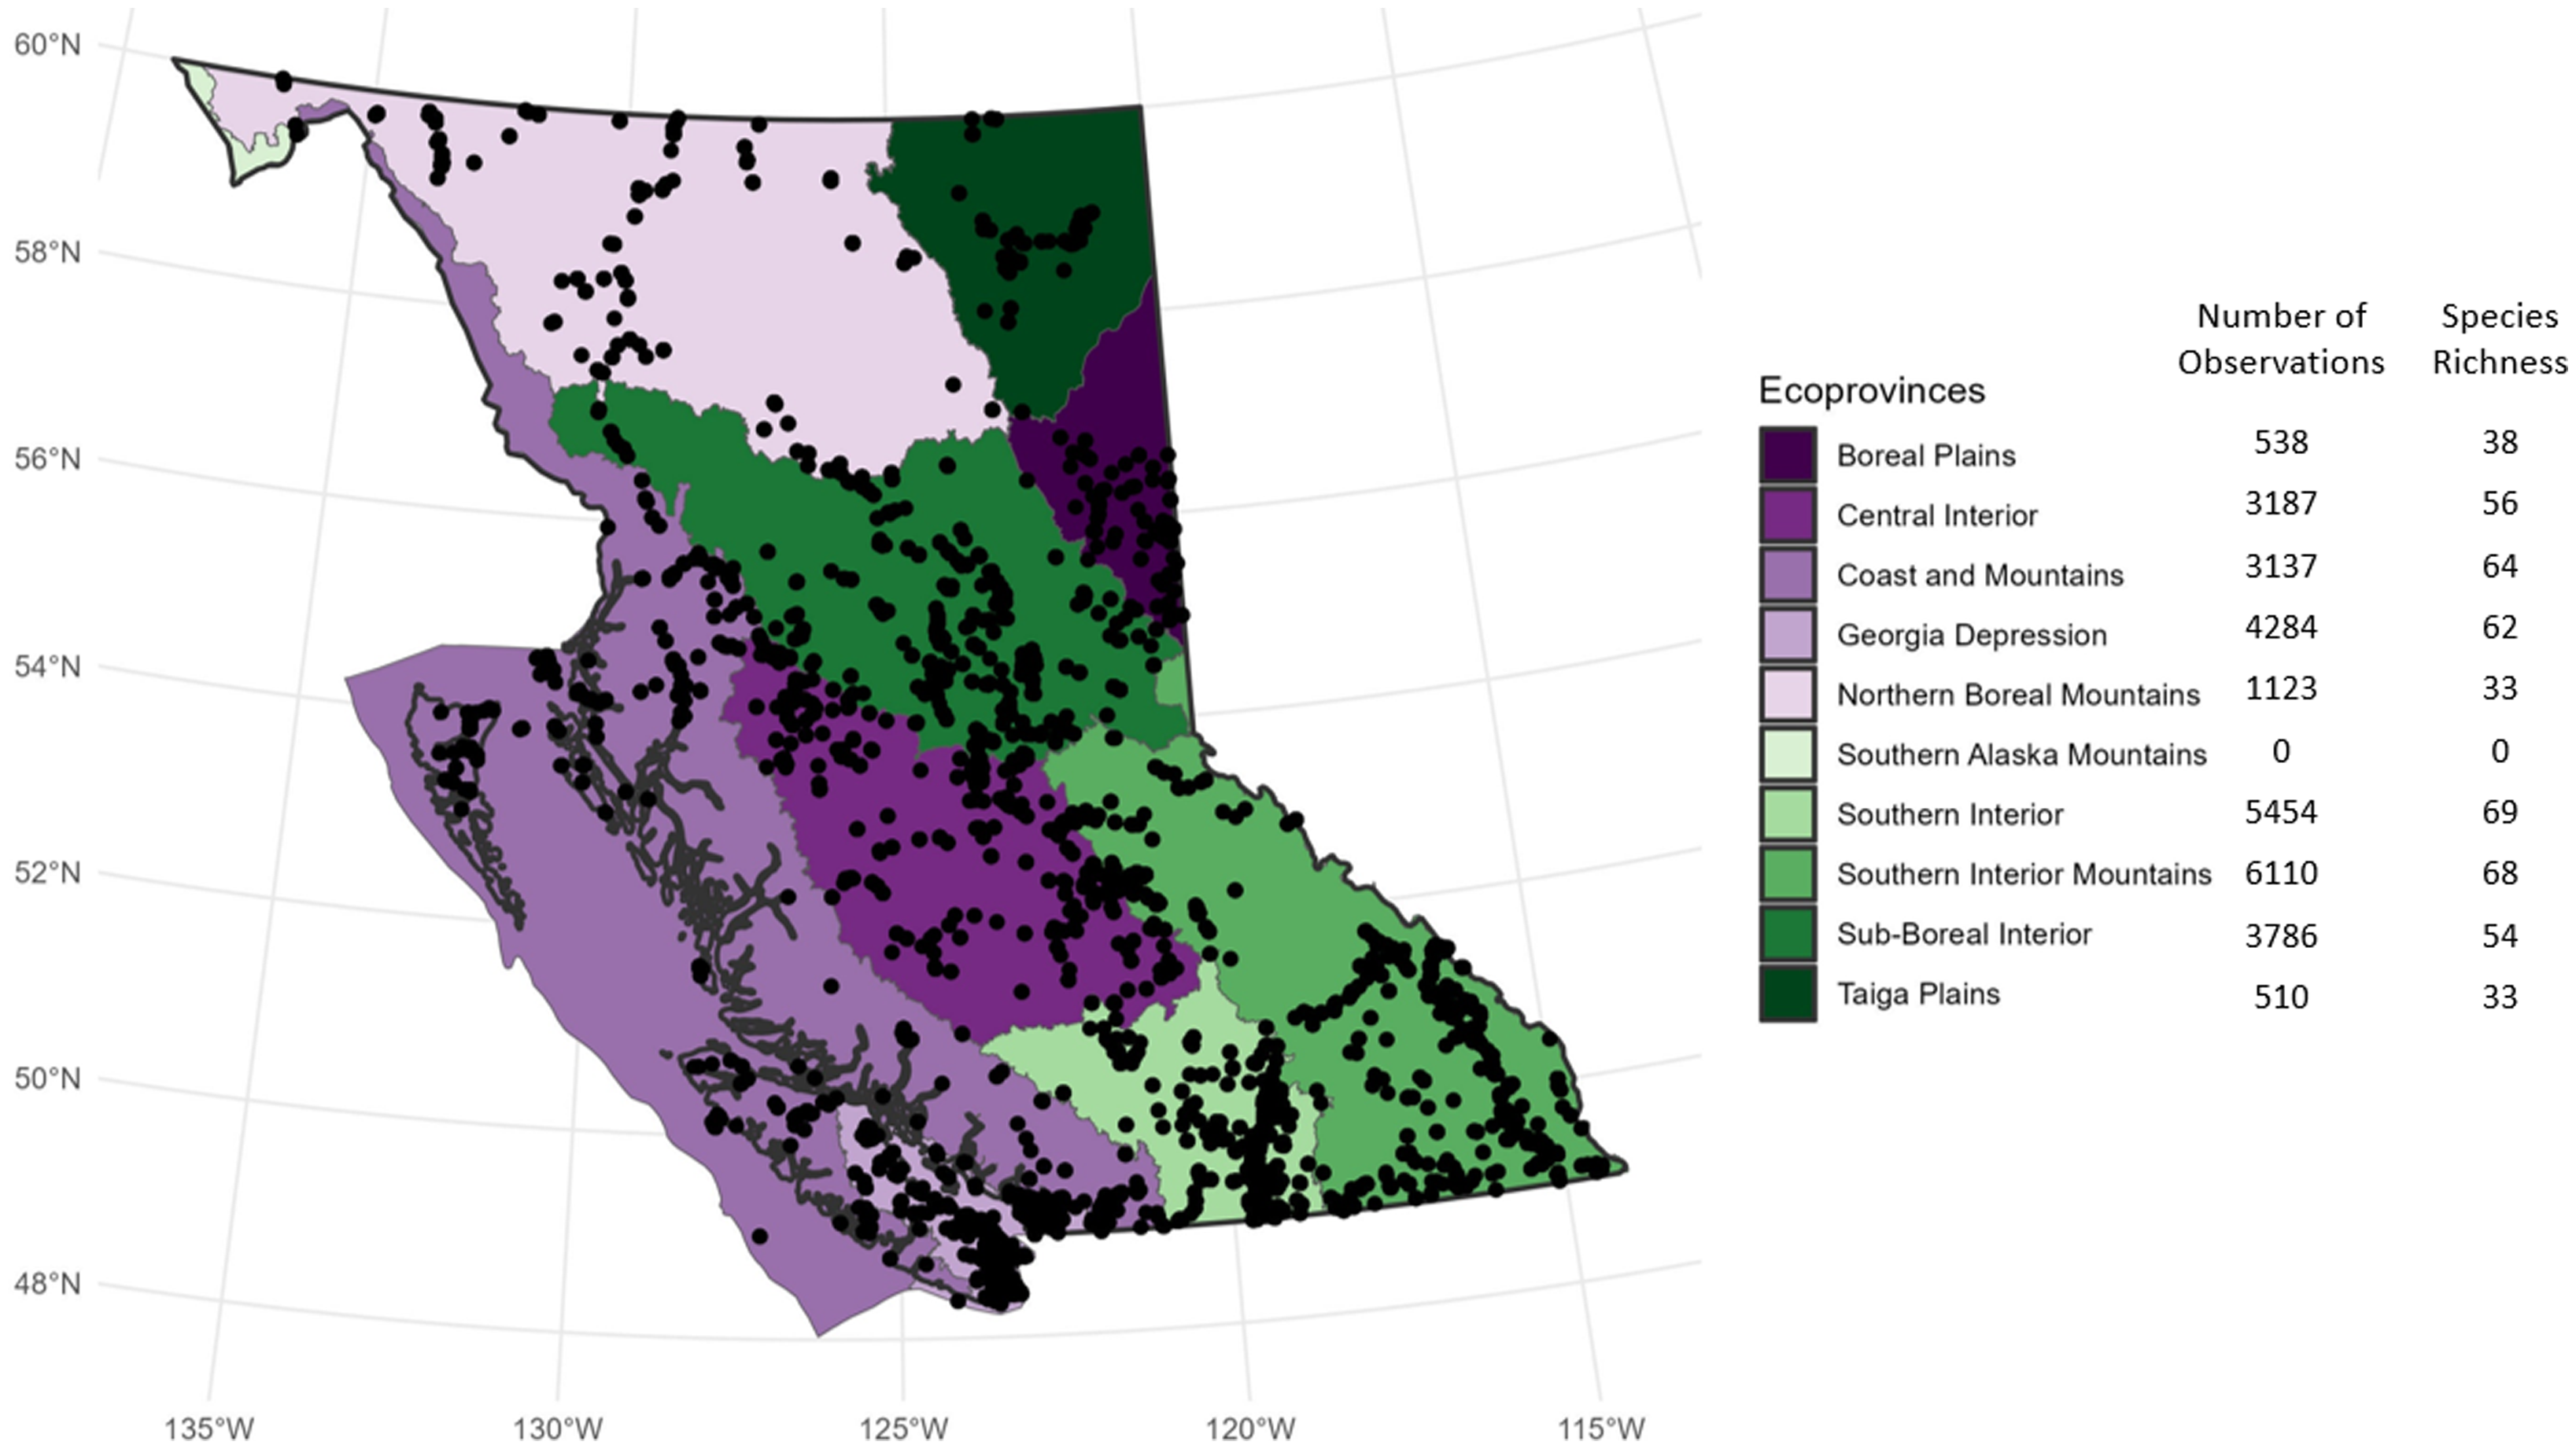
Figure 5. The 28 129 records of Odonata from the Royal British Columbia Museum entomology collection placed onto a map of British Columbia, with ecoprovince designations. Map generated using R, version 4.2.2, and the bcmaps, sf, and ggplot2 packages.

Figure 6. Dendrogram of Odonata community similarity for nine British Columbia ecoprovinces. Analysis is based on presence–absence data for each species, Sorenson dissimilarity, and unweighted pair group method with arithmetic mean-linking algorithm and was conducted in R, version 4.2.2, with the package vegan.
In addition to locality data, 19 234 records in the database (55.5%) included some degree of habitat description. These descriptors represented 1567 unique descriptors of wetland habitats. Text mining of these unique descriptors revealed four categories of information: wetland type, abiotic factors, vegetation description, and size of habitat. These descriptive terms were present in a large number of combinations (Fig. 7), with 206 (12.7%) of the descriptors including information in all four categories.
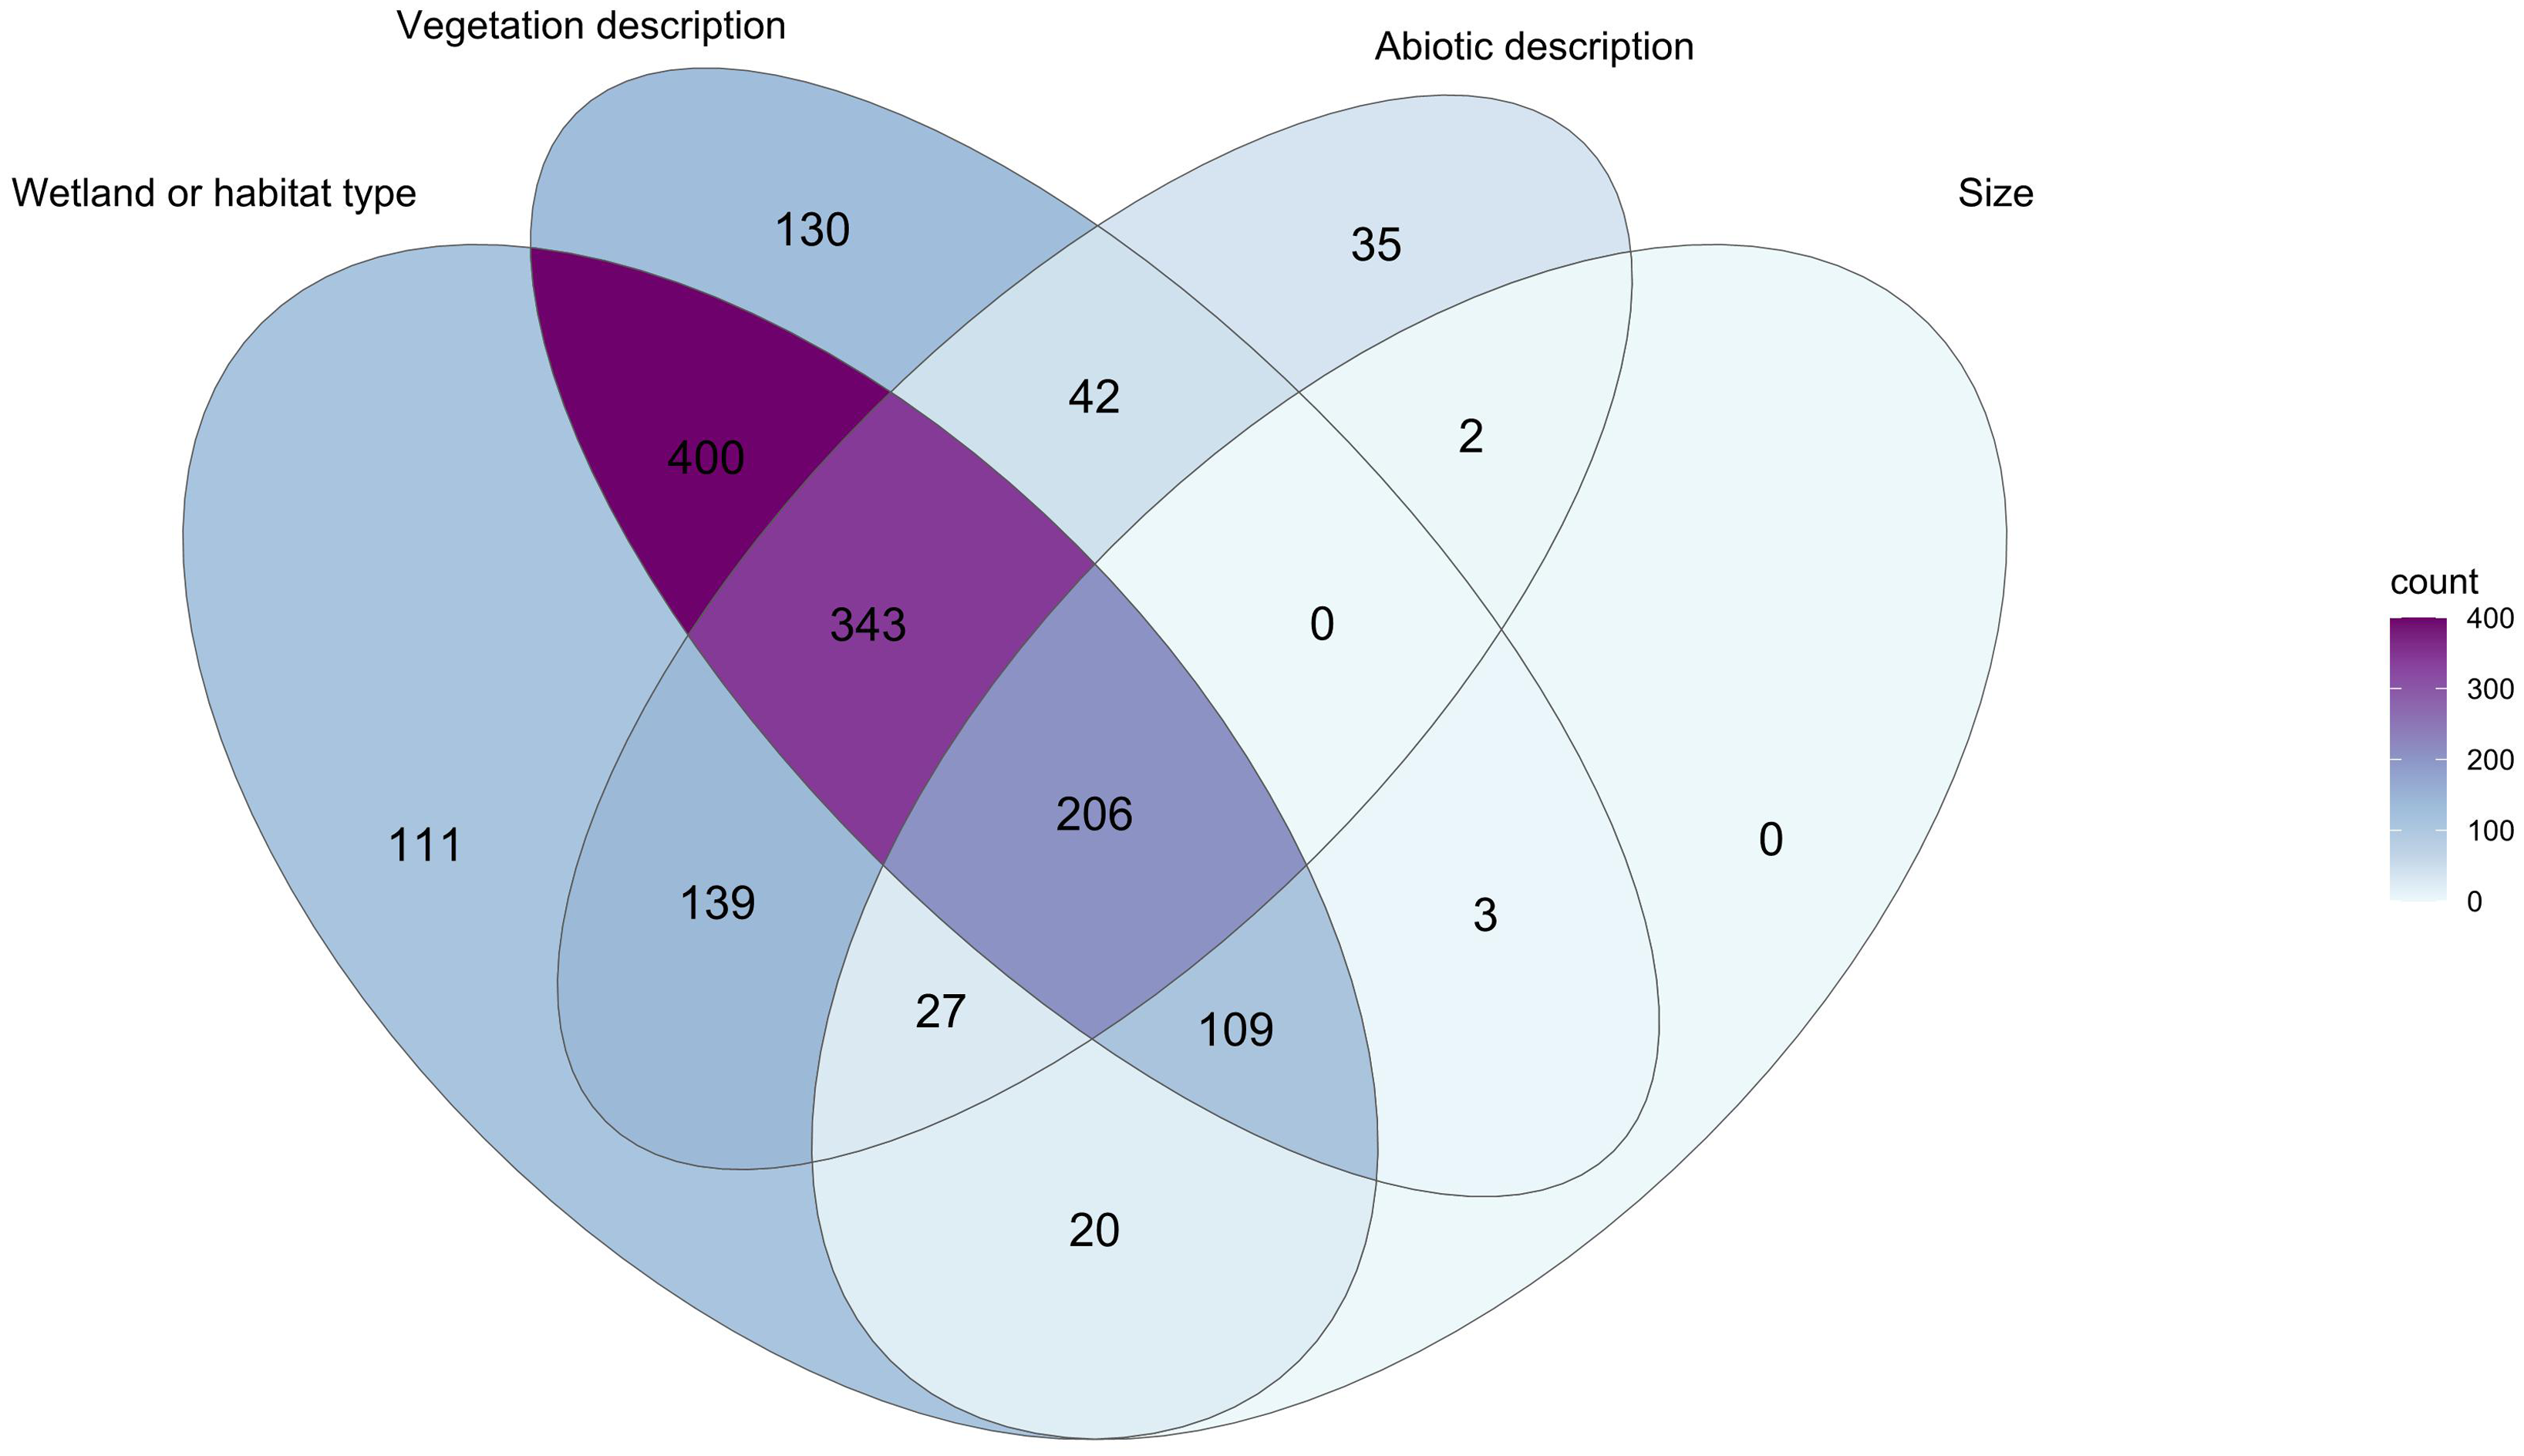
Figure 7. Venn diagram showing extent of overlap in specimen habitat descriptions for British Columbia Odonata in the Royal British Columbia Museum entomology collection. Diagram created in R, version 4.2.3, with the packages ggVenn (Yan Reference Yan2021) and ggVenndiagram (Gao et al. Reference Gao, Yu and Cai2021). Numbers indicate specimens with habitat data included in their entry. For example, 400 entries had both information on the wetland type and some description of vegetation.
Of the 34 687 records in the database, 18 970 (54.7%) contained elevation data. However, by combining available latitude and longitude data and Google Earth Pro data, elevations could be estimated and included for an additional 10 548 records. This process allowed elevation comparisons to be made for 85.1% of the records. Figure 8 shows the percentage of records of each Odonata genus occurring in seven elevation strata (from below 250 m to above 3000 m). Many genera included records at a range of elevations, but eight genera were restricted to below 500 m, and six genera had the majority of their records taken from above 750 m. A pairwise analysis of the species similarity at different elevation strata revealed patterns that could provide guidance for conservation efforts as species shift range and elevation with accelerating climate change (Table 3). For example, the species list for the 501–750-m elevation range was 92.1% similar to the species list for the 751–999-m elevation range. However, the species list for the 2000–2999-m elevation range was only 18.2% similar to the species list for the above-3000-m elevation range. The similarity between the lowest elevation (below 250 m) and the highest (above 3000 m) species lists was low (11.9%).

Figure 8. Percent composition of collected Odonata genera at each elevation range, with both recorded and retrieved data. A total of 29 518 specimens were included, comprising 31 genera.
Table 3. Faunal similarity (FS) between elevation ranges using both recorded and retrieved elevation data. N1: number of species in community 1; N2: number of species in community 2; Nc: number of species in both communities. If elevation ranges have exactly the same species, FS should equal 1

Discussion
The RBCM Odonata collection digital database has a high level of completeness, is well-curated, and is an informationally rich biodiversity and conservation resource. With more than 95% of records identified to species and more than 81% of records including precise geographic data, it is as or more complete than many other entomology collections. For example, Favret and DeWalt (Reference Favret and DeWalt2002) found that, within the collection of the Illinois Natural History Survey, only 22% of Ephemeroptera records and 88% of Plecoptera records were identified to the species level following a concerted data digitisation project. After concerted digitisation of records over nearly 20 years, only 10% of the more than 1.5 million specimens across all orders in the University of Alaska Museum Insect Collection (Fairbanks, Alaska, United States of America) had species identifications captured digitally (Sikes et al. Reference Sikes, Bowser, Daly, Høye, Meierotto and Mullen2017). An effort to digitise Odonata records from seven collections in the province of Quebec resulted in a list of 40 447 records, 91.3% of which were identified to the species level (Favret et al. Reference Favret, Moisan-DeSerres, Larrivée and Lessard2020).
In their assessment of North American entomology collections, Cobb et al. (Reference Cobb, Gall, Zaspel, Dowdy, McCabe and Kawahara2019) noted that 81% of historic (before 1965) entomological specimens are found in the largest collections. The RBCM Odonata collection runs counter to this estimate, containing a large number of historic specimens in a relatively small collection (Fig. 2) due to its regionally focused nature. By choosing to target Odonata of a single Canadian province, the collectors, curators, and taxonomic experts created an expansive time series of known, extant species from across the province. However, even with that effort, limitations in geographical representation occur (Fig. 4). Likewise, analysis of collection dates reveals that recent records are lacking for six red-listed species and that one species, Enallagma clausum, has not been collected for more than a quarter of a century (Table 2). A lack of recent records for key species may indicate conservation concerns requiring updated assessments for some of the seven British Columbia Odonata species at risk (Table 2). A decline in new, physical North American records of Lepidoptera species in recent decades has been documented similarly in other collections (Girardello et al. Reference Girardello, Chapman, Dennis, Kaila, Borges and Santangeli2019). This gap in recent records may be due to a shift amongst entomologists towards photographic vouchers and online records (e.g., iNaturalist). Orders consisting mainly of large insects, such as Odonata, may be susceptible to this shift in data collection. Supplementing physical specimen databases with purely digital records may be beneficial, for example, by reducing the number of listed individuals taken from a limited population. However, photographic collection is not possible for some insects that require multiple high-magnification views for identification. Public photography-based data also have biases and limitations, depending on the temporal and spatial coverage of the data (DiCecco et al. Reference DiCecco, Barve, Belitz, Stucky, Guralnick and Hurlbert2021).
Entomological collection databases, even those that focus on a specific region, include gaps in geographical coverage. This fact can present a challenge when using collection data for analyses of species distributions and changes in distributions due to anthropogenic effects (Kharouba et al. Reference Kharouba, Lewthwaite, Guralnick, Kerr and Vellend2018). Looking at more than 19 million digitised global Lepidoptera records, Girardello et al. (Reference Girardello, Chapman, Dennis, Kaila, Borges and Santangeli2019) found that spatial gaps persist in species distribution estimates, especially in areas not specifically designated for conservation and in areas with a low density of roads. Once visualised (e.g., Fig. 4), locality gaps can help to guide future biomonitoring and conservation efforts. Detailed gap analyses, using geographic coordinates and species abundances, are used to assess the overall reliability of collection datasets for species distribution assessments (Ponder et al. Reference Ponder, Carter, Flemons and Chapman2001). Similar analyses are also used as a means to target survey work in unsampled areas or in areas of potential conservation importance (Funk et al. Reference Funk, Richardson and Ferrier2005; Bini et al. Reference Bini, Diniz-Filho, Rangel, Bastos and Pinto2006).
By using only the available digitised data, it is possible to combine existing data categories or other interacting databases to add further detail. Analyses that include species habitat preference similarities – involving factors such as elevation, latitudinal range, habitat type, and ecoprovince – are possible through post-extraction work (Figs. 5, 6, 7, 8). Such meta-analyses allow testing of hypotheses of ecological interactions, historical biogeography, and human impacts on the environment. A caveat is necessary, however, when the results of different analyses are considered together. For example, because only 52.5% of Cordulegastridae records in the RBCM collection included full latitude and longitude data, the conclusions of subsequent analyses for this family have lower confidence than those for a taxonomic family with more complete geographical records.
An ecoprovince approach to analysing insect distribution in British Columbia has previously been used for Neuroptera, Megaloptera, and Rhaphidioptera (Scudder and Cannings Reference Scudder and Cannings2009), Conopidae (Diptera) (Gibson Reference Gibson2017), and Crabonidae and Sphecidae (Hymenoptera) (Ratzlaff Reference Ratzlaff2015). In all three cases, a greater species richness was observed in the southernmost ecoprovinces than in northern ecoprovinces. A similar pattern is shown here for Odonata (Fig. 5). In those earlier studies, Scudder and Cannings (Reference Scudder and Cannings2009), Gibson (Reference Gibson2017), and Ratzlaff (Reference Ratzlaff2015) suggested that the distributional differences could be due to biogeographical history or to a general lack of records from northern ecoprovinces. Our analysis also showed a separation in species similarity between the southern and coastal ecoprovinces and northern ecoprovinces (Fig. 6). Future climate change impacts are expected to affect the abiotic conditions of British Columbia’s ecoprovinces differently, with subsequent unique impacts on insect populations in those ecoprovinces (Haughian et al. Reference Haughian, Burton, Taylor and Curry2012). Ecoprovince analysis of entomological collection records is useful because insect species are often not included in conservation and biodiversity policy decisions. The reasons for this exclusion include (1) a lack of data on species distribution, (2) a lack of data on species abundance and changes in that abundance over time, and (3) a lack of data on anthropogenic impacts on individual species (Cardoso et al. Reference Cardoso, Erwin, Borges and New2011). Digitised public entomological data can help to overcome all three of these limitations.
Although not always included in entomological collections databases, elevation data can be added to specimen records post hoc through the use of other geographic databases. These data are highly valuable for downstream conservation and ecological analyses (Table 3). For example, high-elevation aquatic insects are particularly vulnerable to future climate change due to abiotic factors (Birrell et al. Reference Birrell, Shah, Hotaling, Giersch, Williamson, Jacobsen and Woods2020). Other research has found that low-elevation populations of Lepidoptera have been more severely impacted by recent climate change than higher-elevation populations (Halsch et al. Reference Halsch, Shapiro, Fordyce, Nice, Thorne, Waetjen and Forister2021). Biotic factors, especially insect–plant interactions, are also likely to change dramatically along elevational gradients under future climate change (Rasmann et al. Reference Rasmann, Pellissier, Defossez, Jactel and Kunstler2014; Adedoja et al. Reference Adedoja, Kehinde and Samways2020).
Adequate specimen preparation, complete labelling, identification to family level, and digital capture is the goal for every specimen in an entomology collection (Favret et al. Reference Favret, Cummings, McGinley, Heske, Johnson and Phillips2007). Records from old data sources can be used for new analyses, but when they are not already digitised, considerably more effort is required to extract information (Giberson and Burian Reference Giberson and Burian2017). This detailed analysis of the RBCM Odonata collection was possible only because of a previous concerted effort to digitally capture the specimen data. This effort took place over a long period (1988–2021) and involved an investment of significant labour and funds (R.A. Cannings, personal communication). A similar analysis would be less effective for other RBCM entomology collections because not all specimens are digitised and the data, in general, are incomplete. For example, 100% of the 272 drawers of Odonata specimens in the RBCM collection have been checked for specimen preparation completeness and entered into the database, whereas only 153 of the 394 drawers (38.8%) of Diptera specimens have received the same level of attention and digitisation. This means that a far smaller proportion of Diptera specimens are available for any sort of digital analysis. Furthermore, the proportion of complete records in digital databases in the RBCM entomology collection is far lower for other taxa than for Odonata. Only 20.7% of Diptera records, 36.1% of Coleoptera records, 26.1% of Hemiptera records, and 24.5% of Hymenoptera records include species-level identifications in the database.
An important but unexpected finding in our analyses was the relatively small number of trained experts whose work improves large datasets. Over 30 years ago, it was noted that entomological collections suffer from “a critical lack of both talented young workers and secure jobs for them” (Miller Reference Miller1991). The current study supports that assertion – only five taxonomists were responsible for nearly all of the species-level identifications in the RBCM British Columbia Odonata dataset (Fig. 3). A lack of trained personnel to perform the necessary improvement and digitisation of entomology collections would appear to be an imminent threat. Miller et al. (Reference Miller, Barrow, Ehlman, Goodheart, Greiman and Lutz2020) emphasised the need to fund and maintain specific training in specimen preparation, data capture, and curation. These skills are not often included in the standard training of undergraduates and graduates not working directly in natural history collections. Miller (Reference Miller1991) noted that too few programmes offer both museum experience and modern curatorial training.
New investments in entomology collection training and labour are necessary. Turney et al. (Reference Turney, Cameron, Cloutier and Buddle2015) emphasise that additional funding for natural history collections is necessary if they are to meet their role as permanent storehouses of biological voucher data. The current rate of specimen digitisation in North American entomology collections will need to increase by 400% to realistically capture most specimen data by the year 2050 (Cobb et al. Reference Cobb, Gall, Zaspel, Dowdy, McCabe and Kawahara2019). This increased emphasis on biodiversity data capture and accessibility can and should be completed with an eye to spin-off research related to general conservation and societal needs (Cobb et al. Reference Cobb, Gall, Zaspel, Dowdy, McCabe and Kawahara2019). That particularly includes conservation of biodiversity in the context of accelerating climate change. Nelson and Ellis (Reference Nelson and Ellis2018) list major governmental initiatives for digitally capturing and making available biodiversity data in the United States of America, Australia, Mexico, Brazil, Europe, and China. Although such programmes have proven successful elsewhere, a similar, well-funded government programme does yet not exist in Canada.
Conclusion
The public entomology collections of Canada are tasked with housing, organising, and making fully accessible records of entomological biodiversity. Most collections focus on a specific region or province, although almost all contain specimens from other regions of Canada or beyond. Most collections have one or more taxonomic foci, which can change over time with shifting priorities and personnel. None of these collections are private, and all of their contained data could and should be made fully available to researchers in Canada and around the world. However, that effort requires funding for training and employing collections personnel.
This study was completed as a part of a University of Northern British Columbia graduate-level course in entomological curation. The co-authors are the two instructors and five students of this course. The analyses presented were the product of a large-scale database extraction that was then analysed by the five students with guidance from the instructors. The students did not have direct access to the collections and did not interact with the specimens. As such, this analysis represents what can be done remotely with entomology collections data and how such analyses can inform biodiversity conservation. Discussions on taxonomic revision, georeferencing, and ecological notation were all components of the course. These and other skills are necessary for anybody who wishes to work with and improve entomological databases to explore ecological hypotheses and advise on conservation management policy.
Continued investment in training in entomological curation and collections management is essential. This will not only increase the rate of digitally capturing the massive backlog of biodiversity data currently locked within collections but will also increase the quality and usefulness of existing digitised collections. With new emphasis on curation and collection management training at the undergraduate and postgraduate levels, freeing even more biodiversity data from the locked cabinets of museums will become possible.
Supplementary material
The supplementary material for this article can be found at https://doi.org/10.4039/tce.2024.38.
Acknowledgements
The authors thank Rob Cannings, curator emeritus of entomology at the Royal British Columbia Museum for his dedication to the Odonata collection and for his input regarding this manuscript. The authors also appreciate the helpful comments of three reviewers.
Competing interests
The authors declare that they have no competing interests.

