


Introduction
The chemistry of mineral surfaces and the processes taking place thereon in an aqueous environment play a pivotal role in a wide spectrum of chemical, physical, and geological processes (Stumm Reference Stumm1997; Lambert Reference Lambert2008; Polubesova and Chefetz Reference Polubesova and Chefetz2014). The large surface area in combination with the retention capability impart to clay minerals important adsorption qualities with respect to organics and metal ions (Brigatti et al. Reference Brigatti, Galán, Theng, Bergaya and Lagaly2013). Probing interfacial processes remains a challenging task for experimentalists because of the complexity of the systems. Surface analytical techniques usually require separation of the solid from the aqueous solution prior to analysis with the undesirable consequence of completely changing the surface characteristics of the solid or the adsorbed species. Though such methods may be helpful in providing some insights into the nature of the interface under investigation, comparison with batch experiments may be ambiguous. With the constant effort given by experimentalists to integrate molecular data into macroscopic adsorption models extracted from isotherm measurements, probing the interface in situ is of prime importance for capturing an accurate picture of the interactions and surface modifications occurring in real systems.
In this context, attenuated total reflectance Fourier-transform infrared spectroscopy (ATR-FTIR) is particularly valuable as a molecular spectroscopic technique sensitive to both the inorganic and organic parts, and with the possibility of adapting diffusion cells on top of the internal reflection element (IRE) for probing in situ dynamical processes (Hind et al. Reference Hind, Bhargava and McKinnon2001; Lefèvre et al. Reference Lefèvre, Preočanin, Lützenkirchen and Theophile2012). Although the transmission method is usually preferred for characterizing materials using the Beer-Lambert Law, the dispersion of the refractive index and the interference phenomena are commonly ignored. In addition, the delicate task of preparing pellets of samples homogeneously diluted in a transparent matrix suitable for transmission analysis contributes to the frequency variations commonly observed in the literature for similar systems (Iglesias et al. Reference Iglesias, Ocaña and Serna1990). Unlike transmission, ATR gives a quasi-absorption spectrum which is similar but not identical to transmission (Yamamoto and Ishida Reference Yamamoto and Ishida1994). This technique greatly facilitates sample preparation and the signal recorded is usually enhanced with respect to transmission, thus enabling the measurement of single inorganic or organic layers. Interpretation of ATR spectra is more difficult, however, because of the prominence of optical effects (Hansen Reference Hansen1965, Reference Hansen1968). A direct consequence of these effects is the apparent shift in the vibrational bands and intensity variations when compared to transmission spectra making the assignment of vibrational bands more challenging.
Given this strong connection between band profiles and the instrumental setup used for analyses, infrared spectra should be regarded as a sample ‘fingerprint’ only for a given condition. The most relevant information that can be obtained from IR measurement is the optical constants of the sample which are independent of the measurement methods and allow cross-referencing with results obtained under different experimental conditions (Tolstoy et al. Reference Tolstoy, Chernyshova and Skryshevsky2003; Hasegawa Reference Hasegawa2017). Optical constants describe phenomenologically the interaction of the radiation with the matter, providing insight into the molecular structure of a material. Extracting the optical constants from the spectroscopic observables is not straightforward. Two approaches have been adopted for extracting the optical constants from reflectance spectra of clay minerals. The first is based on the Kramers-Kronig transform to analyze normal or quasi-normal reflectance data. For example, Karakassides et al. (Reference Karakassides, Petridis and Gournis1997) performed Kramers-Kronig analysis on reflectance spectra at 10° off-normal incidence to compute the optical and dielectric properties of montmorillonite clay minerals in pellet form. These analyses enabled evidence of the migration of Li+ cations into the layer structure upon thermal treatment to be recorded. Alternatively, some authors modeled the optical constants of phyllosilicate minerals by making use of dispersion theory using non-linear least-squares optimization routines and a best-fit approach (Roush et al. Reference Roush, Pollack and Orenberg1991; Esposito et al. Reference Esposito, Colangeli and Palomba2000; Glotch & Rossman Reference Glotch and Rossman2009). This approach consists of defining the vibration in a crystal lattice as a sum of the vibrations of numerous oscillators leading to dispersion equations associating the complex dielectric function as a function of the frequency. The optical constants, n(ν) and k(ν), are then determined directly from the dielectric function. The slight discrepancy usually observed in the optical constants determined by these two approaches probably originates from the sample preparation and the calculation methods. Optical constants are, therefore, macroscopic parameters, and are exactly transferable only if acquisition or sampling conditions are identical.
The determination of optical parameters is a prerequisite for advanced interpretation of structural features based on optical spectroscopy. As an example, Ras and coworkers (Ras et al. Reference Ras, Johnston, Franses, Ramaekers, Maes, Foubert, De Schryver and Schoonheydt2003, Reference Ras, Németh, Johnston, Dékány and Schoonheydt2004b, Reference Ras, Németh, Johnston, DiMasi, Dékány and Schoonheydt2004c, Reference Ras, Umemura, Johnston, Yamagishi and Schoonheydt2007b) carried out numerous studies to determine the structure and orientation of hybrid organo-clay preparations by various infrared spectroscopic methods. Those authors successfully prepared highly oriented monolayer films of clay minerals by the Blodgett-Langmuir method, enabling them to investigate, using ATR spectroscopy, the orientation and conformation of organic molecules adsorbed onto the clay minerals. Orientational determination consists of relating changes in intensity of a vibrational band obtained with the electric field oriented parallel or perpendicular to the plane of incidence to the average angle between the transition moment at the origin of this vibrational band and the electric field of the infrared radiation. These calculations require the determination of the mean squared electric field amplitudes which need the sample optical constants as input parameters. For the reasons explained above, the correctness of the determined orientational order relies heavily on the sample optical constants.
These examples illustrate that macroscopic properties such as the orientational order of a given sample are transferable only if all the input parameters enabling the determination of that property are determined on the same preparation. Motivated by this statement, the purpose of the present work was to provide ATR users with the necessary equations for computing the optical constants from polarized ATR measurements that can be used further for the quantitative interpretation of infrared spectra. The determination of the anisotropic optical constants is based on the Kramers-Kronig (KK) transform analysis applied to polarized ATR spectra of thick Na-SWy-3 montmorillonite film (Bardwell & Dignam Reference Bardwell and Dignam1985; Dignam & Mamiche-Afara Reference Dignam and Mamiche-Afara1988; Bertie & Lan Reference Bertie and Lan1996). These optical constants are then used to simulate spectra under a variety of conditions. Because the orientational order has already been treated in the literature (Grégoire et al. Reference Grégoire, Dazas, Hubert, Tertre, Ferrage, Grasset and Petit2020), the present study focused specifically on the determination of film thickness and its influence on the measured spectra, the absorption coefficient, and the qualitative influence of the presence of water.
The benefit of this methodology is three-fold. First, and for a sample with given optical constants, the simulated spectra can reveal the effects of interferences due to thickness, orientation, etc. Second, the calculations are based on optical theory, so the simulated ATR spectra evaluate only optical interferences because the sample properties are described by their experimental optical constants. Differences between the experimental and calculated spectra, therefore, may originate from changes in the sample property (such as porosity or orientation), giving evidence for specific interactions or changes in sample chemistry which affect optical properties. Third, it can help in choosing the most relevant experimental conditions for the acquisition of high-quality spectra such as the appropriate IRE element, angle of incidence, polarization angle, film thickness, and optical configurations (e.g. internal or external reflectance, normal or off-normal transmission, etc.).
Theoretical Background
Spectral Simulation
The development of the equations for extracting the optical constants treats the system as a series of stratified parallel optical boundaries as depicted in Fig. 1 The propagating radiation can pass through n phases, where phase j is described by the complex refractive index
 given by :
where n
j
(ν) is the real refractive index of the medium in phase j, k
j
(ν) is the absorption index, and
 is the related complex dielectric function. To simplify the notation, the frequency dependence of the optical constants will be deliberately omitted. In an ATR experiment (depicted in Fig. 1), phase 1 corresponds to the ATR IRE which is described optically by a constant real refractive index assuming no absorption of the incident electromagnetic radiation (n 1 = 4 for Germanium IRE and n 1 = 2.4 for diamond and ZnSe IRE). Phase 2 corresponds to the sample film, defined optically by a complex optical constant. In the case where the sample thickness is below the penetration depth of the evanescent wave, the optical constants of phase 3 need to be described explicitly, e.g. assuming air (n 3 = 1) or water (defined with complex
 ). The extent to which radiation is reflected or transmitted at an interface depends on the light polarization, the angle of incidence of the incoming radiation, and the optical constants of the phases at the interface. The observable in an ATR experiment is the reflectance spectrum, which is determined from the Fresnel amplitude coefficient,
 :
:

Fig. 1. Schematic diagram of the three-phase system. Notations are defined in the text.
The subscript i refers to the polarization direction which is either s when the electric field vector is perpendicular to the incident plane or p for a parallel electric field vector. The Fresnel coefficients are defined as the ratio of the complex amplitude of the electric field vectors of the reflected waves, E r, to that of the incident waves, E inc. They can be calculated at the interface between phases j and k if the incident angle to this interface, αj, and the optical constants of phase j and k are known according to:

where
 can be regarded as the refractive coefficient for phase j or k. Here, α1 corresponds to the angle of incidence which is set at 45° in the present study. Equations 2 and 3 allow computation of the reflectance spectra of a two-phase system, i.e. when the thickness of the sample film in the ATR IRE is larger than the evanescent wave penetration depth (a few microns). In the case where the film deposited on the ATR IRE is thinner than the penetration depth, more than one interface must be described and the incident radiation undergoes multiple reflections at each interface. Therefore, the amplitude of the reflected radiation,
 , is calculated by the summation of the reflected rays of the multiple reflection at each interface;

where
 indicates the change of the phase of the wave between phases 2 and 3 and depends on the film thickness, d. Therefore, the reflectance spectra of a three-phase system,
 , can be computed for various thicknesses, d, if values for
 of the three phases are known. For total reflectance,
 , the reflectance spectra for ATR geometry is, therefore, obtained easily from Eq. 4. Note that this method can be generalized to anisotropic layers, in which case
 must be replaced by
 and
and
 for s and p polarizations, respectively. The refractive index for the p polarization becomes
 . Therefore, spectral simulations can also be carried out for uniaxial (
 ) and biaxial (
 ) symmetry.
Determination of the Optical Constants of a Uniaxial Thick Film
The following method is applicable only if the stratified model is composed of a single interface and, therefore, the thickness of the sample is larger than the penetration depth (a few microns thick). In the condition of total reflection when the angle of incidence is greater than the critical angle,
 becomes negative even for a non-absorbing sample (k
j
→ 0) and, therefore, the Fresnel equation (Eq. 3) becomes a complex number that can be written with polar coordinate as:
becomes negative even for a non-absorbing sample (k
j
→ 0) and, therefore, the Fresnel equation (Eq. 3) becomes a complex number that can be written with polar coordinate as:
where
 corresponds to the phase shift. Therefore, in the ATR mode, the incident electric fields undergo phase shifts upon reflection even for non-absorbing samples, in contrast to external reflection at normal incidence. Given that
 is a function of the optical constants n
j
and k
j
, ln (R
1/2) and δi must satisfy the Kramers-Kronig (KK) relations. This method was applied successfully by Karakassides et al. (Reference Karakassides, Petridis and Gournis1997) for recovering the optical constants from the external reflectance spectra obtained at quasi-normal incidence. Unlike normal reflectance experiments, in the case of ATR and because of the phase shift induced by reflections under total reflection conditions, the δi determined from ln(R i
1/2) must be corrected (Plaskett & Schatz Reference Plaskett and Schatz1963; Bardwell & Dignam Reference Bardwell and Dignam1985; Dignam Reference Dignam1988; Dignam and Mamiche-Afara Reference Dignam and Mamiche-Afara1988; Ohta & Ishida Reference Ohta and Ishida1988; Buffeteau et al. Reference Buffeteau, Blaudez, Péré and Desbat1999; Boulet-Audet et al. Reference Boulet-Audet, Buffeteau, Boudreault, Daugey and Pézolet2010). Dignam and Mamiche-Afara (Reference Dignam and Mamiche-Afara1988) showed that this correction factor, Is,p, takes a particularly simple form that can be estimated readily. The phase shift for the ATR geometry is, therefore, expressed as:
is a function of the optical constants n
j
and k
j
, ln (R
1/2) and δi must satisfy the Kramers-Kronig (KK) relations. This method was applied successfully by Karakassides et al. (Reference Karakassides, Petridis and Gournis1997) for recovering the optical constants from the external reflectance spectra obtained at quasi-normal incidence. Unlike normal reflectance experiments, in the case of ATR and because of the phase shift induced by reflections under total reflection conditions, the δi determined from ln(R i
1/2) must be corrected (Plaskett & Schatz Reference Plaskett and Schatz1963; Bardwell & Dignam Reference Bardwell and Dignam1985; Dignam Reference Dignam1988; Dignam and Mamiche-Afara Reference Dignam and Mamiche-Afara1988; Ohta & Ishida Reference Ohta and Ishida1988; Buffeteau et al. Reference Buffeteau, Blaudez, Péré and Desbat1999; Boulet-Audet et al. Reference Boulet-Audet, Buffeteau, Boudreault, Daugey and Pézolet2010). Dignam and Mamiche-Afara (Reference Dignam and Mamiche-Afara1988) showed that this correction factor, Is,p, takes a particularly simple form that can be estimated readily. The phase shift for the ATR geometry is, therefore, expressed as:

for the s-polarization

for the p-polarization
where n ∞ represents the refractive index of the sample at infinite wavenumber in a region of zero absorbance. This value was estimated based on a best fit approach between the simulated and experimental ATR spectra for various film thicknesses. The best agreement was obtained by setting n ∞ = 1.4. The calculation of the phase shift according to Eq. 6 requires reflectivity data over the complete frequency range, zero to infinity. In practice, the spectra are obtained over a limited frequency range. The truncation at high and low wavenumber, therefore, imposes a limitation on the accuracy achievable using the KK transformation but should be relatively small because the experimental values of ln(R
1/2) at the cut-off wavenumbers are very small and constant. The KK transformation was implemented numerically by the Maclaurin formula, providing better accuracy than the double Fourier transform (Ohta & Ishida Reference Ohta and Ishida1988; Huang & Urban Reference Huang and Urban1992). The Fresnel reflection coefficient was then calculated from Eq. 5 and the in-plane,
 , and out-of-plane,
 , complex dielectric functions were obtained through the following relations:
Then,
 are determined directly using Eq. 1. Note that using solely the s-polarized spectra for the KK transform according to the corresponding equations allows the determination of the isotropic optical constants.
Materials and Methods
Clay Minerals
The SWy-3 montmorillonite was obtained from the Source Clays Repository of The Clay Minerals Society. The <1 μm size fraction was collected by centrifugation and Na-saturated using three saturation cycles in a 1 M NaCl solution. The excess salt was removed by dialysis until the Cl– anion was not detected by the AgNO3 test. The concentration of the resulting suspensions of Na-SWy-3 montmorillonite was 24.7 g/L.
Spectral Acquisition
All spectra were recorded using a Nicolet IS50 Fourier-transform infrared spectrometer (ThermoScientific Co., Waltham, Massachusetts, USA) equipped with a DLaTGS detector and a KBr beamsplitter. The ATR spectra were acquired with the VeeMaxIII accessory (Pike Technologies, Fitchburg, Wisconsin, USA) fitted with a 45° angle germanium IRE having a crystal diameter of 20 mm and giving a penetration depth of 650 nm at 1000 cm–1 (assuming n 2 = 1.4). The germanium IRE was thermoregulated at 25°C for all experiments. The angle of incidence, α1, was set to 45°. The electric field of the incident infrared beam was polarized either perpendicular (s) or parallel (p) to the plane of incidence using a ZnSe wire grid polarizer placed in the optical beam path before the sample compartment. For a 45° incidence angle and isotropic samples, the intensity ratio Ap/As should equal 2. This was confirmed by determining the polarization of a methanol solution deposited on the ATR IRE and covered tightly to prevent evaporation. In the present experimental setup, the Ap/As ratio was 1.97, suggesting an efficient polarization of the electric field. To compensate for the deviation from 2, a factor of 1.016 was applied to all p-polarized spectra.
Spectra were acquired with a 4 cm–1 resolution and 100 scans were co-added in the range 4500–400 cm–1 using a Happ-Genzel apodization. The spectra were never smoothed or deconvolved. The only correction was a baseline adjustment in some cases. Background and sample spectra were acquired under the same conditions as using s and p polarized radiation.
Spectral Simulation
A MatLab© (Software version R2017b) computer program was used to process the ATR spectra acquired from anisotropic layers. Some input parameters were required, including the incidence angle of 45°, the electric field polarization (i.e. s or p), the number of layers (i.e. 2 or 3), and the IRE refractive index (2.4 and 4 for diamond and germanium IRE, respectively).
Film Preparation
A simulation of ATR spectra under various experimental conditions required prior determination of the optical constants of the Na-SWy-3 montmorillonite film. A volume of 500 μL of the stock dispersion (24.7 g/L) was first deposited on the Ge IRE and allowed to dry at 25°C. Then, s- and p-polarized spectra were acquired. This methodology ensured that the thickness of the sample film was much larger than the penetration depth (a few microns thick). The as-obtained s- and p-polarized spectra were then used for the extraction of the anisotropic optical constants (
 using Eqs 5, 6, and 7.
The optical constants obtained were used later to simulate ATR spectra for films of various thicknesses, which were then compared with the experimental spectra. The thickness of the experimental film, d, was estimated based on the Na-SWy-3 montmorillonite unit-cell formula, assuming one layer of water as expected at room temperature and ambient humidity, corresponding to an estimated density of 2.3 g/cm3. Targeted film thicknesses ranging from ~7 to 230 nm were obtained by pipetting 100 μL of various dilutions (using methanol) of the Na-SWy-3 stock dispersion onto the Ge IRE, covering the entire surface area of 314 mm². Because the Ge surface is hydrophobic, dilution with methanol resulted in better wettability and ensured homogeneous film thickness over the IRE surface. When the methanol was fully evaporated and the sample was equilibrated with ambient humidity, s- and p-polarized spectra were acquired. The estimated thickness was entered into the model for the simulation of the ATR spectra. Based on a best-fit approach, a variation of ±10% of the targeted d value was allowed, accounting for changes in surface rugosity and porosity and to compensate for measurement precision and accuracy during suspension preparation.
For one experiment, a film with an estimated thickness of 14 nm was first deposited on the Ge IRE, and washed with deionized water several times until no more changes in the vibrational intensity of the Na-SWy-3 film were observed. ATR spectral simulation was performed by adjusting the thickness of the sample in the simulation until a qualitatively good match was obtained between the experimental and calculated intensity of the clay-mineral film. The best fit was obtained with an input thickness of 7 nm. In order to evaluate the influence of water on the top of the clay film, a drop of deionized water was added and polarized spectra were acquired where the corresponding polarized background spectra were from bulk water alone.
Results and Discussion
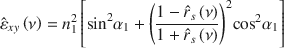
In order to confirm the optical anisotropy of clay platelets, FTIR transmission measurement was performed. The absorption intensity of an infrared radiation relies on a scalar product of the vibrational transition moment amplitude and the amplitude of the electric field of the radiation. Accordingly, absorption bands are observable only if the angle between the electric vector and the transition moment varies from 90°. In the case of oriented samples measured through transmission at normal incidence with s- and p-polarized radiation, only transition moments within the plane of the absorbate result in absorption (Margulies et al. Reference Margulies, Rozen and Banin1988). The transmission spectra of the Na-SWy-3 sample oriented by drop-casting onto a ZnSe substrate and acquired at normal incidence using polarized radiation in the spectral range 700–1400 cm–1 (Fig. 2a) showed the vibrational signatures of the clay layers. Roughly, the region between 700 and 950 corresponds to hydroxyl bending vibrations from the octahedral sheet, whereas the region 1000–1400 cm–1 is usually assigned to Si–O stretching vibration of the tetrahedral sheet (Farmer & Russell Reference Farmer and Russell1964). For both s- and p-polarization, the absorbance spectra are similar, suggesting that the in-plane transition moments are isotropically distributed within the plane of the sample. Taking advantage of the Berreman effect, tilting the sample with respect to the radiation at an angle of 40° enabled the out-of-plane transition moment to be excited (Berreman Reference Berreman1963). The absorbance spectra (Fig. 2b) displayed noticeable differences around 1085 cm–
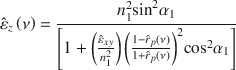
1 that correspond to a transition moment almost perpendicular to the plane of the film. Samples with transition moments that are isotropically distributed within the sample plane and anisotropically distributed in the perpendicular direction are called transverse isotropic systems. As a consequence, a proper description of the optical properties of clay minerals requires the determination of the optical constants in a uniaxial symmetry (
 ).
).
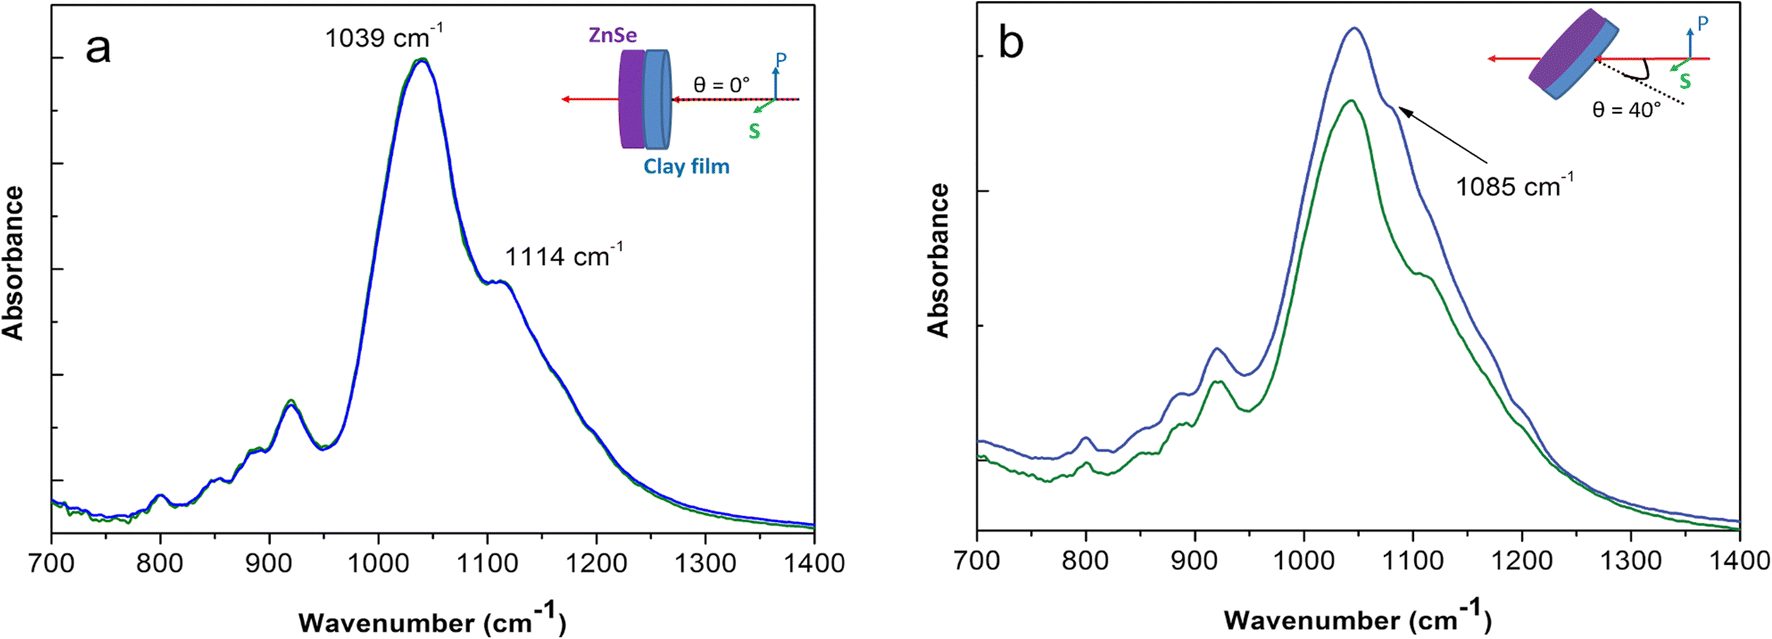
Fig. 2. a Normal and b 40° off-normal transmission spectra of Na-SWy-3 montmorillonite film on a ZnSe substrate with s- (green) and p- (blue) polarization.
Determination of Anisotropic Optical Constants from Polarized ATR Measurements
The advantage of ATR geometry is that it enables the computation of both the in-plane,
 , and out-of-plane,
 , optical constants of a thick film of Na-SWy-3 montmorillonite from a single preparation. As stated in the Introduction, the Fresnel reflection coefficients were determined from the experimental ATR reflectance spectra (Fig. 3a) by taking advantage of the KK relationship (Eqs 5, 6). As a result, no fitting procedure was required because all calculations were based on the recorded reflectance spectra and the ATR experimental setup. While the dielectric function described the response of the materials to electromagnetic radiation, the exact resonance frequency of vibrational modes cannot be accessed experimentally. Although the experimental position of a reflectance band might be close to the resonance frequency, a slight shift is often observed and accounted for by sample porosity and by particle shape and size on which the macroscopic dielectric function depends. The dielectric function determined from the Fresnel coefficients using Eq. 7 has to be considered as a macroscopic function that may be different from the microscopic dielectric function which depends only on the resonant vibrational frequency of an IR-active mode. Both macroscopic and microscopic dielectric properties can be connected using an effective medium approach, although retrieving the intrinsic dielectric functions from the measured ATR spectra and the Fresnel reflection coefficient is a challenging task.

Fig. 3. a ATR reflectance spectra from a thick Na-SWy-3 montmorillonite film, b the determined real part, n 2 , and c the imaginary part k 2 of the anisotropic optical constants. The dashed line in Fig. 3b represents the maximum n 2 value permitted to satisfy the total reflection conditions using Ge ATR.
Alternatively, a modeling strategy was developed by Balan and co-workers (Balan et al. Reference Balan, Mauri, Lemaire, Brouder, Guyot, Saitta and Devouard2002, Reference Balan, Delattre, Roche, Segalen, Morin, Guillaumet, Marc Blanchard, Lazzeri, Brouder and Salje2011; Aufort et al. Reference Aufort, Ségalen, Gervais, Brouder and Balan2016) for calculating the ATR spectra of powder samples by ATR spectroscopy. It consists of calculating the ATR spectra from an oscillator model using vibrational mode frequencies determined by first-principles quantum mechanics to derive the microscopic dielectric functions. An approximate macroscopic dielectric function is then calculated by considering the substance of interest to be embedded in a matrix which is described by its own dielectric property. Given that the determined macroscopic dielectric properties are a ‘fingerprint’ of the sample being analyzed, the reported optical constants in the present study are solely those of the film prepared here, which is likely different from the mineral itself. The in-plane,
 and out-of-plane,
 , optical constants (Fig. 3b,c) were determined from the anisotropic dielectric function using Eq. 1. The optical constants n and k being related to one another by the KK relationship, the n spectrum follows a derivative shape at the maximum intensity of the k spectrum. Given that the determination of
 and
and
 has never been performed on clay minerals in the infrared region, comparison with already published optical constants can be achieved only by averaging the anisotropic optical constants to obtain the isotropic optical constants
 . The
. The
 values determined in this work were slightly different from those already published based on the Drude-Lorentz dispersion theory (Roush et al. Reference Roush, Pollack and Orenberg1991; Esposito et al. Reference Esposito, Colangeli and Palomba2000; Glotch & Rossman Reference Glotch and Rossman2009). Given that the optical constants are always determined from the recorded reflectance spectra, the discrepancies very likely originate from the sample preparation and the calculation methods.
Strong dispersion of n xy associated with intense absorption of k xy was observed in the Si–O stretching region at 1039 cm–1; the anomalous dispersion of the n xy curve reached a maximum value of 2.73 at 1004 cm–1 (Fig. 3b). Recalling that total reflection occurs only when the incident angle is greater than the critical angle, one may calculate the maximum value that n 2 can reach to satisfy this condition. For Ge IRE (n1 = 4) and assuming an incident angle of 45°, the maximum n 2 value is 2.83 while for diamond IRE (n1 = 2.4) this value was 1.70. Because the experimental value of 2.73 was below the maximum value for Ge IRE, the condition of total reflection was respected for both polarizations and within the whole wavelength range investigated. Using diamond or ZnSe IRE is expected to be more problematic for reliable ATR measurements because the condition of total reflection is not fulfilled and the critical angle will be larger than the incident angle in the wavenumber range 850–1030 cm–1. A frequency shift or distortion of bands, therefore, would be predicted in the ATR spectra when using a low refractive index crystal like diamond or ZnSe. The easiest and most convenient way to reduce these effects is to select a high refractive index crystal, such as Ge IRE, to ensure that the angle of incidence will be well above the critical angle (Boulet-Audet et al. Reference Boulet-Audet, Buffeteau, Boudreault, Daugey and Pézolet2010). Note that verifying the optical conditions for ATR measurement is a prerequisite for quantitative analysis of ATR spectra.
The maxima in the k xy and k z spectra are related directly to the magnitude of the transition moment (Wilson Edgar Reference Wilson Edgar1980) and to its direction (Fraser and MacRae Reference Fraser and MacRae1973). Therefore, all the information about particle orientation is included inherently in the in-plane, k xy , and out-of-plane, k z , extinction coefficients. Examination (Fig. 3c) of vibrations in the range 1000–1200 cm–1 assigned to tetrahedral sheet transition moments does not present a clear orientation because each vibrational mode includes in-plane and out-of-plane components. The bending of the hydroxyl groups in the octahedral sheet decomposes into four different vibrations, usually assigned to AlAlOH, FeAlOH, MgAlOH, and MgFeOH located at 919, 883, 842, and 800 cm–1, respectively. These bands are highly responsive to polarization, with some having mainly in-plane (MgAlOH and AlAlOH) or out-of-plane (FeAlOH and MgFeOH) transition moments in good agreement with the results from Ras et al. (Reference Ras, Johnston, Franses, Ramaekers, Maes, Foubert, De Schryver and Schoonheydt2003). Those authors rationalized their results by suggesting that the orientation of the hydroxyl groups depends on the nature of the nearest cations in the octahedral sheets. Although the nature of the octahedral cations may influence substantially the orientation of hydroxyls, these modes are likely coupled with other vibrations in the tetrahedral units that may alter their responses toward polarization (Larentzos et al. Reference Larentzos, Greathouse and Cygan2007).
Spectral Simulations from the Optical Constants
Now that phase 2 in Fig. 1 is optically defined by the
 and
and
 values determined for the Na-SWy-3 film, exact spectral simulations can be performed to examine the spectral profiles under various conditions. Given that an ultra-thin film, in combination with surface-sensitive techniques, can provide valuable information about interfacial phenomena, emphasis was given to the influence and benefits of different optical configurations (e.g. transmission, internal or external reflections, etc.) that could give complementary information or improved sensitivity when used together. Focusing more specifically on ATR methods, spectral simulation allows estimation of the sample thickness and highlighting of changes in the spectral profile due to the variation of the sample thickness. In a final example, the influence of water or air as the top layer on the ATR spectra was investigated quantitatively.
Choosing the appropriate optical configuration for Na-SWy-3 thin film analysis.
Because the wavelength of infrared radiation (2–20 μm) is much greater than the dimensions of the crystal unit cell, only long-wavelength lattice modes interact with the incident light. These optical modes are described with respect to the phonon propagation direction: the transverse optical modes (TO) in which the atomic displacements are perpendicular to the direction of the periodicity of the wave-vector and the longitudinal vibration (LO) where the displacements are parallel to the wave vector. The frequencies of the LO and TO phonon modes are defined with respect to the intrinsic dielectric function. Because of the macroscopic nature of the dielectric function obtained through the KK transform, only the TOi and LOi energy loss functions, defined as imag
 and imag
 , respectively, are accessible, and described the TO and LO surface modes of a thin crystallite layer (Fig. 4a,b). They are used conveniently for describing the spectral shape depending on the optical configuration regardless of whether the TO and LO phonon modes are known. Determination of the TO and LO energy loss functions could, therefore, be of valuable assistance for choosing the appropriate optical configuration thanks to the various surface selection rules observed in the thin film. For example, simulated spectra under various optical configurations assuming a film thickness, d, of 20 nm was calculated with Eqs 2–4 (Fig. 4c–g). Because of the transverse nature of electromagnetic radiation, infrared optical measurement of a uniaxial oriented thin film using either s- or p-polarized light only activates in-plane TOxy and LOz surface modes from surface-parallel or surface-perpendicular transition moments, whichever the experimental setup used. The TOxy and LOz energy loss function were, therefore, plotted along with the calculated spectra to identify better the nature of the transition moment involved as a function of the optical configuration. As far as normal transmission is concerned, the simulated spectrum profile was close to the TOxy energy loss function and, therefore, this optical method activated only surface-parallel transition moments, independently of the polarization (Fig. 4c). In a very similar way, the same information can be obtained from external reflectance measurement at normal (or near-normal) incidence (Fig. 4d). These two optical methods are sometimes used for calculating the in-plane optical constants,
 . Berreman (Reference Berreman1963) demonstrated that acquisition of IR transmittance spectra at off-normal incidence allowed the activation of LO surface modes using p-polarized radiation (Fig. 4e). Indeed, at oblique incidence, the p-polarized radiation gives rise to two components that are parallel and perpendicular to the film surface and, hence, excites both TOxy and LOz surface modes, respectively. Both surface-parallel and surface-perpendicular components of the transition moment are then activated and the spectral profile is, therefore, a combination of the TOxy and LOz energy loss functions. Using s-polarized radiation enables the recording of only the surface-parallel component of a transition moment, very similar to what is obtained using classical transmission techniques. This is very similar to ATR spectroscopy, and further demonstrates the benefit of this technique for extracting the anisotropic optical constant or for carrying out orientational measurements (Fig. 4e,f). Reflection-absorption at grazing angles on a thin film deposited on a metal substrate may be of interest because in this condition the p-polarized radiation couples with the surface-perpendicular component of the transition moment (Ras et al. Reference Ras, Németh, Johnston, Dékány and Schoonheydt2004a). The spectrum, therefore, is driven essentially by the LOz energy-loss function (Fig. 4g). Only the most classical optical configurations are illustrated here. The methodology based on the calculations of the Fresnel coefficient enable experimenters to determine the best experimental conditions simply by changing some variables such as film thickness, incidence angle, etc.

Fig. 4 TO and LO energy-loss functions for a in-plane and b out-of-plane components. Spectral simulations of a 20 nm-thick Na-SWy-3 film under different optical configurations: c normal transmission, d external reflection on a dielectric substrate (SiO2), e off-normal transmission, f ATR, and g external reflection at grazing angle on metallic substrate (gold). The transmission Fresnel coefficients equations were taken from Milosevic (Reference Milosevic2004).
Estimation of sample thickness and its influence on the ATR spectra.
From the determination of the in-plane and out-of-plane optical constants of the montmorillonite studied, infrared spectra of multi-layer systems can be computed for a variety of incidence-angle, polarization, and layer-thickness conditions using the formalism detailed in the Theoretical Background section. The benefit of such simulations lies in a better understanding of the origin of the experimental spectral profile, and allows evaluation of whether the observed spectral changes originate from optical effects or chemical effects resulting from specific interaction or ordering. To illustrate this point, clay films of different thicknesses were deposited on the IRE surface and the polarized spectra were acquired and compared to the calculated ones when the estimated thickness was entered into the model (Fig. 5). To account for potential changes in particle orientation as a function of the film thickness, the s- and p-polarized ATR spectra, As and Ap, were converted to isotropic spectra, A0, according to the relation:
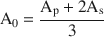
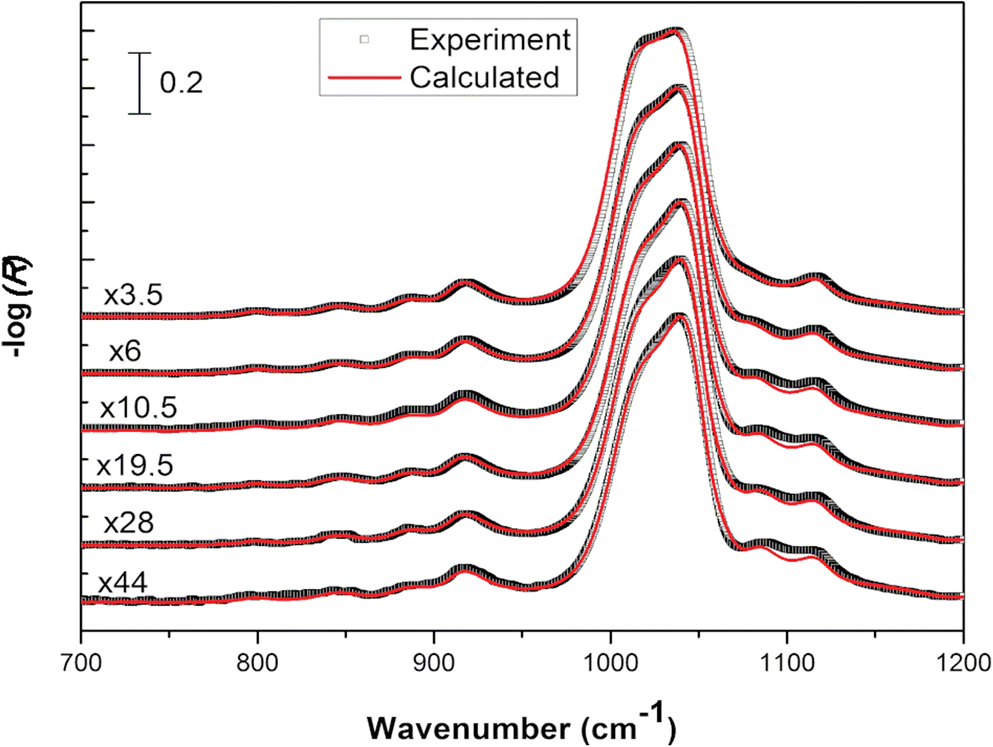
Fig. 5 Comparison of experimental spectra of variable-thickness Na-SWy-3 montmorillonite films on Ge IRE and spectra calculated using the three-layer model described in the Theoretical Background section for the same estimated sample thicknesses. From bottom to top, film thickness: 14, 22, 33, 63, 120, and 230 nm.
The calculated and experimental spectra were in fairly good agreement, suggesting that the calculation method of
 and
and
 is accurate (Fig. 5). Thus, the variation in position of the vibrational bands accounts mainly for optical interferences within the film thickness. Deviations between the calculated and experimental spectra may arise from the surface rugosity and probably from the variation of film porosity for different thicknesses which are not explicitly taken into account in the simulations.
Using the n 2 and k 2 optical constants, s- and p-polarized ATR spectra were simulated for various film thicknesses (Fig. 6). In this condition, the orientation of the clay particles was reflected in the determined anisotropic optical constants and implicitly taken into account. The spectral profiles for s- and p- polarization displayed appreciable variations as the thickness of the clay film increased. The origin of these changes was attributed only to optical effects which depend on the surface: volume ratio of the film as well as on the electric field amplitude along the film thickness (Harrick Reference Harrick1965). Interestingly, a mode appeared for thin films at 1085 cm–1 which shifted to a lower wavenumber when the thickness increased. The frequency of this mode was correlated to the LOz surface modes of Si-O describing the vibration of the silicon with apical oxygen (Fig. 4b). The strong z-orientation of this mode has been used to determine the orientation of a particle with respect to the laboratory frame (Johnston and Premachandra Reference Johnston and Premachandra2001; Ras et al. Reference Ras, Johnston, Franses, Ramaekers, Maes, Foubert, De Schryver and Schoonheydt2003, Reference Ras, Schoonheydt and Johnston2007a; Amarasinghe et al. Reference Amarasinghe, Katti and Katti2008).
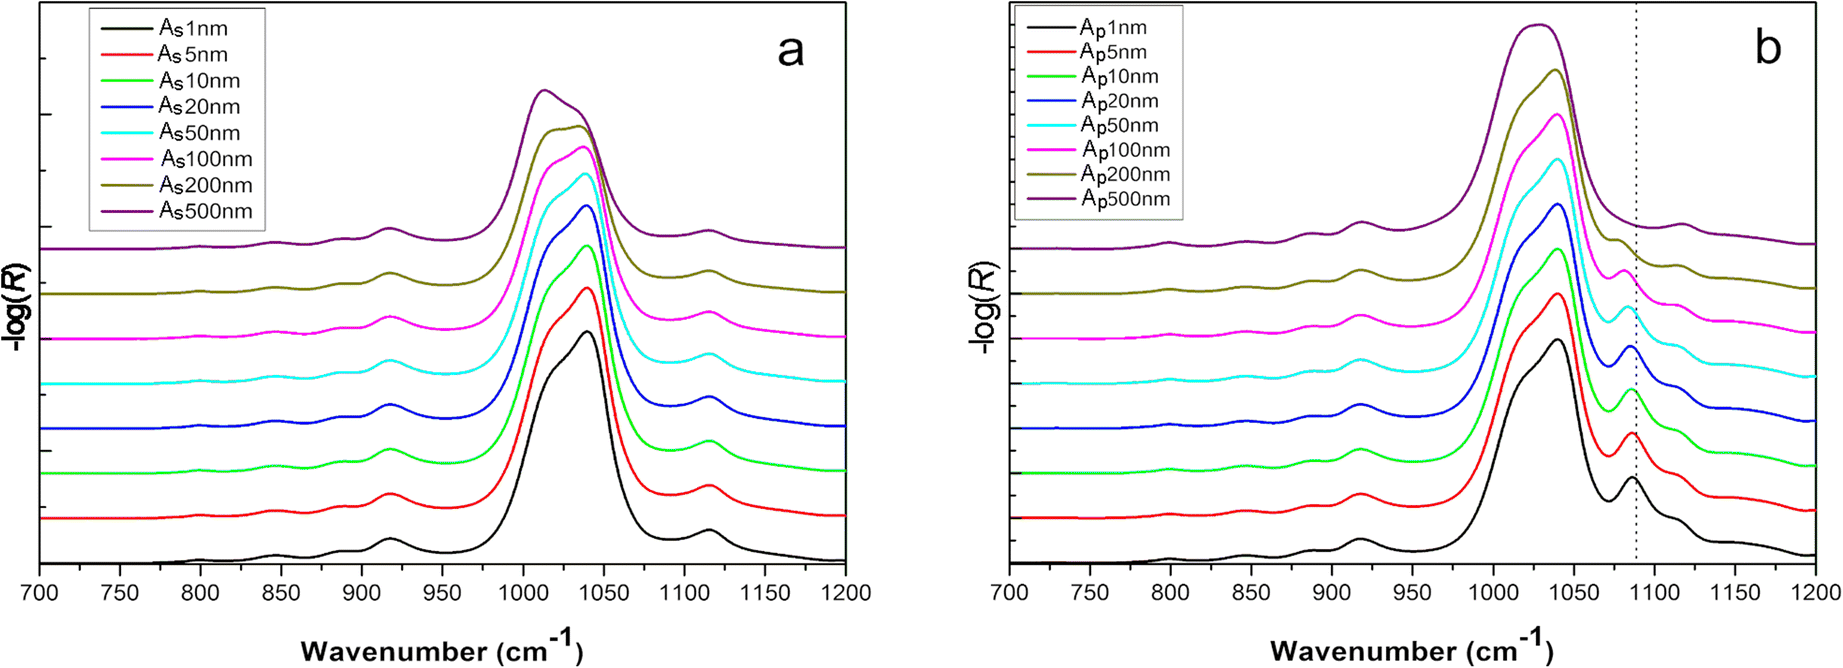
Fig. 6 Calculated s- (a) and p-polarized (b) spectra of Na-SWy-3 montmorillonite of various thicknesses on Ge IRE. For the sake of clarity, all spectra were normalized to the most intense vibrational band.
This mode shifted linearly to a lower wavenumber when the film thickness increased in the range 1–150 nm (Fig. 7a). If an electromagnetic radiation propagates along an oriented film (and the electric field is perpendicular to the film surface), positive ions and negative ions will be displaced to one or the other extremity of the film, respectively. This separation of charges creates an additional electric field perpendicular to the film plane, the frequency of which varies with the incident wave frequency. These charge displacements contribute to an additional restoring force with respect to their equilibrium position. This force can be assimilated into the perpendicular force at the front of a longitudinal wave. Therefore, the frequency of this transverse wave will be close to the LO surface modes. When a thick film is deposited on an IRE, the frequency of LO surface modes decreases and shifts toward the TO surface modes because the contribution of surface charge to the internal field created decreases. When the electric field is parallel to the film plane (the wave propagates in the normal direction to the film surface), no additional field arises because the crystal is considered as an infinite plane, so the frequency corresponds to that of the transverse vibration in the infinite crystal.
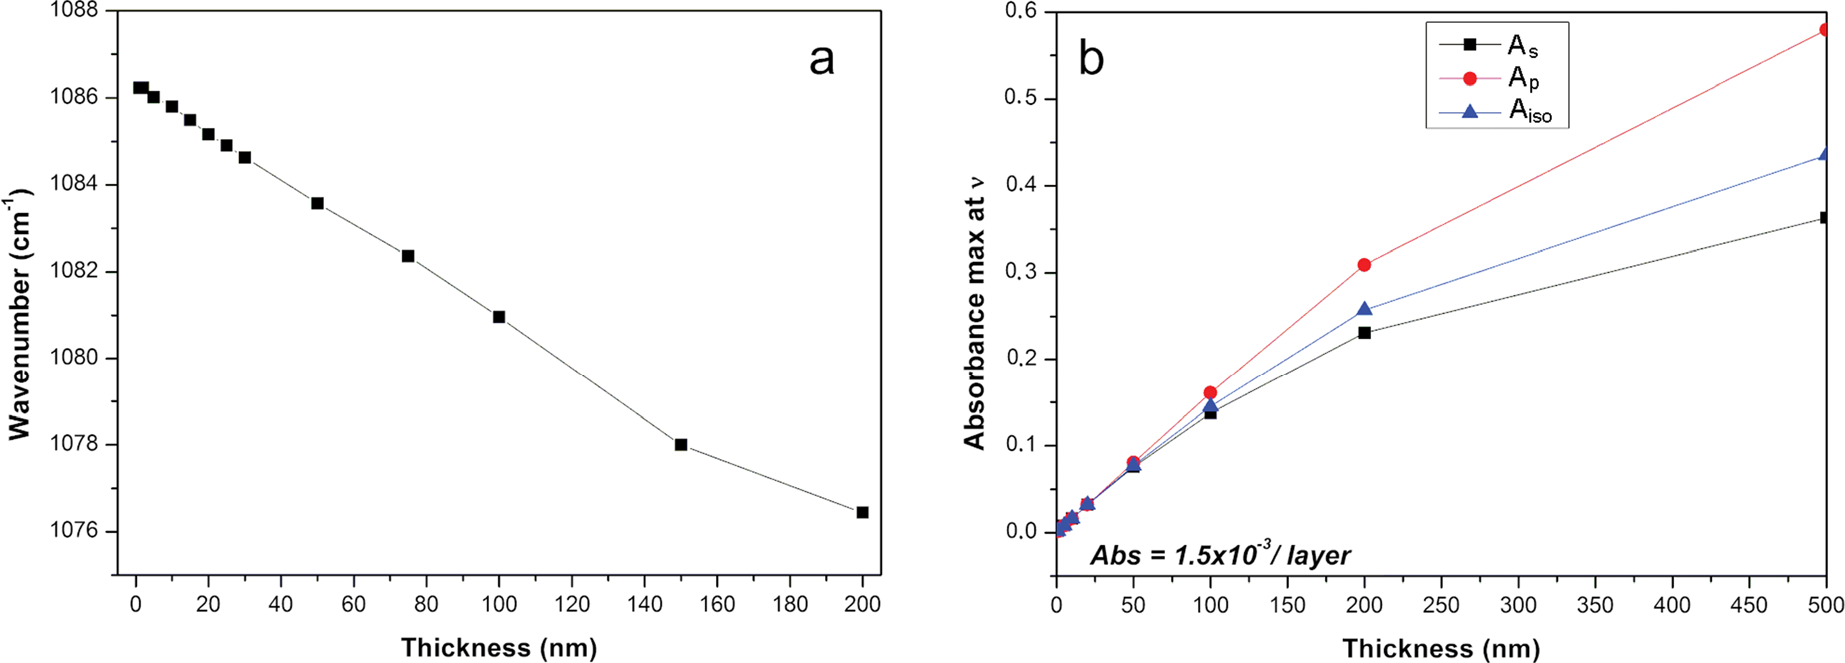
Fig. 7 Evolution of thickness dependence of a LOz surface mode frequency from 1085 cm–1 and b TOxy surface mode intensity at 1039 cm–1.
Note that the intensity of this LO surface mode also varied with the film thickness modifying the dichroic ratio (As/Ap), although the orientation of the particle was unchanged. As a consequence, the sample film thickness needs to be controlled carefully if the determination of particle orientation in a thin clay film is targeted. In order to determine experimentally the film thickness, the most intense Si–O stretching mode at 1039 cm–1 can be used. The absorbance was linearly correlated to the film thickness in a rather narrow range from 1 to 100 nm (Fig.
7b). This contrasts with transmission measurements where the absorbance was proportional to the concentration of particles. The methodology presented here based on the prior determination of
 and
and
 thus represents an efficient way to estimate the film thickness (Fig. 5). Alternatively, a modified form of the Beer-Lambert Law accounting for reflectivity is often used in the literature.

The application of this equation requires the determination of the Naperian absorption coefficient, α, and the effective thickness, d e. The effective thickness introduced by Harrick is defined as the hypothetical thickness that would result in the same absorbance value in a transmission measurement as obtained from ATR experiments (Harrick & Beckmann Reference Harrick, Beckmann, Kane and Larrabee1974). The effective thickness is actually much greater or much less than the actual film thickness because it represents only an equivalent pathlength in a transmission spectrum. Owing to the exponential decay of the electric field along the film thickness, the determination of the electric field amplitude needs to be estimated (Harrick Reference Harrick1965). The approximate equations proposed by Harrick for the determination of the electric field amplitude are applicable for only very weak absorbers (k tends to zero) which is not the case for the Si–O stretching vibrations (Fig. 3c ).
The Napierian absorption coefficient, α, is a more reliable parameter that can be compared directly to transmission measurements. It is defined by:

In order to enable comparison with transmission measurements, and recalling that only in-plane vibrational modes are accessible at normal incidence transmission, the extinction coefficient, k y , must be selected. From Eq. 29, the experimentally determined absorption coefficient for the Si–O band is 2.94×104 cm–1. For comparison, a value of 3.60×104 cm–1 was reported by Johnston and Premachandra (Reference Johnston and Premachandra2001). Those authors determined the absorption coefficient by the transmission method whereby the Na-SWy-3 montmorillonite film thickness was evaluated by weighing the dried residue on an IR transparent substrate of known dimensions. The slight difference in the determination of the absorption coefficient with these two methods is likely due to variation in particle orientations. Note that the methodology presented here requires the preparation of a single sample, the thickness of which is controlled by the limited penetration depth of the evanescent wave. The sample thickness can, therefore, be assumed to be homogeneous throughout the sample, well above the penetration depth for the entire wavelength range. For a 1 nm thick film, corresponding to the thickness of a unique smectite layer, the intensity of the Si–O vibration is calculated to be 1.6×10⁻³ which confirms the value of 1.5×10⁻³ determined by Johnston and Premachandra (Reference Johnston and Premachandra2001) and Ras et al. (Reference Ras, Johnston, Franses, Ramaekers, Maes, Foubert, De Schryver and Schoonheydt2003) by transmission measurements. As suggested by those authors, a single layer of smectite is measurable by use of a modern FTIR spectrometer, where the sensitivity is ~1×10⁻⁵. The very similar results obtained by ATR and transmission methods demonstrate clearly that ATR spectroscopy is a versatile method enabling quantitative measurements.
Contribution of the surrounding medium to ATR spectra: air and water.
Another benefit of ATR spectroscopy lies in the possibility of in situ analysis of dynamical processes. Typically, a liquid cell is mounted on the ATR IRE where a thin film of a material was previously deposited. Solutions of interest are then injected through the liquid cell and spectra are recorded to monitor the interactions between the film and the solute (Schampera and Dultz Reference Schampera and Dultz2009; Lefèvre et al. Reference Lefèvre, Preočanin, Lützenkirchen and Theophile2012; Schampera et al. Reference Schampera, Šolc, Tunega and Dultz2016). For quantitative analysis of these interactions, the effect of the solution on top of the sample on the ATR spectra of materials has to be determined. Intuitively, the presence of water instead of air on top of the deposited film at the IRE surface contributes to the variation in the Fresnel reflection coefficient which is correlated with changes in the optical indices at the interfaces according to Snell’s Law. In order to ascertain whether vibrational changes are correlated to interactions at the solid/liquid interface, optical effects must first be determined.
The calculation of s- and p-polarized spectra of a thin montmorillonite layer with an estimated thickness of 7 nm was deposited on a Ge IRE (Fig. 8a). Given that this thickness is less than the penetration depth of the evanescent wave, a third semi-infinite layer of either air or water was considered on the top of the sample film. The optical constants of water were determined using the same methods as in the Theoretical Background section for a thick layer of water. While the position of vibrational bands was strictly identical for both models, clear modification of band intensity was observed for some specific bands. The out-of-plane Si–O stretching band located at 1085 cm–1 appeared with a higher intensity when water was considered as the third layer. This variation was associated with drastic changes in the mean squared electric field components along the z axis. Therefore, only dipole moments having a non-zero component in the z direction will be affected by changes in the refractive index of the third layer. Unlike the s-polarized spectra where only in-plane transition moments were excited, the influence of a water layer instead of an air layer was only observed in the p-polarized spectrum (Fig. 8b
). The intensity of the strongly polarized out-of-plane Si–O stretching band was enhanced when the film was immersed in water. However, these results must be considered in a qualitative way. Indeed, the simulation of the thin layer assumed that the orientation of particles was similar to that of the bulk material from which the anisotropic optical constants,
 and
and
 , were determined. The discrepancies between the simulated and experimental spectra accounted for this variation of particle organization which was well reflected in the intensity of the in-plane and out-of-plane Si–O bands.

Fig. 8. a Calculated and b experimental spectra of a thin Na-SWy-3 montmorillonite film at the interface between air or water.
Conclusions
The ATR-FTIR technique is a powerful method for studying molecular-scale interactions at the interface between a clay surface and a solute. Compared to a transmission measurement, ATR spectra appear more complicated because of the significant contribution of optical effects. In this study, a general formalism to simulate ATR spectra for clay minerals, relying on the experimental determination of the optical constants, was introduced. In combination with polarized incident radiation, the anisotropic optical constant in the infrared region was determined for the first time on a montmorillonite film. These optical constants allow the quantitative determination of sample thickness and the assessment of the effect of experimental conditions on the recorded spectra. The formalism was based solely on the classical theory of electromagnetic wave propagation in layered media, so differences between the calculated and the experimental spectra allow optical and chemical effects to be differentiated.
ACKNOWLEDGMENTS
The CNRS interdisciplinary “défi Needs” funding program (Project DARIUS) is acknowledged for providing financial support for this study. The authors acknowledge financial support from the European Union (ERDF) and "Région Nouvelle Aquitaine." The authors thank J.W. Stucki (Editor-in-Chief), G. Chryssikos (Associate Editor), the anonymous reviewers, and C.T. Johnston for their comments which greatly improved the quality of the manuscript.
Compliance with ethical standards
Conflict of Interest
The authors declare that they have no conflict of interest.


