Malnutrition is a frequent problem in aged individuals. Whereas the prevalence in free-living elderly ranges between 5 and 10 %(Reference Vellas, Lauque and Andrieu1), it can reach up to 60 % in institutionalised individuals(Reference Saletti, Lindgren and Johansson2, Reference Suominen, Muurinen and Routasalo3). The aetiology of malnutrition is multifactorial and the consequences are severe: a decrease in functional status(Reference Elia, Ritz and Stubbs4) and consequently high dependency, an impaired quality of life(Reference Crogan and Pasvogel5) as well as higher morbidity and mortality(Reference Sullivan and Walls6, Reference Persson, Brismar and Katzarski7).
Depression is a further common health problem in late life with prevalence rates of up to 45 % in the institutionalised elderly(Reference Jongenelis, Pot and Eisses8–Reference Teresi, Abrams and Holmes10). The consequences of untreated depression are manifold and cause an increased use of health care and medical services(Reference Webber, Martin and Harker9, Reference Smalbrugge, Pot and Jongenelis11), affect quality of life and well-being negatively(Reference Smalbrugge, Pot and Jongenelis11) and can cause increased mortality(Reference Rovner, German and Brant12). Despite growing evidence that depression is a problem especially in the institutionalised elderly, only little attention is paid to this fact(Reference Teresi, Abrams and Holmes10). Depression very often remains undiagnosed and therefore untreated(Reference Webber, Martin and Harker9, Reference Teresi, Abrams and Holmes10).
The causal relationship between depression and nutritional status is still unclear. Several studies indicate that depression is a major factor contributing to weight loss in the elderly(Reference Morley and Kraenzle13, Reference Blaum, Fries and Fiatarone14). While depression is associated with weight gain in individuals before age 50 years, it leads to weight loss after that age, as was observed in a cohort of US adults(Reference DiPietro, Anda and Williamson15). Moreover, studies in hospitalised and community-dwelling elderly showed that depression increased the risk of impaired nutritional status and observed that malnourished patients had higher depression scores(Reference German, Feldblum and Bilenko16, Reference Cabrera, Mesas and Lopes Garcia17).
The aim of the present study was to assess nutritional status and prevalence of depression and associations between both. Furthermore, we wanted to explore their impact on self-caring capacity and quality of life in elderly nursing-home residents.
Methods
A total of 114 out of 140 residents of a nursing home in Berlin (Germany) were included in the present study. The residents or their legal custodian respectively were asked to give written informed consent for participation. All questionnaires were administered in face-to-face interviews. Information on diagnosis and medication was taken from medical documentation and cognitive status was rated by the nursing-home staff by clinical judgement.
The study was approved by the ethics committee of the Charité Universitätsmedizin Berlin, Campus Mitte and was conducted according to the guidelines of the declaration of Helsinki.
Nutritional status was assessed with the Mini Nutritional Assessment (MNA). The MNA is a validated nutrition screening and assessment tool to identify geriatric patients who are malnourished or at risk of malnutrition(Reference Vellas, Guigoz and Garry18). It includes questions on general condition, appetite, anthropometry, food preferences and subjective perception of health status. The MNA could be obtained from all participants, since the nursing staff was interviewed about subjects with cognitive impairment or dementia as recommended by Vellas et al. (Reference Vellas, Guigoz and Garry18). A normal nutritional status is indicated with greater or equal to 24 points on a 30-point scale, 17 to 23·5 points imply risk of malnutrition and subjects with less than 17 points are considered malnourished.
Body weight was measured in light clothes with an electronic chair scale (Seca 959; Seca, Hamburg, Germany) or a bed scale (Bolero; Arjo, Gloucester, UK) to the nearest 0·1 kg. To calculate weight loss, weight measurements taken during the preceding 3 months were obtained from medical documentation. Body height was taken with a measuring rod (Seca 220; Seca) to the nearest 0·1 cm. If height could not be elicited this way, it was calculated from knee height according to the formula by Chumlea et al. (Reference Chumlea, Roche and Steinbauch19).
BMI was calculated with the formula: weight (kg)/height (m2).
Mid-upper arm circumference was measured with a non-elastic tape on the non-dominant relaxed arm midway between the tip of the acromion and the olecranon process. In individuals with paralysed or severely handicapped extremities, measures where taken from the healthy extremity. Calf circumference was measured with a non-elastic tape on the thickest part of the undressed calf, with the individual sitting and having their knee flexed at a 90° angle.
The Geriatric Depression Scale (GDS) is a screening instrument to identify patients at risk of depression. The short-form used in the present study consists of fifteen yes/no questions. A score of 0 to 5 points is considered normal, more than 5 points indicates mild depression and more than 10 points indicates severe depression(Reference Sheikh, Yesavage and Brink20). The GDS is suitable for healthy, medically ill and mild to moderately cognitively impaired older adults(Reference O'Riordan, Hayes and O'Neill21).
Functional status was assessed with the Barthel index, which is an instrument to systematically evaluate the self-caring capacity of older adults. The individual's ability to independently perform basic activities of daily living such as eating, body care and mobility is measured(Reference Mahoney and Barthel22).
Quality of life was assessed with the validated Medical Outcomes Study thirty-six-item Short-Form General Health Survey(Reference Ware, Snow and Kosinski23). The questionnaire consists of thirty-six questions assessing quality of life and well-being in eight multi-item scales. The components ‘mental health’, ‘role emotional’ and ‘social functioning’ assess anxiety and the impact of emotional problems on daily life and social contacts. ‘Vitality’ and ‘general health’ display the personal perception of the global health status. ‘Physical functioning’, ‘role physical’ and ‘bodily pain’ measure physical ability and limitations in daily life arising due to decreased functional status and pain.
Statistical analysis was carried out with the software package SPSS (version 15; SPSS Inc., Chicago, IL, USA). All data are shown as mean values and standard deviations unless indicated otherwise. The Mann–Whitney U test was used for comparison between groups due to slightly skewed data and the small sample size. The χ2 test was performed for comparison of nominal variables. Spearman's correlation was calculated to assess the relationship between variables. We performed multiple stepwise regression analysis with the MNA and GDS as dependent variables to identify factors influencing nutritional status and depression. An acceptable level of statistical significance was established a priori at P < 0·05.
Results
The mean age of the study population was 84·6 (sd 9·1) years and three-quarters of the study participants were female (n 86). Residents with high dependency on nursing and care (care level 2 and greater) represented 63·2 % of the study population.
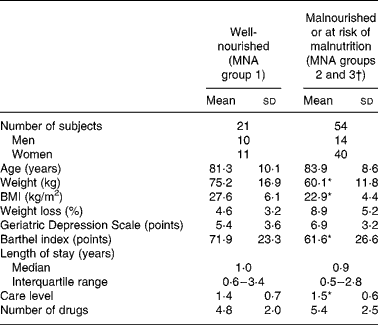
Of the nursing-home residents, twenty-six (22·8 %) were malnourished, sixty-six (57·9 %) were at risk of malnutrition and twenty-two (19·3 %) were well-nourished according to the MNA. Table 1 shows the demographic and nutritional parameters of the study population according to nutritional status.
Table 1 Subject characteristics according to nutritional status (includes only study participants that could be assessed with the Geriatric Depression Scale)
(Mean values and standard deviations)

MNA, Mini Nutritional Assessment.
* Mean value was significantly different from that of the well-nourished group (P < 0·05).
† Groups 2 and 3 were pulled together due to small sample size.
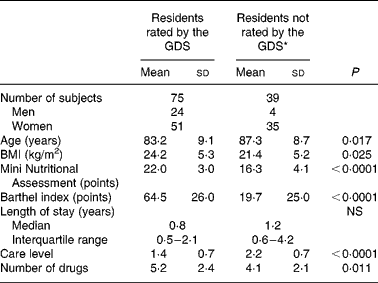
The GDS was administered to seventy-five study participants. A total of twenty-six residents (34·7 %) met criteria for mild depression, whereas sixteen (21·3 %) showed signs of severe depression according to the GDS. Only thirty-three (44 %) scored less than five points and were considered being without depression. GDS scores did not differ between men and women. A comparison of depressive and non-depressive elderly did not reveal significant differences in age, length of stay, care level, BMI, daily number of prescriptions or Barthel index (data not shown). Subjects who could not be assessed with the GDS due to cognitive impairment were older, had a significantly worse nutritional status and a significantly lower Barthel index (see Table 2).
Table 2 Subject characteristics according to evaluation by the Geriatric Depression Scale (GDS)
(Mean values and standard deviations)

* Residents with severe cognitive impairment were excluded from GDS evaluation.
Of the forty-two residents considered to have mild or severe depressive symptoms according to the GDS, only seven had a documented diagnosis of depression in their medical charts. One individual who had been diagnosed depressive in medical documentation had a GDS ≤ 5.
The GDS and MNA correlated significantly (r − 0·313; P = 0·006) but the MNA was not significantly lower in study participants with depressive symptoms (see Fig. 1). In a multiple regression analysis the GDS emerged as the only independent risk factor for malnutrition (R 2 0·089; F = 7·9; P = 0·006), while age, sex, care level, number of prescriptions and Barthel index did not. Vice versa, the MNA was the only risk factor significantly associated with the GDS (R 2 0·089; F = 7·9; P = 0·006) when entered in an analysis with age, sex, care level, number of prescriptions and Barthel index. In subjects with depressive symptoms, loss of appetite tended to occur more often (9 % with GDS < 5 and 26 % with GDS>5; P = 0·059), whereas weight loss was not more prevalent (36 % with GDS < 5 and 28 % with GDS>5; P = 0·478).

Fig. 1 Nutritional status as assessed by the Mini Nutritional Assessment in patients without depressive symptoms and with minor and major depressive symptoms. The box plots indicate the minimum, the maximum and the 25th, 50th and 75th percentiles. There were no significant differences between the three groups.
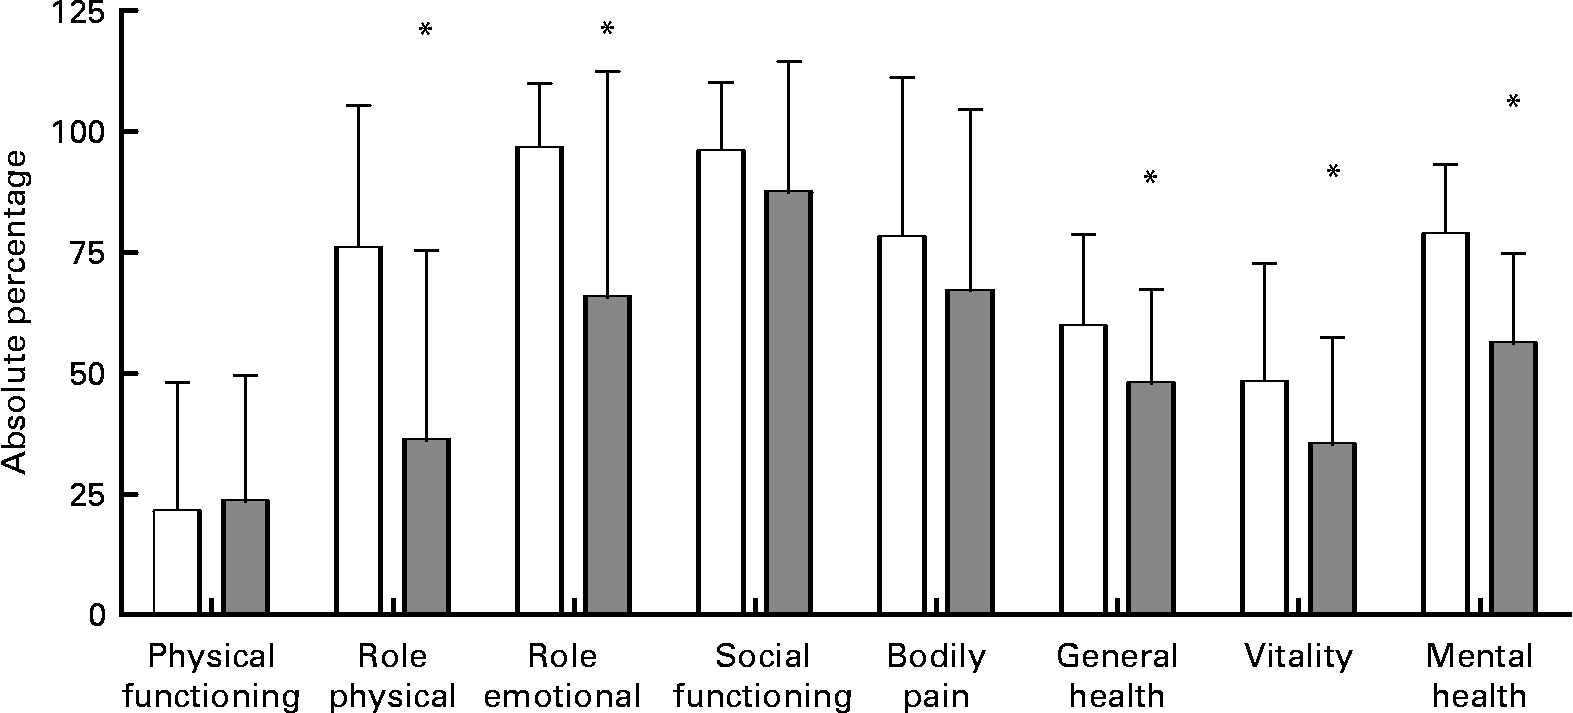
Quality of life was affected in malnourished residents as shown by significantly lower short-form thirty-six question (SF-36) questionnaire scores in ‘general health’ (61·3 (sd 19·4) % in well-nourished and 50·4 (sd 19·6) % in malnourished subjects; P = 0·043) and ‘vitality’ (52·4 (sd 28·7) % in well-nourished and 37·2 (sd 21·1) % in malnourished individuals; P = 0·035). Study participants with a GDS>5 had significantly reduced ‘role physical’, ‘role emotional’, ‘general health’, ‘vitality’ and ‘mental health’ as seen in Fig. 2.

Fig. 2 Nursing-home residents with depressive symptoms (Geriatric Depression Scale>5) (![]() ) had lower values in various components of quality of life when compared with residents without depressive symptoms (□). Values are means, with standard deviations represented by vertical bars. * Mean value was significantly different from that of the group without depressive symptoms: ‘role physical’, P < 0·0001; ‘role emotional’, P = 0·003; ‘general health’, P = 0·022; ‘vitality’, P = 0·032; ‘mental health’, P < 0·0001.
) had lower values in various components of quality of life when compared with residents without depressive symptoms (□). Values are means, with standard deviations represented by vertical bars. * Mean value was significantly different from that of the group without depressive symptoms: ‘role physical’, P < 0·0001; ‘role emotional’, P = 0·003; ‘general health’, P = 0·022; ‘vitality’, P = 0·032; ‘mental health’, P < 0·0001.
Discussion
In the present study, both malnutrition and depressive symptoms were highly prevalent and showed a modest association. While Barthel index and quality of life were reduced in malnourished subjects, Barthel index was not affected in depressed nursing-home residents. However, perception of physical ability and various components of quality of life were impaired in residents with depressive symptoms.
The high number of individuals identified as malnourished and at nutritional risk is in concordance with the literature(Reference Suominen, Muurinen and Routasalo3) as is the number of residents with symptoms of mild or severe depression(Reference Jongenelis, Pot and Eisses8, Reference Teresi, Abrams and Holmes10). Nutritional status was associated with depressive symptoms as seen by a significant correlation between the MNA and GDS. To further clarify this association, we performed a multiple regression analysis that identified the MNA as the only factor significantly influencing the GDS, while age, sex, care level, number of drugs and Barthel index did not. Vice versa, the GDS was the only factor with significant influence on nutritional status. Our findings are supported by studies carried out in elderly hospitalised and community-dwelling elderly. Cabrera et al. found that the risk of developing depression was four times as high in elderly with nutritional deficits as in those without(Reference Cabrera, Mesas and Lopes Garcia17). In a recently published study by German et al. elderly hospitalised patients at risk of malnutrition had significantly higher GDS scores and furthermore, a MNA score below 23·5 points increased the risk for depression by 2(Reference German, Feldblum and Bilenko16).
It remains difficult to establish a clear causal relationship between nutritional status and depression and this in turn might complicate treatment. However, simply treating depression, which might be the initial cause for weight loss, will probably not completely reverse malnutrition in the majority of the elderly. This is true because of the multifactorial nature of impaired nutritional status in older individuals and in addition to their reduced capacity of restoring their nutritional status(Reference Moriguti, Das and Saltzman24). However, a study published in 2003 evaluating depression therapy in elderly out-patients found that serotonin reuptake inhibitors affected the nutritional status of non-demented patients positively as seen by weight gain, improved MNA scores and an increase in serum albumin(Reference Thomas, Hazif-Thomas and Clement25). Further intervention studies are needed to clarify the extent of the influence of depression on nutritional status.
In several studies, depression is found to be particularly high among residents with reduced physical activity or impairment in activities of daily living(Reference Webber, Martin and Harker9, Reference Abrams, Teresi and Butin26). In contrast, in the present study the Barthel index was not affected in subjects with minor or severe depressive symptoms. This has been observed in other studies in institutionalised elderly, but also in elderly out-patients with chronic heart failure(Reference Smalbrugge, Pot and Jongenelis11, Reference Skotzko, Krichten and Zietowski27). One reason for this could be the fact that individuals admitted to a nursing home or suffering from chronic disease are already impaired in their physical function and their performance of activities of daily living and therefore questionnaires rating physical status might not be sensitive enough to detect changes occurring in depression in this special population(Reference Smalbrugge, Pot and Jongenelis11).
Interestingly, the SF-36 component ‘role physical’ was significantly reduced with a GDS>5. This component reflects an individual's perception of how physical health compromises work or other daily activities. It appears that since the Barthel index and the SF-36 component ‘physical functioning’ were not reduced in individuals with depressive symptoms, they might not have been as handicapped in actual function as in their perception thereof. This is supported by a study in severely depressed elderly patients, who rated their functionality as impaired whereas their clinicians did not. The authors concluded that the rating by experienced clinicians was able to distinguish disability contributing to depression from disability resulting from medical illness and/or cognitive impairment(Reference Alexopoulos, Vrontou and Kakuma28). Another study reported that depressed elderly out-patients with chronic heart failure showed a tendency to underestimate their physical ability, whereas they had similar energy expenditure and walking ability as their non-depressive counterparts(Reference Skotzko, Krichten and Zietowski27). As expected, the SF-36 components ‘role emotional’, ‘vitality’ and ‘mental health’ were reduced in depressed residents and, as has been reported in other studies, quality of life was reduced in individuals with impaired nutritional status(Reference Crogan and Pasvogel5).
In the present study only a small number of participants with a GDS>5 had previously been diagnosed with depression in medical documentation. It is known that institutionalised elderly have a three- to four-fold higher probability of falling ill with depression than free-living elderly(Reference Jongenelis, Pot and Eisses8). Yet unrecognised depression and inadequate treatment are common in this population group(Reference Rovner, German and Brant12, Reference Teresi, Abrams and Holmes29). Therefore, depression screening and staff training in depression recognition should be enforced, especially in nursing homes for the elderly(Reference Thakur and Blazer30).
In the present study more than one-third of study participants could not be evaluated with the GDS due to impaired cognitive status. Our data shows that nutritional status, as assessed with BMI and the MNA, was significantly lower in this population. As a prevalence of depression of approximately 20 to 25 % in elderly with dementia is reported in the literature(Reference Payne, Sheppard and Steinberg31) adequate assessment instruments should be employed to explore associations between depression and nutritional status in this vulnerable group(Reference Alexopoulos, Abrams and Young32).
Conclusion
The results of the present observational study indicate a modest association between depressive symptoms and malnutrition. However, the relationship is complex; it remains unclear whether depression in nursing-home residents is the cause or consequence of impaired nutritional status. Longitudinal studies should be conducted in the nursing home to tackle this question and to assess the effect of depression treatment on nutritional and functional status as well as on quality of life.
Acknowledgements
The present study received no specific grant from any funding agency in the public, commercial or not-for-profit sectors.
K. N. and M. P. designed the study; C. S. conducted patient recruitment and data collection; C. S., K. N. and M. P. analysed the data and wrote the manuscript; K.-H. W., W. H. and H. L. critically reviewed and edited the manuscript.
The authors do not have any conflict of interest.


