Hostname: page-component-586b7cd67f-rdxmf Total loading time: 0 Render date: 2024-11-27T19:35:21.615Z Has data issue: false hasContentIssue false

How spanwise travelling transversal surface waves change the near-wall flow

Published online by Cambridge University Press:  23 February 2023

Esther Mäteling*
Affiliation:
Institute of Aerodynamics, RWTH Aachen University, Wüllnerstraße 5a, 52062 Aachen, Germany
Marian Albers
Affiliation:
Institute of Aerodynamics, RWTH Aachen University, Wüllnerstraße 5a, 52062 Aachen, Germany
Wolfgang Schröder
Affiliation:
Institute of Aerodynamics, RWTH Aachen University, Wüllnerstraße 5a, 52062 Aachen, Germany JARA Center for Simulation and Data Science, RWTH Aachen University, Seffenter Weg 23, 52074 Aachen, Germany
*
Email address for correspondence: [email protected]

Abstract

The alteration of the near-wall flow field of a turbulent boundary layer flow subjected to spanwise travelling transversal surface waves at a friction Reynolds number $Re_\tau \approx 1525$ is investigated. The results of a spatial noise-assisted multivariate empirical mode decomposition reveal that this flow control method periodically induces near-wall large-scale bursts while simultaneously lowering the energetic content of small-scale features. The increasing occurrence of intense large-scale ejections in the near-wall region is of particular importance for reducing the wall-shear stress since these ejections balance large-scale sweeps originating from the outer layer. Thus, they corrupt the outer-layer impact on the near-wall dynamics and, consequently, the overall fluctuation intensity at the wall is attenuated. This disturbed top-down momentum exchange is highlighted by an inner–outer interaction analysis, which further reveals an increased bottom-up communication provoked by the large-scale ejections. Moreover, it is shown that the periodic secondary flow field induced by the actuation interferes with the quasi-streamwise vortices in the near-wall region. The velocity gradients of the secondary flow field deform the vortices’ cross-section into an elliptic shape, which yields an unstable vortex state resulting in vortex disintegration. In combination with the effect of the large-scale ejections, the reduced number of quasi-streamwise vortices compared with the undisturbed boundary layer flow results in a decreased wall-normal momentum exchange and the widening and weakening of near-wall streaks. This yields a reduced fluctuation intensity in the near-wall region that lowers the overall wall-shear stress level.

Type
JFM Papers
Copyright
© The Author(s), 2023. Published by Cambridge University Press

1. Introduction

The interest in reducing friction drag via wall-shear stress reduction goes far back into the last century (Vessey Reference Vessey1935; Weske Reference Weske1939; Cornish & Boatwright Reference Cornish and Boatwright1960). The rising awareness of environmental issues substantially increases the necessity to deliver effective drag reduction methods that meet the challenges of sustainability and conservation of resources. For example, the fuel consumption in civil aviation scales almost linearly with the aerodynamic drag at cruise conditions (Ricco, Skote & Leschziner Reference Ricco, Skote and Leschziner2021) and even a small drag reduction can considerably reduce the required resources and the ${\rm CO}_2$ emissions making civil aviation more attractive and more sustainable than today. However, state-of-the-art methods for drag reduction that actively manipulate the flow field are of a rather academic nature and far from being implemented in standard aircraft. One key aspect that impedes the exploration of the full potential of flow control techniques is the incomplete understanding of the complex fluid dynamical processes that naturally occur in turbulent wall-bounded flows. Furthermore, it is still under investigation as to how active drag reduction methods manipulate the internal structure of the flow field to achieve drag reduction. When both aspects are unambiguously revealed, flow control techniques can be tailored precisely to any flow configuration and most efficiently yield the highest drag reduction.

In the present analysis, the flow field response to an active flow control technique is studied. We illustrate how this particular method interacts with the turbulent base flow and which flow structures are actively suppressed or amplified to favourably modulate the near-wall flow field to reduce the wall-shear stress. The findings substantiate the understanding of which flow features are essential for maintaining the naturally occurring turbulent state of the flow. Thus, from a physical perspective, the current study makes an important contribution towards the ambitious goal of determining the mechanism that leads to wall-shear stress reduction.

A recent review by Ricco et al. (Reference Ricco, Skote and Leschziner2021) provides a comprehensive overview about all findings of the last few decades related to active drag reduction methods that accelerate the near-wall fluid in the transverse direction by imposing an unsteady and/or spatially varying cross-flow. The most popular technique utilises streamwise homogeneous, spanwise wall oscillations, which generate an unsteady spanwise shear layer that mimics a Stokes layer. First numerical (Jung, Mangiavacchi & Akhavan Reference Jung, Mangiavacchi and Akhavan1992) and experimental (Laadhari, Skandaji & Morel Reference Laadhari, Skandaji and Morel1994) studies were reported in the early 1990s. Since then, fine-grained optimisation with respect to the non-dimensional inner-scaled actuation parameters typically at friction Reynolds numbers $Re_\tau \lesssim 1000$ showed that the highest drag reduction is achieved for an optimum forcing period of $T^+ \approx 100$ yielding a Stokes layer thickness of around $y^+ \approx 15\unicode{x2013}20$. An increasing actuation amplitude yields higher drag reduction but typically comes at the cost of negative net power savings, i.e. the power spent to actuate the flow field is higher than the energy saving due to drag reduction (Ricco et al. Reference Ricco, Skote and Leschziner2021). Several studies, e.g. Touber & Leschziner (Reference Touber and Leschziner2012) and Agostini & Leschziner (Reference Agostini and Leschziner2014), suggest that the periodically changing Stokes strain is responsible for the modification of the near-wall streaks, which reduces the near-wall turbulence intensity and, thus, the wall-shear stress.

Another form of actuation involves streamwise travelling waves of spanwise wall velocity (Quadrio, Ricco & Viotti Reference Quadrio, Ricco and Viotti2009; Marusic et al. Reference Marusic, Chandran, Rouhi, Fu, Wine, Holloway, Chung and Smits2021; Skote Reference Skote2022). Their efficiency outperforms that of the spanwise wall oscillations at low Reynolds numbers yielding higher drag reduction at maximum values of the order $45\,\%$ and net power savings of around $20\,\%$ (Ricco et al. Reference Ricco, Skote and Leschziner2021). Unfortunately, a decline in efficiency with increasing Reynolds number is observed (Gatti & Quadrio Reference Gatti and Quadrio2013, Reference Gatti and Quadrio2016), although the studied Reynolds numbers are still far from representing realistic real-world scenarios. The explanation for this effect is that the imprint of the outer layer on the near-wall dynamics increases with rising Reynolds number, and thus approaches targeting the outer flow field become more beneficial. In view of this, Marusic et al. (Reference Marusic, Chandran, Rouhi, Fu, Wine, Holloway, Chung and Smits2021) demonstrated experimentally that streamwise travelling spanwise surface oscillations yield a drag reduction of about $13\,\%$ at $Re_\tau \approx 12\,800$ with moderate net power savings. To achieve this, the actuation period was set to $T^+ \approx 600$, and even at $T^+ \approx 1100$ a drag reduction of $8\,\%$ was achieved. Unlike traditional approaches those authors tailored their set-up, particularly the actuation period, to influence the outer-layer large-scale structures instead of the near-wall flow field. This procedure appears to have great potential in closing the current gap between academic drag reduction techniques and application-specific requirements.

However, exploiting its full potential requires in-depth understanding of the physical processes involved in the interaction between near-wall turbulence and the large-scale structures located in the logarithmic region. This inner–outer interaction has already been the subject of many studies (e.g. Marusic & Heuer Reference Marusic and Heuer2007; Hutchins & Marusic Reference Hutchins and Marusic2007; Ganapathisubramani et al. Reference Ganapathisubramani, Hutchins, Monty, Chung and Marusic2012; Agostini & Leschziner Reference Agostini and Leschziner2014; Mäteling, Klaas & Schröder Reference Mäteling, Klaas and Schröder2020). It comprises the phenomena of superposition, bursting events, amplitude modulation and frequency modulation. The superposition, also known as footprinting, refers to large-scale footprints of the outer-layer structures that are found in the inner layer (Hutchins & Marusic Reference Hutchins and Marusic2007). Bursting phenomena comprise sweeps and ejections, which play an important role in the wall-normal momentum exchange. Amplitude and frequency modulation refer to the observation that the amplitude and the frequency of the near-wall small-scale structures are modulated by the corresponding quantities of the outer-layer large scales (Ganapathisubramani et al. Reference Ganapathisubramani, Hutchins, Monty, Chung and Marusic2012). Recently, Mäteling & Schröder (Reference Mäteling and Schröder2022) introduced an approach revealing the time-dependent properties of the spatial inner–outer interactions using a two-dimensional (2-D), noise-assisted multivariate empirical mode decomposition (NA-MEMD) to determine the involved large-scale structures. The 2-D NA-MEMD simultaneously decomposes spatial velocity fields of the inner and the outer layer into physically meaningful modes, which are sorted by the inherent scale size and are continuous in time. Spatial features shared by different velocity components and across varying wall-normal positions can be detected by the 2-D NA-MEMD, which is beneficial for inner–outer interaction analysis.

Only few publications (Agostini & Leschziner Reference Agostini and Leschziner2018, Reference Agostini and Leschziner2021) can be found in which the inner–outer interaction is analysed in drag-reduced flow. In view of its apparent relevance for flow control at high, i.e. application-relevant, Reynolds numbers (Marusic et al. Reference Marusic, Chandran, Rouhi, Fu, Wine, Holloway, Chung and Smits2021), there is a need for more investigations. Agostini & Leschziner (Reference Agostini and Leschziner2018) studied the effect of oscillatory spanwise wall motion with $T^+ \approx 100$ at $Re_\tau \approx 1000$ and attributed the decorrelation between inner and outer layers to the influence of the unsteady transverse Stokes strain in the viscous sublayer. A subsequent study (Agostini & Leschziner Reference Agostini and Leschziner2021) addressed the asymmetric impact of positive and negative large-scale footprints that is also observed in the non-actuated configuration (Agostini & Leschziner Reference Agostini and Leschziner2014). The authors conclude that the amplified near-wall turbulence intensity in the presence of positive large-scale footprints is responsible for the degradation in drag reduction efficiency at increasing Reynolds number.

However, neither of those analyses highlight in detail how the inner–outer interaction varies between the undisturbed reference and the actuated flow field and which physical processes are responsible for the observed reduction in inner–outer coherence in the presence of flow control. These questions are addressed in the present paper based on a comparative analysis between a non-actuated base flow of a turbulent boundary layer (TBL) flow at $Re_\tau \approx 1525$ and the flow-controlled counterpart. In this study, the flow is subjected to spanwise travelling transversal surface waves. That is, a sinusoidal wall deformation is introduced which periodically travels in the spanwise direction. Turbulent boundary layer flows subjected to these kinds of surface waves have been investigated both experimentally (Tamano & Itoh Reference Tamano and Itoh2012; Li et al. Reference Li, Roggenkamp, Hecken, Jessen, Klaas and Schröder2018, Reference Li, Roggenkamp, Paakkari, Klaas, Soria and Schroeder2020) and numerically (Koh et al. Reference Koh, Meysonnat, Statnikov, Meinke and Schröder2015; Albers et al. Reference Albers, Meysonnat, Fernex, Semaan, Noack and Schröder2020; Fernex et al. Reference Fernex, Semaan, Albers, Meysonnat, Schröder and Noack2020). The general trends indicate that a reduction of the integrated wall-shear stress is achieved for larger wavelengths and amplitudes. In an extensive parameter study, Albers et al. (Reference Albers, Meysonnat, Fernex, Semaan, Noack and Schröder2020) determined an optimum actuation period of around $T^+ \approx 50$ yielding a maximum drag reduction of $26\,\%$ for a friction Reynolds number $Re_\tau = 360$. The actuation wavelength was set to $\lambda ^+ \approx 3000$ and the actuation amplitude to $A^+ \approx 78$. Further adjustments published in Fernex et al. (Reference Fernex, Semaan, Albers, Meysonnat, Schröder and Noack2020) yield an even higher drag reduction of $31\,\%$ for $\lambda ^+ \approx 5000$, $A^+ \approx 92$, $T^+ \approx 44$. In the present investigation, a much higher Reynolds number $Re_\tau \approx 1525$ is studied using the mentioned actuation parameters from the former study (Albers et al. Reference Albers, Meysonnat, Fernex, Semaan, Noack and Schröder2020) with a small adjustment of the actuation amplitude.

The overall objective of the current study is to understand the mechanism behind the altered near-wall flow field induced by spanwise travelling transversal surface waves. A data-driven analysis is presented that reveals how the surface actuation interferes with the turbulent base flow to reduce the wall-shear stress. The paper is organised as follows. In § 2, the computational set-up is briefly outlined. Section 3 gives an overview of the applied methods, i.e. the 2-D NA-MEMD (§ 3.1), the inner–outer interaction analysis (§ 3.2) and the vortex detection method (§ 3.3). This is the basis for the results presented in § 4. The basic properties of the actuated flow field are described in § 4.1. Section 4.2 shows how the application of the 2-D NA-MEMD yields first insights into the underlying flow structure modification induced by the actuation method. The findings are supported by the results of the inner–outer interaction analysis outlined in § 4.3, which highlights substantial differences of the interactions occurring in the undisturbed and the actuated TBL flow. The last cornerstone to understand the mechanism of wall-shear stress reduction is presented in § 4.4. It demonstrates how the secondary flow field, which is generated by the wavy wall oscillations, interferes with the quasi-streamwise vortices (QSVs) in the near-wall region. All the findings are summarised in § 4.5 to propose a hypothesis that explains how spanwise travelling transversal surface waves change the near-wall flow field to lower the wall-shear stress. Final conclusions are drawn in § 5.

2. Computational set-up

The non-actuated reference flat-plate TBL and the actuated TBL flows are simulated by direct numerical simulations using the in-house flow solver m-AIA (multiphysics Aerodynamisches Institut Aachen). The compressible Navier–Stokes equations are solved on structured curvilinear meshes with a second-order-accurate numerical method. A more detailed description can be found in Albers et al. (Reference Albers, Meysonnat, Fernex, Semaan, Noack and Schröder2020). A schematic of the computational set-up of the actuated configuration is depicted in figure 1. The domain size is $L_x \times L_y \times L_z = 603\delta _2 \times 101\delta _2 \times 15.8\delta _2$, where $\delta _2$ is the momentum thickness at the reference position $x_1$, which is located at $x/\delta _2 = 100$. The quantities $(x,y,z)$ denote the streamwise, wall-normal and spanwise coordinate directions. Using inner units based on the non-actuated reference flow at $x_1$, i.e. a normalisation by the friction velocity $u_\tau$ and the kinematic viscosity $\nu$, the domain size equals $L_x^+ \times L_y^+ \times L_z^+ = 110\,330 \times 18\,480 \times 2890$. If not stated otherwise, inner scaling is always conducted with the quantities of the reference flow at $x_1$.

Figure 1. Schematic of the physical domain of the actuated TBL flow (STG, synthetic turbulence generation).

The simulation is conducted at a Mach number $M = 0.2$. The friction Reynolds number is $Re_\tau \approx 1525$ and the momentum thickness-based Reynolds number is $Re_{\delta _2} \approx 5128$ determined by the quantities at $x_1$.

At the inflow boundary a synthetic turbulence generation method (Roidl, Meinke & Schröder Reference Roidl, Meinke and Schröder2013) is used to yield the TBL flow, which, downstream of the transition region, possesses the characteristics of flat-plate TBL flow. For example, the Reynolds-number-dependent distribution of the skin-friction coefficient is within a $5\,\%$ margin relative to the empirical Coles–Fernholz relation (Nagib, Chauhan & Monkewitz Reference Nagib, Chauhan and Monkewitz2007). The wave motion of the actuated surface is introduced at $x_0$, which is located approximately 46 840 inner units downstream of the inflow boundary and defines the location $x = 0$. The wave is described by a space- and time-dependent function:

(2.1)\begin{equation} y^+|_{wall}(z^+,t^+) = A^+\cos\left(\frac{2{\rm \pi}}{\lambda^+} z^+{+} \frac{2{\rm \pi}}{T^+}t^+\right). \end{equation}

Within the actuated region, which covers the streamwise extent $0 \leqslant x/\delta _2 \leqslant 150$, the actuation parameters are defined by the amplitude $A^+ \approx 100$, the wavelength $\lambda ^+ \approx 3000$ and the period $T^+ \approx 50$. The grid resolution is $\Delta x^+ \approx 12$ in the streamwise direction and $\Delta z^+ \approx 8$ in the spanwise direction. A varying spacing in the wall-normal direction is chosen with $\Delta y^+ < 1$ at the surface and gradual coarsening for increasing wall distance. The origin of the wall-normal coordinate is located on the moving surface, i.e. it varies in the spanwise direction and in time. The set-up is similar to that used in Albers et al. (Reference Albers, Meysonnat, Fernex, Semaan, Noack and Schröder2020); however, a significantly higher Reynolds number is simulated in the present study.

The non-actuated reference configuration reaches a fully developed state at a simulation time of about $t^+ \approx 12\,360$. The state at $t^+ \approx 13\,200$ is used to initialise the actuated configuration, which reaches its developed state at approximately $t^+ \approx 16\,330$. Afterwards, averaged flow quantities are obtained over a time span $\Delta t^+ \approx 6740$ and the newly set instant of time $t^+ = 0$, which is referred to in the following, denotes the subsequent starting time of the analysis of the instantaneous quantities. When three-dimensional volumetric data are analysed, e.g. in the context of the QSV analysis in § 4.4, a volume of size $L_x^+ \times L_y^+ \times L_z^+ \approx 1800 \times 1000 \times 3000$ is selected. These boxes are separated by a temporal distance of $\Delta t^+ \approx 0.27$. For the scale-based analysis (§ 4.2) and the inner–outer interaction analysis (§ 4.3), wall-parallel planes $L_x^+ \times L_z^+ \approx 6000 \times 3000$ with a temporal displacement of $\Delta t^+ \approx 3.21$ are considered. They are extracted at three near-wall locations $y_{NW}^+ = 1,5,15$ and at a single outer-layer position $y_{OL}^+ = 155$. According to the formula $y^+ = 3.9\sqrt {Re_\tau } \approx 155$ introduced by Marusic, Mathis & Hutchins (Reference Marusic, Mathis and Hutchins2010), the large scales are most energetic in this outer-layer location.

As described in Albers et al. (Reference Albers, Meysonnat, Fernex, Semaan, Noack and Schröder2020) and following the work by Hussain & Reynolds (Reference Hussain and Reynolds1970) and Tomiyama & Fukagata (Reference Tomiyama and Fukagata2013), a triple decomposition is applied to the velocity data of the actuated configuration to separate the mean flow, the periodic fluctuations and the stochastic fluctuations. The periodic fluctuations are caused by the travelling wave motion and represent a secondary flow field that is superimposed onto the stochastic fluctuations $u',v',w'$ of the turbulent base flow. The periodic quantities of the secondary flow field are denoted by $\widetilde {(\cdot )}$. They are relevant for the investigation of the interference of the actuation technique with the base flow (§ 4.4). When temporal and/or spatial averages are used, an overline $\overline {(\cdot )}$ is added to the respective quantity.

3. Methodical approach

The key methods to analyse the direct numerical simulation data are outlined in the following. In § 3.1, a high-level overview of the data decomposition method is given. The inner–outer interaction analysis approach is outlined in § 3.2 and the method for vortex identification is introduced in § 3.3.

3.1. Scale-based flow field decomposition

The time-resolved spatial velocity fields are decomposed into scale-based modal representations by an extended version of the 2-D EMD (Mäteling & Schröder Reference Mäteling and Schröder2022). Unlike classical Fourier filtering, the EMD is able to process nonlinear and unsteady data, which are both essential characteristics of turbulent flows. Exploiting these characteristics by using an appropriate data analysis tool is a fundamental prerequisite to obtain physically meaningful representations of the flow data which enhances our understanding of the flow physics. Due to the EMD's data-driven nature, the resulting intrinsic mode functions (IMFs) are adaptively biased towards locally dominant features in the flow field. Thus, the separation into different modes can be interpreted as a scale-based segmentation of physically connected features rather than a rigorous separation between wavelengths. This is a fundamental benefit of the EMD compared to spectral filtering because the latter requires a predefinition of constant cutoff values, which potentially inhibits a physical significance of the resulting data fractions.

In the present analysis, a 2-D NA-MEMD is applied to the velocity fields (Mäteling & Schröder Reference Mäteling and Schröder2022). In general, the multivariate data can be composed of different fluid-dynamical quantities such as velocity, pressure or density fields. In the present study, the streamwise $u'(x^+,z^+)$ and the wall-normal $v'(x^+,z^+)$ velocity fluctuations in the near-wall region and the outer layer at a single time instant are used. In this context, multivariate refers to multicomponent data, which are simultaneously decomposed to ensure that physical relations within the original data are preserved in the modal representations. In other words, common spatial features of the considered velocity fields are classified into equal-indexed IMFs such that similarities are easily detectable by comparing the respective modes.

The concept of noise assistance incorporates the usage of random Gaussian noise within the decomposition. This is advantageous because the decomposition of Gaussian noise by an EMD produces normally distributed IMFs with doubled centre wavelengths of neighbouring modes. This characteristic is imposed onto the IMFs of the flow data when simultaneously decomposing flow and noise data. Thus, the noise data provide a basic framework for the mode classification while the content of the modes is still determined by the flow data themselves. This approach reduces the mode-mixing phenomenon, which means that a distinct separation between neighbouring modes is obtained with a moderate overlap of shared wavelengths. To a certain degree, this overlap is beneficial for fluid-dynamical applications since it allows physically meaningful growth processes of the flow features captured by a single mode and avoids that the respective structures switching back and forth between neighbouring modes.

Besides improving the mode alignment in the spatial domain, the noise assistance also enhances the mode alignment in the temporal domain. This latter effect can likewise be traced back to the basic framework imposed by the noise data. It equally regulates that same-indexed IMFs of different time steps, i.e. of unrelated decompositions, contain a similar range of scales. This is important because in the present application, the 2-D NA-MEMD is solely deployed in the spatial domain and does not obtain any temporal information. However, since a temporal coherence is a key indicator of the physics of the resulting modes, further attention has been devoted to optimise this characteristic. Therefore, the stopping criterion, which is an essential quantity within the mode classification process, is adapted such that a fixed number of sifting operations is prescribed for the calculation of each individual IMF. This allows a rather straightforward and greater control of the sifting process and balances the energetic content of the modes. The respective amount of siftings is certainly validated against the original stopping criterion to ensure that the desired IMF characteristics are not violated.

The details of the 2-D NA-MEMD algorithm are outlined in Mäteling & Schröder (Reference Mäteling and Schröder2022). In the following, only the necessary application-specific information is provided without repeating the algorithmic basics. The 2-D NA-MEMD is applied to a six-component data matrix. This matrix comprises four 2-D velocity fluctuation fields, namely $u'_{NW}$, $v'_{NW}$, $u'_{OL}$, $v'_{OL} = f(x^+,z^+)$, and two spatial fields of random Gaussian noise. It is important to note that within the scope of noise assistance, the noise is not added directly to the data of interest, i.e. the original data are not perturbed. Instead, noise distributions with the same spatial size as the flow fields, i.e. $L_x^+ \times L_z^+ \approx 6000 \times 3000$, are appended to the multicomponent flow data. Here, the mean of the noise is set to zero and the variance measures $2\,\%$ of the variance of the flow data. The multivariate approach utilises real-valued surface projections within the sifting process and, in total, $22$ projection directions are employed. Four sifting operations are prescribed to extract the first and the fourth IMFs and three sifts to calculate the second and third IMFs. After determining these four modes, the decomposition is stopped and the remaining residual defines the large-scale velocity components (subscript ‘$LS$’). All these application-related parameter choices are similar to the analysis of turbulent channel flow data (Mäteling & Schröder Reference Mäteling and Schröder2022), where the individual influences have been studied in great detail. For the present data, cross-validation has been performed revealing similar findings.

In total, three datasets are decomposed, which only differ by the wall-normal distance of the near-wall flow data ($y^+_{NW} = 1,5,15$) and the noise data, which are renewed for each individual decomposition. The outer-layer location is kept constant at $y^+_{OL} = 155$ since the large-scale motions are most energetic in this layer, which provides the most significant results of the inner–outer interaction analysis. For each set, $400$ time steps with a temporal displacement of $\Delta t^+ \approx 3.21$ are processed in a parallelised manner. The resulting large-scale IMFs are used for the inner–outer interaction analysis described in §§ 3.2 and 4.3 and the scale-based analysis in § 4.2.

3.2. Inner–outer interaction analysis

A spatio-temporal approach is used to study the inner–outer interaction regarding the superposition, the effect of sweeps and ejections and the amplitude modulation. This section summarises the key aspects of the method, the details of which are described in Mäteling & Schröder (Reference Mäteling and Schröder2022), where the approach is introduced for turbulent channel flow data.

The interaction analysis is based on large-scale velocity fluctuations, which are obtained by applying a 2-D NA-MEMD to the streamwise and wall-normal fluctuations of the inner and the outer layers as described in § 3.1. As shown in Mäteling & Schröder (Reference Mäteling and Schröder2022), this preprocessing technique greatly enhances the accuracy of the interaction analysis compared to a scale separation by the classical EMD due to the beneficial characteristics of the noise-assisted multivariate approach highlighted in § 3.1. Like the data decomposition, the interaction analysis is solely conducted in the spatial domain to allow an analysis of time-varying properties.

To study the superposition phenomenon, which is denoted by the subscript ‘$S$’, the streamwise large-scale velocity components are correlated via

(3.1)\begin{align} &R_{S}(\Delta x^{+}, \Delta z^{+})\nonumber\\ &\quad = \frac{\sum_{x^+} \sum_{z^+} (u'_{NW,LS}(x^{+},z^{+})\ {\cdot}\ u'^{{\star}}_{OL,LS}(x^{+} + \Delta x^{+}, z^{+} + \Delta z^{+}))}{\sqrt{\sum_{x^+} \sum_{z^+} |u{'}_{NW,LS}(x^{+},z^{+})|^2}\ {\cdot}\ \sqrt{ \sum_{x^+} \sum_{z^+} |u{'}_{OL,LS}(x^{+} + \Delta x^{+}, z^{+} + \Delta z^{+})|^2}}. \end{align}

The star symbol denotes complex conjugation and the vertical lines indicate absolute values. The maximum correlation coefficient $R_{S,max}$ indicates the strength of inner–outer coherence and is stored for each time step. The spatial offset between the inner and outer layers is denoted by the inclination angle

(3.2)\begin{equation} \varTheta_{S} = {\rm sgn}(\Delta x^{+}_{S}) \tan^{{-}1} \left(\frac{y^{+}_{OL} - y^+_{NW}}{\sqrt{(\Delta x^{+}_{S})^{2} + (\Delta z^{+}_{S})^{2}}} \right), \end{equation}

where the spatial shift $(\Delta x^{+}_{S}, \Delta z^{+}_{S})$ relates to the position of $R_{S,max}$.

The bursting events are analysed using quadrant analysis to inspect the specific dynamics of the superposition phenomenon in greater detail. Large-scale sweeps (subscript ‘$sw$’) can be identified at locations where $\{u_{LS}^\prime > 0,v_{LS}^\prime < 0\}$ and a complex velocity related to these events is defined by $u'_{LS,sw} + i v'_{LS,sw}$. It is zero at locations where no sweeps are detected. Likewise, ejections (subscript ‘$ej$’) occur for the condition $\{u_{LS}^\prime < 0, v_{LS}^\prime > 0\}$ yielding the complex velocity $u'_{LS,ej} + i v'_{LS,ej}$. The correlation of inner–outer bursting activity is performed similar to the superposition phenomenon by replacing $u'_{NW,LS},u'_{OL,LS}$ in (3.1) with the complex velocities related to the sweeps and the ejections. The resulting maximum correlation coefficients $R_{sw,max},R_{ej,max}$ reveal to what degree outer–layer sweeps are able to reach the near-wall region and vice versa for the ejections. Note that Q1 ($\{u_{LS}^\prime > 0,v_{LS}^\prime > 0\}$) and Q3 ($\{u_{LS}^\prime < 0,v_{LS}^\prime < 0\}$) events do not contribute considerably to the inner–outer interaction and are consequently not considered.

Prior to investigating the amplitude modulation, the identified footprint of the outer-layer large scales is removed from the near-wall fluctuations by

(3.3)\begin{equation} u'_{NW,woSB}(x^{+}, z^{+}) = u'_{NW}(x^{+}, z^{+}) - R_{S,max} u'_{OL,LS} (x^{+}, z^{+}, \varTheta_{S})\ {\cdot}\ \frac{rms(u'_{NW,LS})}{rms(u'_{OL,LS})} \end{equation}

since this approach yields an enhanced representation of the amplitude modulation effect (Mäteling et al. Reference Mäteling, Klaas and Schröder2020; Mäteling & Schröder Reference Mäteling and Schröder2022). As indicated by (3.3), $u'_{OL,LS}$ is shifted with respect to the inclination angle $\varTheta _S$ such that the correlating features of the near-wall and the outer-layer data are virtually overlayed. Furthermore, the shifted signal is scaled by the maximum correlation coefficient $R_{S,max}$ to consider the intensity of footprinting and by the ratio $rms(u'_{NW,LS})/rms(u'_{OL,LS})$, which compensates for magnitude differences between the large scales of both layers.

Subsequently, a second 2-D NA-MEMD is performed to update the near-wall large-scale data. The decomposition involves the new near-wall streamwise data $u'_{NW,woSB}$, i.e. the outcome of (3.3), the outer-layer streamwise fluctuations $u'_{OL}$ and two noise channels with an updated noise variance. The wall-normal velocity components are not considered since they are irrelevant for the amplitude modulation analysis and their exclusion saves computational costs.

Based on the updated large-scale components $u^\prime _{NW,LS2},u^\prime _{OL,LS2}$ of the second decomposition, the large-scale amplitudes $\hat {u}^\prime _{NW,LS2},\hat {u}^\prime _{OL,LS2}$ are calculated using first- and second-order Hilbert transforms. They are correlated by replacing $u'_{NW,LS},u'_{OL,LS}$ in (3.1) with the respective amplitude values yielding the degree of amplitude modulation $R_{AM,max}$.

The frequency modulation is not studied in the present analysis since this highly nonlinear type of modulation requires the development of an advanced, robust approach, which is beyond the scope of this paper. However, we point out that the characteristics of the IMFs fulfil the requirements to obtain meaningful instantaneous frequencies, which builds a promising foundation for studying frequency modulation.

It has to be emphasised that the complete approach is performed in the spatial domain without using any temporal information, i.e. the inner–outer interaction analysis is conducted individually for each time instant. Thus, a discrete time-dependent evolution of the inner–outer interaction can be studied, which reveals important details about the instantaneous and local behaviour of the involved physical phenomena.

3.3. Vortex identification

The detailed analysis of the near-wall flow structure modification by the applied actuation method described in § 4.4 requires a reliable approach to detect and track the respective vortices. The swirling strength $\varOmega$, which describes the strength of any swirling motion by the imaginary part of the complex eigenvalues of the local velocity gradient tensor, was proven to be such an effective vortex identification tool (Zhou et al. Reference Zhou, Adrian, Balachandar and Kendall1999; Adrian, Christensen & Liu Reference Adrian, Christensen and Liu2000). In contrast to, for example, vorticity, it excludes irrotational regions of shear. The sense of rotation is not revealed by the swirling strength but the sign of the vorticity can be used to define it (Tomkins & Adrian Reference Tomkins and Adrian2003). Since the present study focuses on the QSVs, the streamwise component of the swirling strength is used. More precisely, the velocity gradient tensor

(3.4)\begin{equation} V = \left( \begin{array}{cc} \displaystyle \dfrac{\partial v^{\prime +}}{\partial y^+} & \displaystyle \dfrac{\partial w^{\prime +}}{\partial y^+} \\ \displaystyle \dfrac{\partial v^{\prime +}}{\partial z^+} & \displaystyle \dfrac{\partial w^{\prime +}}{\partial z^+} \end{array} \right) \end{equation}

is calculated using central differences and the imaginary part of its eigenvalues denotes the presence of swirling motion oriented in the streamwise direction. Since this calculation is performed for time-resolved volumetric data within the test section, the temporal evolution of QSVs can precisely be studied. To remove background noise and enable a distinct vortex detection, a threshold value of the streamwise swirling strength $\varOmega ^2_{x}=0.01$ is applied. It was shown by Zhou et al. (Reference Zhou, Adrian, Balachandar and Kendall1999) that the general topology of the vortical structures is unaffected by the magnitude of the chosen threshold value but, certainly, the structures decrease in size with increasing threshold value. Note that connected areas smaller than 10 data points are neglected since they barely resemble a clear vortex.

4. Results

To assess the basic properties of the actuated flow field, § 4.1 provides a brief overview of the variation of the friction drag coefficient and the altered Reynolds stresses compared with the undisturbed TBL flow. Section 4.2 shows how the flow field decomposition by the 2-D NA-MEMD gives first insights into the internal flow structure modifications induced by the actuation method. The findings are supported by the results of the inner–outer interaction analysis outlined in § 4.3. An additional contribution to a complete understanding of the near-wall flow alteration is presented in § 4.4. It highlights the interference of the secondary flow field generated by the periodic surface movement with the QSVs. Based on these findings, § 4.5 proposes a hypothesis with respect to the wall-shear stress reduction mechanism provoked by spanwise travelling transversal surface waves.

4.1. Properties of the actuated flow

The wavy surface deformation of the flow control technique introduces a change in area of the moving wall compared with the flat-plate reference flow, which depends on the amplitude and the wavelength of the sinusoidal wave. Since the friction drag is defined by the product of the wall-shear stress and the surface, this variation of the wetted surface has to be taken into account to determine the drag-altering effect of the actuation. The drag variation is defined by

(4.1)\begin{equation} \Delta c_d = \frac{c_{d,x,REF} - c_{d,x,ACT}}{c_{d,x,REF}} \times 100 \quad \mbox{with} \ c_{d,x} = \frac{2F_x}{\rho_\infty u_\infty^2 A_{R}}, \end{equation}

i.e. a positive $\Delta c_d$ indicates a reduced wall-shear stress. The quantity $c_{d,x}$ denotes the drag coefficient in the streamwise direction, $A_R$ a reference surface and $F_x$ the streamwise component of the force vector, which is computed by integrating pressure and friction forces over a fixed surface in the test section as described in Albers et al. (Reference Albers, Meysonnat, Fernex, Semaan, Noack and Schröder2020). The reference data are denoted by the subscript ‘$REF$’ and the actuated quantities by ‘$ACT$’. It goes without saying that this type of surface actuation induces a convective flow in the spanwise direction. For the investigated configuration, the spanwise force measures approximately $16\,\%$ of the streamwise force. Considering the spanwise component of the drag coefficient in the calculation of the drag reduction, i.e. substituting the streamwise drag coefficient in (4.1) by the magnitude of the vectorial drag coefficient, the present configuration yields $\Delta c_d = 25.5\,\%$. However, for a direct comparison with earlier studies and other drag-reduction techniques that do not introduce a spanwise flow, we use the traditional definition of the drag reduction solely based on the streamwise drag coefficient (4.1) in the following. This definition results in an averaged value of $\Delta c_d \approx 26.5\,\%$.

Overall, negative net power savings are obtained. Nevertheless, this does not impair the main objective of the present analysis, which is to illuminate the physical mechanisms responsible for the changes of the near-wall flow that result in a reduced wall-shear stress. The high $\Delta c_d$ achieved by the current configuration substantially amplifies the flow field modifications induced by the actuation technique, and thereby allows a detailed study of the interaction of the surface actuation with the turbulent flow features.

The streamwise evolution of the friction drag of the actuated configuration is shown in figure 2. When the surface actuation sets in at $x_0$, $\Delta c_d$ rapidly increases with a small overshoot followed by an approximately constant value. This stable state is present at around $50 \lesssim x/\delta _2 \lesssim 100$ yielding an averaged value of $\Delta c_d \approx 26.5\,\%$. The flow data investigated in the present study are taken from this region. Starting at $x/\delta _2 \approx 130$, the surface deformation is progressively reduced, which yields a short-term increase of $\Delta c_d$ followed by a rapid degradation.

Figure 2. Streamwise evolution of the friction drag.

Figure 3 shows the components of the Reynolds stress tensor as a function of the wall-normal distance $y^+$ for the non-actuated reference and the actuated flow. A substantial, absolute reduction of all components can be observed for the actuated case, which, depending on the considered component, levels off in the logarithmic layer and the wake region. These effects are comparable with the flow field modification reported at $Re_\tau \approx 360$ (Albers et al. Reference Albers, Meysonnat, Fernex, Semaan, Noack and Schröder2020).

Figure 3. Wall-normal distributions of the symmetric and shear-stress components of the Reynolds stress tensor for the non-actuated reference (REF) and the actuated flow (ACT).

4.2. Flow field decomposition

Joint probability density distributions (j.p.d.f.s) of the streamwise and wall-normal velocity fluctuations are often analysed to assess the behaviour of turbulent flows. Within the scope of drag reduction techniques, these distributions have revealed an overall attenuation of the fluctuation intensity in the near-wall region, i.e. a damping of sweeps and ejections (Touber & Leschziner Reference Touber and Leschziner2012; Albers et al. Reference Albers, Meysonnat, Fernex, Semaan, Noack and Schröder2020; Ricco et al. Reference Ricco, Skote and Leschziner2021). However, we show in the following analysis that the application of the 2-D NA-MEMD to the velocity fluctuations provides a fundamentally new perspective on the alteration of bursting activity in the inner layer.

Figure 4 shows the j.p.d.f.s of the total velocity fluctuations $u^{\prime +}_{NW},v^{\prime +}_{NW}$ and the large-scale velocity fluctuations $u^{\prime +}_{NW,LS},v^{\prime +}_{NW,LS}$ obtained by the 2-D NA-MEMD at three near-wall locations: $y^+_{NW} = 1,5,15$. In line with former literature (Albers et al. Reference Albers, Meysonnat, Fernex, Semaan, Noack and Schröder2020; Ricco et al. Reference Ricco, Skote and Leschziner2021), the present actuation method greatly reduces the absolute streamwise velocity fluctuations in the near-wall region $|u^{\prime +}_{NW}|$ and, thereby, the probability of bursting events (figure 4a,c,e). Note that very close to the wall (figure 4a), the wall-normal fluctuations are substantially increased. This effect levels off quite rapidly and can hardly be observed at $y^+_{NW}=5$ (figure 4c). However, the reduction of the streamwise fluctuation intensity is still obvious at $y^+_{NW}=15$ (figure 4e).

Figure 4. Joint probability density distributions of the total velocity fluctuations $u^{\prime +}_{NW},v^{\prime +}_{NW}$ (a,c,e) and the large-scale velocity fluctuations $u^{\prime +}_{NW,LS},v^{\prime +}_{NW,LS}$ (b,d,f) at three near-wall locations (a,b$y^+_{NW} = 1$, (c,d$y^+_{NW} = 5$ and (e,f$y^+_{NW} = 15$ for the non-actuated reference (REF) and the actuated flow (ACT).

New insight is gained by inspecting the j.p.d.f.s of the large-scale velocity fluctuations determined by the 2-D NA-MEMD given in figure 4(b,d,f). Unlike the j.p.d.f.s of the total fluctuations, these distributions reveal an increased probability of near-wall large-scale sweeps (Q4) and ejections (Q2) in the actuated flow. This is primarily induced by a substantial increase of the wall-normal large-scale fluctuations $|v^{\prime +}_{NW,LS}|$ because – similar to the total streamwise fluctuations – also their large-scale counterpart is decreased compared with the reference flow. A higher probability means that large-scale sweeps and ejections appear more frequently compared with the reference flow. Since the j.p.d.f.s related to the actuated flow also spread wider into Q2 and Q4, a substantial portion of the emerging sweeps and ejections is more intense than in the reference flow.

It is emphasised in figure 4(b) that the amount and intensity of large-scale sweeps and ejections in the actuated flow are balanced at $y^+_{NW} =1$. This is indicated by the roughly circular shape of the j.p.d.f. and the location of its origin near $(0,0)$. On the contrary, the j.p.d.f. of the reference flow is primarily located in Q3 and Q4 and, thus, this flow barely contains any large-scale ejections at $y^+_{NW} =1$. Consequently, the overall effect of the observed flow field alteration is more significant with respect to the large-scale ejections.

At $y^+_{NW} =5$ (figure 4d) and $y^+_{NW} =15$ (figure 4f), the origin of the j.p.d.f.s of the actuated configuration is slightly shifted into Q4. However, the probability of strong ejections is still much higher compared with the reference flow. Overall, a decreasing influence of the actuation is observed for increasing wall distance.

The j.p.d.f.s of the total and the large-scale velocity fluctuations at the outer-layer position $y^+_{OL} = 155$ are given in figure 5. The distributions show that the impact of the actuation on the outer-layer flow is very small and similar for total and large-scale data.

Figure 5. Joint probability density distributions of (a) total and (b) large-scale velocity fluctuations at the outer-layer position $y^+_{OL}=155$ for the non-actuated reference (REF) and the actuated flow (ACT).

In brief, the j.p.d.f.s of the total and the large-scale velocity fluctuations show an opposite trend. While the j.p.d.f.s of the total fluctuations point at an overall attenuation of the intensity and the prevalence of sweeps and ejections in the near-wall region, the distributions of the large-scale fluctuations indicate that large-scale sweeps and ejections are stronger and appear more frequently in the actuated flow. We can conclude that the actuation actively promotes large-scale bursting events close to the wall while the small-scale activity is strongly attenuated such that the overall trend indicates a damping of sweeps and ejections. Consequently, without a proper scale decomposition, this essential feature of the wall-shear stress reduction mechanism could not have been revealed. This result is fundamental to understand the observed flow field modifications highlighted by the inner–outer interaction analysis, which is given in the following section.

4.3. Inner–outer interaction analysis

The application of the 2-D NA-MEMD to wall-parallel streamwise and wall-normal velocity fluctuation fields yields the respective large-scale velocity fields for each time step. Exemplary large scales at $y^+_{NW} =1$ and $y^+_{OL} =155$ are pictured in figure 6 for the non-actuated reference flow and in figure 7 for the actuated flow. Contours of the large-scale bursts are given by solid lines for the sweeps and dashed lines for the ejections. In both flow configurations, the impact of the outer-layer large scales is distinctly visible in the near-wall data since the positions of the large-scale high-speed and low-speed structures are quite similar. Certainly, the footprints are occasionally disturbed and do not reflect the outer-layer flow structures completely. A quantification of the degree of inner–outer coherence is given later in this section by the respective correlation coefficients.

Figure 6. Large-scale streamwise and wall-normal velocity fluctuations (a$u^{\prime +}_{OL,LS}$, (b$v^{\prime +}_{OL,LS}$, (c$u^{\prime +}_{NW,LS}$ and (d$v^{\prime +}_{NW,LS}$ at $y^+_{NW} =1, y^+_{OL} =155$ and $t^+ = 1$ for the reference flow. Solid lines indicate large-scale sweeps and dashed lines large-scale ejections.

Figure 7. Large-scale streamwise and wall-normal velocity fluctuations (a$u^{\prime +}_{OL,LS}$, (b$v^{\prime +}_{OL,LS}$, (c$u^{\prime +}_{NW,LS}$ and (d$v^{\prime +}_{NW,LS}$ at $y^+_{NW} =1, y^+_{OL} =155$ and $t^+ = 1$ for the actuated flow. Solid lines indicate large-scale sweeps and dashed lines large-scale ejections.

To assess the large-scale flow fields more deeply, a movie in the supplementary material available at https://doi.org/10.1017/jfm.2023.54 shows a time series of the large-scale streamwise components at $y^+_{NW} =1$ and $y^+_{OL} =155$ for the non-actuated reference and the actuated flow. The near-wall large-scale streamwise velocity fluctuations are clearly reduced by the actuation, which was already observed in the j.p.d.f.s in figure 4. The strength of the outer-layer large scales is similar for both flows and in combination with figure 5 it can be conjectured that the actuation does not directly impact the topology of the energetic outer-layer structures. The supplementary movie also reveals that the near-wall and the outer-layer flow structures of the reference flow are much better aligned than in the actuated flow. That is, the near-wall reference large scales continuously show the impact of the outer-layer flow. For the actuated flow, however, the near-wall large scales are rather discontinuous in time and, thus, less coherent with the continuous, outer-layer flow.

This difference between both flow configurations is also apparent in the correlation coefficients, which are determined using the approach outlined in § 3.2. The time-averaged quantities are given in table 1 for the interaction of the outer layer with all three near-wall locations. The temporal evolution of these coefficients is analysed later in this section once a high-level overview of the general trends has been given. Note that for clarity, the subscript ‘max’ is omitted but all correlation coefficients discussed in this section refer to the maximum value determined at each time step.

Table 1. Maximum correlation coefficients between inner- and outer-layer quantities at varying near-wall positions $y^+_{NW}$ for the non-actuated reference (REF) and the actuated (ACT) configuration. The results are averaged over $400$ time steps.

A smaller correlation coefficient with respect to the superposition $\bar {R}_{S}$ is determined for the actuated configuration, which corroborates with the reduced coherence of the inner and the outer large scales observed in the supplementary movie. Likewise, the correlation related to the sweeps $\bar {R}_{sw}$ is reduced compared with the reference flow. However, the coherence of the ejections $\bar {R}_{ej}$ is substantially increased, while the amplitude modulation $\bar {R}_{AM}$ is nearly unaffected by the actuation. It is also quite remarkable that the correlation coefficients of superposition, sweeps and ejections related to the actuated configuration are nearly identical at $y^+_{NW} = 1$. With increasing wall-normal distance, the similarity between these coefficients and also the deviation to the values of the reference case decreases.

Overall, these averaged correlation coefficients reveal that the periodic surface deformation attenuates the top-down communication, i.e. the correlation with respect to superposition and sweeps. However, it does not seem to change the fundamental character of the footprinting since the relation between $\bar {R}_{S}$ and $\bar {R}_{sw}$ is unaffected. On the contrary, the actuation enhances the bottom-up communication, i.e. the coherence of the ejections. In view of the findings provided in § 4.2, this is not surprising. Since the large-scale ejections appear more frequently and with increased strength in the actuated flow, the possibility that they reach the outer layer is much higher. Thus, a greater correlation between inner- and outer-layer large-scale ejections exists in the actuated flow. Interestingly, the amplitude modulation is not altered. Since it involves scales slightly smaller than the largest scales (Mäteling & Schröder Reference Mäteling and Schröder2022) but significantly larger than the attenuated small scales, it can be conjectured that the actuation does not interfere with this range of scales.

The analysis of the actuated configuration has also been performed with an inner scaling using the friction velocity of the actuated flow. This approach shifts the outer-layer position closer to the wall ($y^+_{OL} \approx 142$) and has a minor impact on the location of the near-wall layers within the computational grid. The results, however, match closely the previous findings and the interaction quantities deviate by a maximum of $\Delta R_A = \pm 0.02 = \pm 4\,\%$. Thus, it is concluded that the scaling has a negligible impact on the studied properties of the inner–outer interaction within the actuated flow and the results are not shown for brevity.

For a more in-depth analysis, figure 8 presents the time-dependent correlation coefficients for all investigated flow configurations. For clarity, high-frequency fluctuations are removed by applying a moving average filter with a window size of 10 time steps. As an example, the unfiltered distribution of the superposition is shown in light blue.

Figure 8. Time-dependent maximum correlation coefficients using the near-wall locations (a,b$y^+_{NW} = 1$, (c,d$y^+_{NW} = 5$ and (e,f$y^+_{NW} = 15$ and the non-actuated reference (a,c,e) and the actuated flow (b,d,f).

The time-averaged correlation coefficients already indicated that the quantities related to superposition, sweeps and ejections are very similar in the actuated configuration. Figure 8(b,d,f) shows that also their temporal evolution is synchronised but increasing inequality occurs as the wall-normal distance increases. This is an essential difference from the reference configuration, in which only the correlation with respect to superposition and sweeps is aligned. Especially close to the wall at $y_{NW}^+ = 1$ and $5$, the ejections do not contribute significantly to the inner–outer interaction. The reason is that barely any large-scale ejections occur in the viscous sublayer of the reference flow, which was already noted with respect to figure 4.

Using the same approach to study the inner–outer interaction in a turbulent channel flow, Mäteling & Schröder (Reference Mäteling and Schröder2022) observed that the large-scale trends inherent to the time-dependent correlation coefficients relate to the ratio of positive to total large-scale fluctuations in the outer layer. More specifically, the correlation coefficients are higher if a larger domain in the outer layer is populated by high-speed large scales, which is also noticed in the present case. The effect is more pronounced in the actuated flow, i.e. figure 8(b,d,f). However, the large period of $T^+ \approx 500$ prevents an in-depth analysis of the differences from the reference flow due to the limited time frame of the simulation. Furthermore, figure 8 indicates that the quantities of the actuated configuration fluctuate more strongly compared with the reference flow. To analyse if these increased fluctuations relate to actuation-specific properties, a fast Fourier transform of the time-dependent correlation coefficients is conducted. The results of the actuated configurations are given in figure 9. The frequency values are converted to temporal values, which are displayed along the $x$ axis, and the single-sided power spectrum $|P|^2$ normalised by the data length $L$ is given along the $y$ axis. The distributions related to the superposition and the amplitude modulation do not reveal distinct peaks, i.e. these correlation coefficients possess no dominant oscillatory components. However, the distributions of the sweeps and ejections contain distinct peaks around $t^+ \approx 50$ at all near-wall locations. The spread of the distributions across $45 \lesssim t^+ \lesssim 55$ arises from the issue that the data do not contain a perfect sinusoidal oscillation at a single frequency along the complete time span and small deviations provoke such irregularities in the Fourier coefficients. However, the arrangement around $t^+ \approx 50$ clearly indicates that the time-dependent fluctuations of the correlation coefficients are strongly linked to the period $T^+ \approx 50$ of the wall actuation. It can be hypothesised that the upward and downward movement of the sinusoidal surface periodically enhances the inner–outer momentum exchange. More specifically, a phase-dependent generation of intense near-wall large-scale bursting events is provoked as was already observed in a time-averaged manner in the j.p.d.f.s given in figure 4. Since the outer layer is mainly unaffected by the surface actuation as shown in figure 5, the outer-layer structures convect primarily in the streamwise direction similar to the structures in the reference configuration. The large-scale structures in the inner layer experience a time-dependent shift in the spanwise direction relative to the outer flow due to the superimposed secondary velocity field. It appears like a time-dependent ‘breathing’ in the spanwise direction with alternating orientation, i.e. a coalescence in the wave valley and an outward spreading across the wave crest. Thus, the relation to the structures in the outer layer varies as the inner-layer features are alternately compressed in the trough and stretched at the crest. This yields a time-dependent variation of the degree of inner–outer coherence, i.e. the correlation changes with respect to the wave position in the spanwise direction and, thus, the actuation period $T^+ \approx 50$.

Figure 9. Power spectra of the time-dependent correlation coefficients obtained by a fast Fourier transform at (a$y^+_{NW} = 1$, (b$y^+_{NW} = 5$ and (c$y^+_{NW} = 15$ for actuated flow.

Taking a closer look at the impact of the near-wall large-scale bursts that are generated by the surface actuation, the large-scale ejections are essential to explain the modified inner–outer interaction. On the one hand, these ejections are strong enough to reach the considered outer layer and, thus, the correlation with respect to the ejections increases compared with the reference flow (table 1). On the other hand, these ejections weaken or even eliminate sweeps that originate from the outer layer and propagate towards the wall. Thus, the inner–outer coherence of sweeps is reduced and therefore also the superposition phenomenon (table 1) since it is primarily driven by sweeps in the reference flow. As a by-product, the attenuated footprints also lower the wall-shear stress because less high-momentum fluid reaches the near-wall region.

One might question the role of the near-wall large-scale sweeps that are likewise induced by the actuation method. It was already noted in § 4.2 that the overall effect of the equilibrated generation of near-wall large-scale bursts is more significant with respect to the ejections because the reference flow barely hosts any large-scale ejections close to the wall. Furthermore, since these large-scale sweeps are only locally generated, they have hardly any connection to the outer layer. Thus, they do not contribute to the inner–outer interaction, which is supported by the overall reduced correlation coefficient of the sweeps (table 1). Further quantification can be achieved by inspecting the correlation of the large-scale sweeps between different inner-layer locations. For example, the correlation between $y^+ = 1$ and $y^+ = 5$ measures $\bar {R}_{sw} = 0.98$ for the reference configuration, i.e. the large-scale sweeps penetrate the viscous sublayer without noticeable alteration. In the actuated flow, the respective correlation is reduced to $\bar {R}_{sw} = 0.84$ further stressing the decorrelating effect of the actuation. Moreover, due to their confinement to the inner region, the newly induced large-scale sweeps transport only low momentum towards the wall. Consequently, they do not have a considerable adverse effect on the wall-shear stress in contrast to their outer-layer counterparts. In closing, the near-wall large-scale sweeps neither contribute to nor significantly counteract the wall-shear stress reduction mechanism.

The findings of this inner–outer interaction analysis show that the actuation reduces the inner–outer coherence with respect to the superposition and the sweeps, i.e. the top-down communication, and increases the inner–outer correlation regarding the ejections, i.e. the bottom-up communication. These effects arise from the periodic generation of near-wall large-scale bursting events by the actuation, i.e. they are linked to the period of the surface wave deformation. Particularly, the large-scale ejections are of utmost importance for the modified inner–outer interaction and for the lowered wall-shear stress as well. A substantial amount of these ejections is strong enough to reach the outer layer, which increases the correlation between inner and outer ejections. In addition, these ejections balance large-scale sweeps that originate from the outer layer and, thus, reduce the correlation with respect to the sweeps and the superposition. This phenomenon can also be seen as being responsible for the previously reported widening of near-wall streaks (Albers et al. Reference Albers, Meysonnat, Fernex, Semaan, Noack and Schröder2020; Ricco et al. Reference Ricco, Skote and Leschziner2021) due to the larger areas of upward-moving fluid and the reduction of high-speed fluid entering the inner region. Thus, the described effects cause an overall reduced wall-shear stress.

Although these findings already provide valuable insight into the internal processes triggered by the actuation, a second contributor has to be considered to gain a comprehensive picture of the wall-shear stress reduction mechanism, the details of which are given in the following section.

4.4. Analysis of QSVs

Quasi-streamwise vortices are a fundamental feature of turbulent wall-bounded flows and they define the general shape of the mean velocity profile (Hamilton, Kim & Waleffe Reference Hamilton, Kim and Waleffe1995). On one side of the QSV, high-momentum fluid is transported downward to the wall creating a high-speed streak, while on the other side of the vortex low-momentum fluid is lifted upward, which produces a low-speed streak. The interaction of the QSVs and these adjacent streaks defines the core of the near-wall self-sustaining process (Cossu & Hwang Reference Cossu and Hwang2017). Furthermore, the QSVs account for a substantial portion of the wall-normal momentum exchange. They are a main contributor to turbulence production in the near-wall region (Jeong et al. Reference Jeong, Hussain, Schoppa and Kim1997). It goes without saying that a reduction of the number and strength of these vortices is favourable in view of drag-reducing methods.

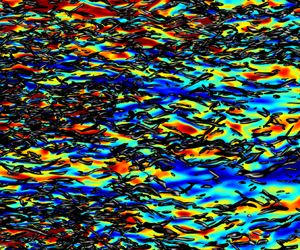
Figure 10 shows the QSVs and the streamwise velocity fluctuations at $y^+_{NW} = 15$ in the inlet section, i.e. the region starting at $x_0$ in which the surface deformation is progressively increased until the surface wave is fully developed downstream of $\Delta x^+ \approx 4500$. It is clearly visible that the number of QSVs reduces and the spanwise width of the streaks increases with increasing influence of the actuation. This effect was already reported for the present actuation technique (e.g. Albers et al. Reference Albers, Meysonnat, Fernex, Semaan, Noack and Schröder2020). It also occurs for other drag-reduction methods as summarised in the recent review by Ricco et al. (Reference Ricco, Skote and Leschziner2021). There is, however, no general consensus on the mechanisms responsible for these flow field modifications. Certainly, a vortex breakup process must be involved resulting in the reduced number of QSVs. This breakup process is elaborated on in the following.

Figure 10. The QSVs (black isosurfaces) and streamwise velocity fluctuations $u^{\prime +}$ at $y^+_{NW} = 15$ (colour contours) in the inlet region of the actuated flow.

To investigate which flow region is subjected most to the observed reduction of QSVs, a p.d.f. of the centroid positions of the QSVs within the test section, i.e. the region where the actuation influence is fully established (figure 2), is determined. The p.d.f.s of both flow configurations are displayed in figure 11 as a function of the wall-normal coordinate $y^+$. The figure clearly reveals that the vortex breakup happens predominantly in the lower buffer layer. As a result, the actuation shifts the peak position of the p.d.f. from the lower buffer layer to the mid-level buffer layer. Consequently, the wall-normal momentum exchange close to the wall, i.e. below $y^+ \approx 20$, is attenuated compared with the reference flow since fewer QSVs are available to pump fluid upward and downward. This is consistent with the narrower j.p.d.f.s of the total velocity fluctuations given in figure 4 and the previously reported reduction of the absolute velocity fluctuations in the near-wall region (Albers et al. Reference Albers, Meysonnat, Fernex, Semaan, Noack and Schröder2020; Ricco et al. Reference Ricco, Skote and Leschziner2021). It also explains the widening of the near-wall streaks since the essential flow feature that maintains the segregation into adjacent low- and high-speed streaks occurs less frequently. This effect is further substantiated by the increased probability of near-wall large-scale ejections and the reduced outer-layer impact discussed in § 4.3. However, the mechanism by which the actuation initiates these flow modifications is still to be described.

Figure 11. The p.d.f.s of the QSVs’ centroid position as a function of the wall-normal distance for the non-actuated reference (REF) and the actuated flow (ACT).

To understand how the actuation interferes with the flow structures, we first have to take a look at the secondary flow field that is generated by the periodic wall deformation. This secondary flow field possesses periodic wall-normal and spanwise velocity components that are superimposed onto the turbulent fluctuations as described in § 2. Figure 12 shows the respective phase-averaged velocity gradients of this flow field, which are averaged over a time interval of $\Delta t^+ \approx 6740$, i.e. approximately $135$ forcing periods. The gradients are presented for the complete spanwise dimension at a fixed streamwise position and the surface deformation is flattened for this visualisation. The wall-normal velocity gradients $\partial \tilde {v}^+/\partial y^+$ (figure 12a) and $\partial \tilde {w}^+/\partial y^+$ (figure 12d) are very intense close to the wall ($y^+ \lesssim 20$) such that enlargements of the near-wall region with modified colourbar limits are provided in figures 12(b) and 12(e). These extracts reveal that $\partial \tilde {w}^+/\partial y^+$ is one order of magnitude larger compared with $\partial \tilde {v}^+/\partial y^+$. Besides this inner region, the strength of the wall-normal gradients is of the same order as the spanwise gradients given in figures 12(c) and 12(f). The spanwise gradients moderately reduce with increasing wall-normal distance and do not exhibit such a severe reduction in intensity between the near-wall area and the lower buffer layer as their wall-normal counterparts.

Figure 12. Time-averaged velocity gradients (a,b$\partial \tilde {v}^+/\partial y^+$, (c$\partial \tilde {v}^+/\partial z^+$, (d,e$\partial \tilde {w}^+/\partial y^+$ and (f$\partial \tilde {w}^+/\partial z^+$ of the secondary flow field at $x_1$. Note that the surface is flattened and that (b,e) depict enlargements of the near-wall region with modified colourbar limits.

It is demonstrated in the following that the presented velocity gradients of the secondary flow field interfere with the QSVs to provoke their breakup, which is favourable in view of friction drag reduction as explained above. Therefore, a detailed look at a single QSV breakup process in the lower buffer layer of the actuated flow is taken before a statistical analysis is conducted.

Figure 13 shows a short time series of a QSV that is progressively reduced in size until it completely vanishes. The figure displays wall-normal/spanwise layers at the streamwise position of the centroid of the vortex. The QSV is visualised in grey and the background coloured contours are – from left to right – the streamwise velocity fluctuations $u^{\prime +}$, the spanwise gradient of the secondary wall-normal flow $\partial \tilde {v}^+/\partial z^+$ and the wall-normal gradient of the secondary spanwise flow $\partial \tilde {w}^+/\partial y^+$.

Figure 13. Instantaneous visualisations of the breakup of a QSV at $x/\delta _2 \approx 98$ shown in grey in the actuated flow at (a$t^+ \approx 7$, (b$t^+ \approx 12$ and (c$t^+ \approx 17$. Contours from left to right: streamwise fluctuations $u^{\prime +}$, spanwise gradient of superimposed wall-normal velocity $\partial \tilde {v}^+/\partial z^+$ and wall-normal gradient of superimposed spanwise velocity $\partial \tilde {w}^+/\partial y^+$.

Starting at $t^+ \approx 7$ (figure 13a), the cross-section of the QSV is already deformed from its typical, roughly circular form into an elliptic shape. In addition, the vortex is inclined to the horizontal axis. Both modifications yield a disruption of the organised streak–vortex pairing. That is, this positively rotating QSV should have a low-speed streak on its left and a high-speed streak on its right flank. However, the deformed vortex drags the low-speed fluid across its complete upper area and the high-speed streak beneath. With time progressing (figure 13b,c), the QSV gets fully immersed within the low-speed fluid until it disintegrates.

The illustrations of the gradients $\partial \tilde {v}^+/\partial z^+$ and $\partial \tilde {w}^+/\partial y^+$ (figure 13b,c) reveal that the superimposed velocity gradients acting on the QSV during its breakup are positive. While $\partial \tilde {v}^+/\partial z^+$ is approximately constant across the vortex, a wall-normal increase is visible for $\partial \tilde {w}^+/\partial y^+$.

Certainly, the time series of a single QSV is insufficient to provide a comprehensive overview of the processes involved in the vortex breakup. Therefore, each QSV within the test section is tracked and inspected for a volume decrease with subsequent elimination. The periodic velocity gradients that are imposed onto the vortices by the secondary flow field during vortex breakdown are stored and used to create the j.p.d.f.s given in figure 14. The gradients are normalised by the maximum gradient at the wall-normal position of the vortex centroid to account for the $y$-dependent gradient changes (figure 12). In addition, the figure provides sketches of the deformed cross-section of an initially circular QSV when the respective gradients act on it. Certainly, these sketches represent idealised vortex shapes and the realistic deformation involving three-dimensional disturbances is less regular.

Figure 14. Joint probability density distributions of velocity gradients of the secondary flow field superimposed by the actuation during QSV breakup.

The analysis of these j.p.d.f.s reveals that predominantly gradient combinations that deform the QSVs into an elliptic shape are the driving forces for vortex breakup. The gradient combination observed in figure 13 is shown in figure 14(a) in the upper right corner and its high probability indicates that it is characteristic for these breakup processes. The gradient combinations depicted in figure 14(b) stretch the QSV in the spanwise or wall-normal direction without any tilting. An increased probability occurs for the wall-normal stretching, which could result in an accelerated breakup due to the strong wall-normal gradient of the streamwise velocity component additionally acting on the QSV. The non-displayed gradient combinations possess negligible probabilities and, consequently, do not play a significant role in the vortex breakup process. Note that the gradients considered in figure 14 do only occur jointly at certain intervals. More precisely, the quantities given in figure 14(a) appear collectively at approximately one-sixth and the gradients in figure 14(b) at around one-third of the considered domain. This can be extracted from the time-averaged representation of the secondary flow field in figure 12. Thus, vortex breakup is limited to certain time intervals, i.e. it is phase-dependent, and consequently it is a function of the actuation parameters.

The instability of elliptic vortices subjected to straining flow, which is the secondary flow field in the present study, has been extensively investigated in the literature but in a different context. In the following, a short summary of the main findings is given, which match the presently observed phenomena and provide further insight into the mechanism of vortex breakup.

In a first fundamental study, Kida (Reference Kida1981) provided the exact solution of a Rankine-type vortex in an inviscid, incompressible, 2-D flow with uniform strain and uniform vorticity and found different vortex states depending on the relative magnitudes of the vortex vorticity, the flow field vorticity and the strain rate of the flow field. The steady state, which was already investigated by Moore & Saffman (Reference Moore and Saffman1971), is observed for weak rates of strain and small aspect ratios of the elliptic vortex. Such a stable state most probably exists in the present flow field at intervals where the velocity gradient combinations given in figure 14 do not occur jointly or are comparably small. Furthermore, the small aspect ratio relates to a more circular cross-section of the QSV, which indicates that the vortex has not been severely deformed by the secondary flow field yet. Kida also observed that the vortex either rotates, nutates or collapses into a thin, infinitely elongated vortex layer for an increasing aspect ratio. These unstable vortex states all yield vortex disintegration. As revealed by Dhanak & Marshall (Reference Dhanak and Marshall1993) for a periodically varying straining flow, the destabilisation can be traced back to a resonance phenomenon.

Further analyses focused on the ‘stripping’ phenomenon, which describes the advection of vorticity at the vortex periphery and, thus, ‘erodes’ the vortex (Dritschel Reference Dritschel1989). Due to an interplay of the velocity field of the vortex and the strain field, stagnation points can occur within the vortex and extrude filaments/tongues of vorticity from the vortex, which are advected by the flow. Abrupt application of adverse shear as it occurs in the present actuated flow due to the phase-dependent secondary flow field can severely pronounce this phenomenon. As a consequence of stripping, the eroded vortex is left with strong vorticity gradients at its periphery and viscous diffusion generates an outward vorticity flux for compensation. This ‘leakage’ of vorticity enhances the vortex decay, which finally ends with vortex breakup. Interestingly, the vortex core retains an almost elliptic shape until it rotates towards the axis of extensional strain immediately before indefinite elongation and breakup. Such a stripping phenomenon seems to be a plausible explanation for the vortex breakup visualised in figure 13, which is representative for the QSV disintegration observed in the present study. According to Dritschel (Reference Dritschel1989), the whole phenomenon is driven by the strain to peak vortex vorticity ratio independent of the vorticity profile inside the vortex. Thus, stronger gradients of the secondary flow field are more likely involved in the breakup process, which is corroborated by figure 14. The diffusion controls how fast the vortex breaks up and the Reynolds number additionally controls the vortex lifetime (Mariotti, Legras & Dritschel Reference Mariotti, Legras and Dritschel1994).

Additional investigations and observations on the instability of elliptic vortices subjected to shearing, straining and rotating flow can be found in a recent review by Koshel, Ryzhov & Carton (Reference Koshel, Ryzhov and Carton2019).

4.5. Wall-shear stress reduction mechanism

The findings of the former analyses result in a hypothesis about the mechanism by which spanwise travelling transversal surface waves reduce the wall-shear stress. Note that the hypothesis is tailored to this specific actuation technique and might not necessarily hold for other flow control techniques. For example, spanwise wall oscillations without wall-normal surface deformation do not directly generate a secondary wall-normal velocity field, which is a key element of the present theory.

The actuation interacts with the instantaneous flow field by the combined effect of two actions. That is, the periodic generation of near-wall large-scale bursts by the upward and downward surface movement and the deformation of QSVs due to the periodic velocity gradients of the secondary flow field. These phenomena and their impact on the flow structures are schematically depicted in figure 15 and the flowchart given in figure 16 provides the causal relationships that are theoretically described in the following.

Figure 15. Schematic illustrating the wall-shear stress reduction mechanism. For reference, a characteristic, instantaneous picture of the undisturbed flow features is presented (a). Since the outer layer is not directly affected by the actuation, the same outer-layer snapshot is displayed for the actuated TBL flow (b). However, the physical phenomena closer to the wall are altered. The intensified large-scale ejections locally balance sweeps that originate from the outer layer as illustrated in the zoom (right). As a result, the streaky structure is disturbed depriving the livelihood of the QSVs. In addition, the velocity gradients of the secondary flow field deform the vortex (example in bottom zoom). Both effects yield vortex disintegration and attenuated near-wall fluctuations, which are indicated by the shortening of the vortex and the reduction of small-scale structures compared with the reference scenario. Note that the surface of the actuated configuration is flattened for simplicity.

Figure 16. Flowchart illustrating the causal relationships of the wall-shear stress reduction mechanism.

First, the generation process of large-scale sweeps and ejections is considered. Since these events are a main contributor to the wall-normal momentum exchange and the turbulence production in natural, undisturbed turbulent flows (Corino & Brodkey Reference Corino and Brodkey1969; Lu & Willmarth Reference Lu and Willmarth1973; Jeong et al. Reference Jeong, Hussain, Schoppa and Kim1997), it seems contradictory that their appearance is beneficial in the present context of wall-shear stress reduction. However, the induced near-wall large-scale ejections serve two favourable purposes as outlined in §§ 4.2 and 4.3. On the one hand, more fluid is lifted away from the wall compared with the reference flow. More precisely, this lift-up occurs in the form of large-scale patches, which widen the low-speed streaks as previously reported for drag-reduced flows (Touber & Leschziner Reference Touber and Leschziner2012; Albers et al. Reference Albers, Meysonnat, Fernex, Semaan, Noack and Schröder2020) and locally reduces the wall-shear stress. On the other hand, the strong ejections balance high-speed, downward-oriented fluid from the outer layer. Consequently, the intensity of near-wall high-speed streaks is much lower compared with the reference flow, which has a favourable impact on the wall-shear stress level. These effects add up yielding rather low-momentum fluid near the wall, which is one main contributor to the overall reduced wall-shear stress. On the contrary, the large-scale sweeps that are likewise generated by the actuation do not play a significant role as described in § 4.3. Since they are confined to the inner layer and not connected to the outer layer, they transport only low-intensity fluid towards the wall. Thus, they are not able to create intense high-speed streaks, which would counteract the benefits of the large-scale ejections.

The described effects of the modified bursting activity also alter the inner–outer interaction. Since the superposition of outer-layer large-scale motions onto the near-wall dynamics is primarily driven by sweeping motion in the reference flow (§ 4.3), its attenuation due to the compensating effect of the large-scale ejections in the actuated flow substantially corrupts the top-down interaction. The fundamental character of the inner–outer interaction is not altered by the actuation since the similarity between superposition-related and sweep-related correlation still exists (table 1; figure 8). Thus, the actuation essentially mitigates the impact of the outer-layer structures onto the inner region, which certainly damps high-intensity fluctuations close to the wall. It is remarkable that the actuation is capable of interfering with the outer-layer impact since the actuation parameters are aligned with the near-wall dynamics. This property might explain why this flow control method is still very efficient at higher Reynolds numbers. The drag-reduction margin is reduced by only $\Delta c_d \approx 2.4\,\%$ compared with the $Re_\tau \approx 390$ case with identical actuation parameters. Considering the overall objective of deploying such a method in real-world applications, this behaviour is very beneficial since the outer-layer influence on the near-wall flow field further increases with higher Reynolds number.

The second substantial effect of the present flow control method on the internal flow structure is exerted by the induced strain field as highlighted in § 4.4. The gradients of the wall-normal and the spanwise velocity components of the secondary flow field in the wall-normal and the spanwise direction jointly act to deform the QSV cross-section from a circular into an elliptic shape (figure 14). Since such elliptic vortices are highly prone to instabilities, an interaction with the secondary flow field and three-dimensional disturbances of the instantaneous flow field destabilises the QSVs resulting in vortex disintegration (Robinson & Saffman Reference Robinson and Saffman1984; Dritschel Reference Dritschel1990; Dhanak & Marshall Reference Dhanak and Marshall1993). Since QSVs are a main contributor to the wall-normal momentum exchange and, thus, the turbulence production (Jeong et al. Reference Jeong, Hussain, Schoppa and Kim1997), their breakup lowers the wall-shear stress. In particular, a reduced number of QSVs substantiates the previously mentioned streak attenuation and widening since both phenomena are inevitably intertwined. The segregation of alternating high-speed and low-speed streaks in the near-wall region is maintained by the QSVs (Hamilton et al. Reference Hamilton, Kim and Waleffe1995), while these vortices originate, among other mechanisms, from instabilities associated with lifted streaks (Schoppa & Hussain Reference Schoppa and Hussain2002). Breaking this self-sustained near-wall cycle at any point prevents regeneration of near-wall structures and yields laminarisation (Jiménez & Pinelli Reference Jiménez and Pinelli1999). Since these near-wall structures appear to be mandatory to maintain turbulence (Jiménez & Moin Reference Jiménez and Moin1991), their collapse is ideal in terms of drag reduction. The phase dependence of the secondary flow field, however, inhibits a complete destruction of the flow topology since it can, to a certain extent, regenerate in phases where the imposed velocity gradients are weak and/or do not occur simultaneously in favourable combinations (figure 14). It is also interesting to note that once the near-wall flow field is made ‘more uniform’ by reducing the streak intensity and destroying their organised structure, the effect of the actuation is further promoted by the flow field itself. Instead of solely maintaining the streaky structure as required in the reference flow, it has to be actively created to provide a solid viability of the QSVs. This requires further energy expenditure and potentially contributes to QSV disintegration and the overall reduction in near-wall energy.

5. Conclusion

The alteration of the near-wall flow resulting in a reduced wall-shear stress of a TBL flow subjected to spanwise travelling transversal surface waves at a friction Reynolds number $Re_\tau \approx 1525$ is investigated.

A 2-D NA-MEMD is applied to wall-parallel planes of streamwise and wall-normal velocity fluctuations. The simultaneous decomposition yields a scale-based segmentation of physically connected features with spatial and temporal coherence. The analysis of the resulting large-scale flow structures by j.p.d.f.s reveals that the actuation method periodically induces near-wall large-scale ejections in the near-wall region. They are more intense and appear more frequently compared with the undisturbed reference flow. Note that the j.p.d.f.s of the total velocity fluctuations indicate an opposite effect, i.e. a damping of ejections.

The role of the induced near-wall large-scale ejections in terms of wall-shear stress reduction is illuminated by a comparative inner–outer interaction analysis of the undisturbed reference and the actuated flow. Using the large-scale streamwise and wall-normal fluctuations at three near-wall locations $y_{NW}^+ = 1,5,15$ and at the outer-layer location $y_{OL}^+ = 155$ where the large scales are most energetic, the superposition phenomenon, the interaction via bursting events and the amplitude modulation are studied. The results show a reduced inner–outer coherence with respect to the superposition and the sweeps and an enhanced correlation related to the ejections in the actuated flow. The amplitude modulation appears to be insensitive to the flow field changes. Applying a fast Fourier transform to the time-dependent correlation coefficients shows that temporal fluctuations of the bursting-related coefficients are conditional on the period of the surface actuation. This stresses that the large-scale ejections are indeed induced by the actuation method. Due to their increased strength and prevalence, they are more likely to reach the outer layer increasing the related correlation coefficient. Furthermore, they are able to balance large-scale sweeps originating from the outer layer and, thus, attenuate their near-wall impact. Consequently, the correlation coefficients related to superposition and sweeps are reduced. It is interesting to note that the actuation method is able to interfere with the outer-layer impact on the near-wall flow field although the actuation parameters are tailored to the near-wall dynamics.

Furthermore, the present study highlights the interaction of the periodic velocity gradients of the secondary flow field with QSVs. Specific combinations of the periodic velocity gradients deform the circular cross-section of the QSVs into an elliptic shape and this unstable vortex state leads to vortex disintegration. As a consequence, the wall-normal momentum exchange and the turbulence production are reduced. This primarily happens in the lower buffer layer where the wall-normal gradients of the secondary flow field are most intense. In combination with the formerly described impact of the large-scale ejections, the energy contained in the near-wall flow field is substantially reduced resulting in a lower wall-shear stress level. These observations are also consistent with the widening of near-wall streaks observed in previous studies. The more frequently appearing large-scale ejections and the reduced amount of QSVs inhibit the establishment of an organised segregation into alternating low- and high-speed streaks.

The current findings provide the foundation for a comprehensive hypothesis on the mechanism by which spanwise travelling transversal surface waves reduce the wall-shear stress in turbulent wall-bounded flows. Further analyses need to be conducted since a dependence on the actuation parameters, namely amplitude, wavelength and period, and the Reynolds number must exist. Some evidence was already given with respect to the phase-dependent gradient combinations that yield QSV breakup.

Supplementary movie

Supplementary movie is available at https://doi.org/10.1017/jfm.2023.54.

Funding

The research was funded by the Deutsche Forschungsgemeinschaft (DFG) in the framework of the research project SCHR-309/68 and by the European Commission's Horizon 2020 Research and Innovation Framework Programme within the CoE RAISE project under grant agreement no. 951733. The authors gratefully acknowledge the Gauss Centre for Supercomputing e.V. (www.gauss-centre.eu) for funding this project by providing computing time on the GCS Supercomputers HAWK at the High-Performance Computing Centre Stuttgart (www.hlrs.de).

Declaration of interests

The authors report no conflict of interest.

References

Adrian, R.J., Christensen, K.T. & Liu, Z.-C. 2000 Analysis and interpretation of instantaneous turbulent velocity fields. Exp. Fluids 29 (3), 275290.CrossRefGoogle Scholar
Agostini, L. & Leschziner, M. 2014 On the influence of outer large-scale structures on near-wall turbulence in channel flow. Phys. Fluids 26 (7), 075107.CrossRefGoogle Scholar
Agostini, L. & Leschziner, M. 2018 The impact of footprints of large-scale outer structures on the near-wall layer in the presence of drag-reducing spanwise wall motion. Flow Turbul. Combust. 100, 10371061.CrossRefGoogle Scholar
Agostini, L. & Leschziner, M. 2021 Statistical analysis of outer large-scale/inner-layer interactions in channel flow subjected to oscillatory drag-reducing wall motion using a multiple-variable joint-probability-density function methodology. J. Fluid Mech. 923, A25.CrossRefGoogle Scholar
Albers, M., Meysonnat, P.S., Fernex, D., Semaan, R., Noack, B.R. & Schröder, W. 2020 Drag reduction and energy saving by spanwise traveling transversal surface waves for flat plate flow. Flow Turbul. Combust. 105, 125157.CrossRefGoogle Scholar
Corino, E.R. & Brodkey, R.S. 1969 A visual investigation of the wall region in turbulent flow. J. Fluid Mech. 37 (1), 130.CrossRefGoogle Scholar
Cornish, J.J. III & Boatwright, D.W. 1960 Application of full scale boundary layer measurements to drag reduction of airships. Tech. Rep. 28. Mississippi State University.CrossRefGoogle Scholar
Cossu, C. & Hwang, Y. 2017 Self-sustaining processes at all scales in wall-bounded turbulent shear flows. Phil. Trans. R. Soc. Lond. A 375 (2089), 20160088.Google ScholarPubMed
Dhanak, M.R. & Marshall, M.P. 1993 Motion of an elliptical vortex under applied periodic strain. Phys. Fluids A 5 (5), 12241230.CrossRefGoogle Scholar
Dritschel, D.G. 1989 Strain-induced vortex stripping. In Mathematical Aspects of Vortex Dynamics (ed. R.E. Caflisch), pp. 107–119. SIAM.Google Scholar
Dritschel, D.G. 1990 The stability of elliptical vortices in an external straining flow. J. Fluid Mech. 210, 223261.CrossRefGoogle Scholar
Fernex, D., Semaan, R., Albers, M., Meysonnat, P.S., Schröder, W. & Noack, B.R. 2020 Actuation response model from sparse data for wall turbulence drag reduction. Phys. Rev. Fluids 5 (7), 073901.CrossRefGoogle Scholar
Ganapathisubramani, B., Hutchins, N., Monty, J.P., Chung, D. & Marusic, I. 2012 Amplitude and frequency modulation in wall turbulence. J. Fluid Mech. 712, 6191.CrossRefGoogle Scholar
Gatti, D. & Quadrio, M. 2013 Performance losses of drag-reducing spanwise forcing at moderate values of the Reynolds number. Phys. Fluids 25 (12), 125109.CrossRefGoogle Scholar
Gatti, D. & Quadrio, M. 2016 Reynolds-number dependence of turbulent skin-friction drag reduction induced by spanwise forcing. J. Fluid Mech. 802, 553582.CrossRefGoogle Scholar
Hamilton, J.M., Kim, J. & Waleffe, F. 1995 Regeneration mechanisms of near-wall turbulence structures. J. Fluid Mech. 287, 317348.CrossRefGoogle Scholar
Hussain, A.K.M.F. & Reynolds, W.C. 1970 The mechanics of an organized wave in turbulent shear flow. J. Fluid Mech. 41 (2), 241258.CrossRefGoogle Scholar
Hutchins, N. & Marusic, I. 2007 Large-scale influences in near-wall turbulence. Phil. Trans. R. Soc. Lond. A 365 (1852), 647664.Google ScholarPubMed
Jeong, J., Hussain, F., Schoppa, W. & Kim, J. 1997 Coherent structures near the wall in a turbulent channel flow. J. Fluid Mech. 332, 185214.CrossRefGoogle Scholar
Jiménez, J. & Moin, P. 1991 The minimal flow unit in near-wall turbulence. J. Fluid Mech. 225, 213240.CrossRefGoogle Scholar
Jiménez, J. & Pinelli, A. 1999 The autonomous cycle of near-wall turbulence. J. Fluid Mech. 389, 335359.CrossRefGoogle Scholar
Jung, W.-J., Mangiavacchi, N. & Akhavan, R. 1992 Suppression of turbulence in wall-bounded flows by high-frequency spanwise oscillations. Phys. Fluids A 4 (8), 16051607.CrossRefGoogle Scholar
Kida, S. 1981 Motion of an elliptic vortex in a uniform shear flow. J. Phys. Soc. Japan 50 (10), 35173520.CrossRefGoogle Scholar
Koh, S.R., Meysonnat, P., Statnikov, V., Meinke, M. & Schröder, W. 2015 Dependence of turbulent wall-shear stress on the amplitude of spanwise transversal surface waves. Comput. Fluids 119, 261275.CrossRefGoogle Scholar
Koshel, K.V., Ryzhov, E.A. & Carton, X.J. 2019 Vortex interactions subjected to deformation flows: a review. Fluids 4 (1), 14.CrossRefGoogle Scholar
Laadhari, F., Skandaji, L. & Morel, R. 1994 Turbulence reduction in a boundary layer by a local spanwise oscillating surface. Phys. Fluids 6 (10), 32183220.CrossRefGoogle Scholar
Li, W., Roggenkamp, D., Hecken, T., Jessen, W., Klaas, M. & Schröder, W. 2018 Parametric investigation of friction drag reduction in turbulent flow over a flexible wall undergoing spanwise transversal traveling waves. Exp. Fluids 59 (6), 118.CrossRefGoogle Scholar
Li, W., Roggenkamp, D., Paakkari, V., Klaas, M., Soria, J. & Schroeder, W. 2020 Analysis of a drag reduced flat plate turbulent boundary layer via uniform momentum zones. Aerosp. Sci. Technol. 96, 105552.CrossRefGoogle Scholar
Lu, S.S. & Willmarth, W.W. 1973 Measurements of the structure of the Reynolds stress in a turbulent boundary layer. J. Fluid Mech. 60 (3), 481511.CrossRefGoogle Scholar
Mariotti, A., Legras, B. & Dritschel, D.G. 1994 Vortex stripping and the erosion of coherent structures in two-dimensional flows. Phys. Fluids 6 (12), 39543962.CrossRefGoogle Scholar
Marusic, I., Chandran, D., Rouhi, A., Fu, M.K., Wine, D., Holloway, B., Chung, D. & Smits, A.J. 2021 An energy-efficient pathway to turbulent drag reduction. Nat. Commun. 12 (1), 18.CrossRefGoogle ScholarPubMed
Marusic, I. & Heuer, W.D.C. 2007 Reynolds number invariance of the structure inclination angle in wall turbulence. Phys. Rev. Lett. 99 (11), 114504.CrossRefGoogle ScholarPubMed
Marusic, I., Mathis, R. & Hutchins, N. 2010 High Reynolds number effects in wall turbulence. Intl J. Heat Fluid Flow 31 (3), 418428.CrossRefGoogle Scholar
Mäteling, E., Klaas, M. & Schröder, W. 2020 Detection of small-scale/large-scale interactions in turbulent wall-bounded flows. Phys. Rev. Fluids 5 (11), 114610.CrossRefGoogle Scholar
Mäteling, E. & Schröder, W. 2022 Analysis of spatiotemporal inner-outer large-scale interactions in turbulent channel flow by multivariate empirical mode decomposition. Phys. Rev. Fluids 7, 034603.CrossRefGoogle Scholar
Moore, D.W. & Saffman, P.G. 1971 Structure of a line vortex in an imposed strain. In Aircraft Wake Turbulence and its Detection (ed. J.H. Olsen, A. Goldburg, M. Rogers), pp. 339–354. Springer.CrossRefGoogle Scholar
Nagib, H.M., Chauhan, K.A. & Monkewitz, P.A. 2007 Approach to an asymptotic state for zero pressure gradient turbulent boundary layers. Phil. Trans. R. Soc. Lond. A 365 (1852), 755770.Google Scholar
Quadrio, M., Ricco, P. & Viotti, C. 2009 Streamwise-travelling waves of spanwise wall velocity for turbulent drag reduction. J. Fluid Mech. 627, 161178.CrossRefGoogle Scholar
Ricco, P., Skote, M. & Leschziner, M. 2021 A review of turbulent skin-friction drag reduction by near-wall transverse forcing. Prog. Aerosp. Sci. 123, 100713.CrossRefGoogle Scholar
Robinson, A.C. & Saffman, P.G. 1984 Three-dimensional stability of an elliptical vortex in a straining field. J. Fluid Mech. 142, 451466.CrossRefGoogle Scholar
Roidl, B., Meinke, M. & Schröder, W. 2013 A reformulated synthetic turbulence generation method for a zonal RANS–LES method and its application to zero-pressure gradient boundary layers. Intl J. Heat Fluid Flow 44, 2840.CrossRefGoogle Scholar
Schoppa, W. & Hussain, F. 2002 Coherent structure generation in near-wall turbulence. J. Fluid Mech. 453, 57108.CrossRefGoogle Scholar
Skote, M. 2022 Drag reduction of turbulent boundary layers by travelling and non-travelling waves of spanwise wall oscillations. Fluids 7 (2), 65.CrossRefGoogle Scholar
Tamano, S. & Itoh, M. 2012 Drag reduction in turbulent boundary layers by spanwise traveling waves with wall deformation. J. Turbul. 13, N9.CrossRefGoogle Scholar
Tomiyama, N. & Fukagata, K. 2013 Direct numerical simulation of drag reduction in a turbulent channel flow using spanwise traveling wave-like wall deformation. Phys. Fluids 25 (10), 105115.CrossRefGoogle Scholar
Tomkins, C.D. & Adrian, R.J. 2003 Spanwise structure and scale growth in turbulent boundary layers. J. Fluid Mech. 490, 3774.CrossRefGoogle Scholar
Touber, E. & Leschziner, M.A. 2012 Near-wall streak modification by spanwise oscillatory wall motion and drag-reduction mechanisms. J. Fluid Mech. 693, 150200.CrossRefGoogle Scholar
Vessey, H.F. 1935 Skin friction drag: the practical importance of reduction in profile and fuselage drag. Aircr. Engng Aerosp. Tec. 7, 173174.CrossRefGoogle Scholar
Weske, J.R. 1939 Reduction of skin-friction on a flat plate through boundary layer control. J. Aeronaut. Sci. 6 (7), 289291.CrossRefGoogle Scholar
Zhou, J., Adrian, R.J., Balachandar, S. & Kendall, T.M. 1999 Mechanisms for generating coherent packets of hairpin vortices in channel flow. J. Fluid Mech. 387, 353396.CrossRefGoogle Scholar
Figure 0

Figure 1. Schematic of the physical domain of the actuated TBL flow (STG, synthetic turbulence generation).

Figure 1

Figure 2. Streamwise evolution of the friction drag.

Figure 2

Figure 3. Wall-normal distributions of the symmetric and shear-stress components of the Reynolds stress tensor for the non-actuated reference (REF) and the actuated flow (ACT).

Figure 3

Figure 4. Joint probability density distributions of the total velocity fluctuations $u^{\prime +}_{NW},v^{\prime +}_{NW}$ (a,c,e) and the large-scale velocity fluctuations $u^{\prime +}_{NW,LS},v^{\prime +}_{NW,LS}$ (b,d,f) at three near-wall locations (a,b$y^+_{NW} = 1$, (c,d$y^+_{NW} = 5$ and (e,f$y^+_{NW} = 15$ for the non-actuated reference (REF) and the actuated flow (ACT).

Figure 4

Figure 5. Joint probability density distributions of (a) total and (b) large-scale velocity fluctuations at the outer-layer position $y^+_{OL}=155$ for the non-actuated reference (REF) and the actuated flow (ACT).

Figure 5

Figure 6. Large-scale streamwise and wall-normal velocity fluctuations (a$u^{\prime +}_{OL,LS}$, (b$v^{\prime +}_{OL,LS}$, (c$u^{\prime +}_{NW,LS}$ and (d$v^{\prime +}_{NW,LS}$ at $y^+_{NW} =1, y^+_{OL} =155$ and $t^+ = 1$ for the reference flow. Solid lines indicate large-scale sweeps and dashed lines large-scale ejections.

Figure 6

Figure 7. Large-scale streamwise and wall-normal velocity fluctuations (a$u^{\prime +}_{OL,LS}$, (b$v^{\prime +}_{OL,LS}$, (c$u^{\prime +}_{NW,LS}$ and (d$v^{\prime +}_{NW,LS}$ at $y^+_{NW} =1, y^+_{OL} =155$ and $t^+ = 1$ for the actuated flow. Solid lines indicate large-scale sweeps and dashed lines large-scale ejections.

Figure 7

Table 1. Maximum correlation coefficients between inner- and outer-layer quantities at varying near-wall positions $y^+_{NW}$ for the non-actuated reference (REF) and the actuated (ACT) configuration. The results are averaged over $400$ time steps.

Figure 8

Figure 8. Time-dependent maximum correlation coefficients using the near-wall locations (a,b$y^+_{NW} = 1$, (c,d$y^+_{NW} = 5$ and (e,f$y^+_{NW} = 15$ and the non-actuated reference (a,c,e) and the actuated flow (b,d,f).

Figure 9

Figure 9. Power spectra of the time-dependent correlation coefficients obtained by a fast Fourier transform at (a$y^+_{NW} = 1$, (b$y^+_{NW} = 5$ and (c$y^+_{NW} = 15$ for actuated flow.

Figure 10

Figure 10. The QSVs (black isosurfaces) and streamwise velocity fluctuations $u^{\prime +}$ at $y^+_{NW} = 15$ (colour contours) in the inlet region of the actuated flow.

Figure 11

Figure 11. The p.d.f.s of the QSVs’ centroid position as a function of the wall-normal distance for the non-actuated reference (REF) and the actuated flow (ACT).

Figure 12

Figure 12. Time-averaged velocity gradients (a,b$\partial \tilde {v}^+/\partial y^+$, (c$\partial \tilde {v}^+/\partial z^+$, (d,e$\partial \tilde {w}^+/\partial y^+$ and (f$\partial \tilde {w}^+/\partial z^+$ of the secondary flow field at $x_1$. Note that the surface is flattened and that (b,e) depict enlargements of the near-wall region with modified colourbar limits.

Figure 13

Figure 13. Instantaneous visualisations of the breakup of a QSV at $x/\delta _2 \approx 98$ shown in grey in the actuated flow at (a$t^+ \approx 7$, (b$t^+ \approx 12$ and (c$t^+ \approx 17$. Contours from left to right: streamwise fluctuations $u^{\prime +}$, spanwise gradient of superimposed wall-normal velocity $\partial \tilde {v}^+/\partial z^+$ and wall-normal gradient of superimposed spanwise velocity $\partial \tilde {w}^+/\partial y^+$.

Figure 14

Figure 14. Joint probability density distributions of velocity gradients of the secondary flow field superimposed by the actuation during QSV breakup.

Figure 15

Figure 15. Schematic illustrating the wall-shear stress reduction mechanism. For reference, a characteristic, instantaneous picture of the undisturbed flow features is presented (a). Since the outer layer is not directly affected by the actuation, the same outer-layer snapshot is displayed for the actuated TBL flow (b). However, the physical phenomena closer to the wall are altered. The intensified large-scale ejections locally balance sweeps that originate from the outer layer as illustrated in the zoom (right). As a result, the streaky structure is disturbed depriving the livelihood of the QSVs. In addition, the velocity gradients of the secondary flow field deform the vortex (example in bottom zoom). Both effects yield vortex disintegration and attenuated near-wall fluctuations, which are indicated by the shortening of the vortex and the reduction of small-scale structures compared with the reference scenario. Note that the surface of the actuated configuration is flattened for simplicity.

Figure 16

Figure 16. Flowchart illustrating the causal relationships of the wall-shear stress reduction mechanism.

Mäteling et al. Supplementary Movie

See "Mäteling et al. Supplementary Movie Captions"

Download Mäteling et al. Supplementary Movie(Video)
Video 9.7 MB
Supplementary material: PDF

Mäteling et al. Supplementary Movie Caption

Mäteling et al. Supplementary Movie Caption

Download Mäteling et al. Supplementary Movie Caption(PDF)
PDF 11.7 KB