1 Introduction
Manipulation checks are a valuable means of assessing the robustness of experimental results in studies based on subjects’ attention to treatments, for instance, treatment frames presented in survey experiments. In some studies, researchers may be inclined to exclude those subjects who fail the manipulation check from further analysis. This practice is common across the social sciences: we found 59 articles and 36 dissertations that we verified to have dropped subjects after a manipulation (or other posttreatment) check.Footnote 1 Articles including this practice have been published in top journals in multiple disciplines over recent years, including the American Political Science Review, the Journal of Personality and Social Psychology, Psychological Science, and the Journal of Marketing.Footnote 2 Nominally, the goal of removing subjects is to make sure that we restrict our estimates to a population of subjects who understand the experimental prompt (Wilson, Aronson, and Carlsmith Reference Wilson, Aronson, Carlsmith, Fiske, Gilbert, Lindzey and Jongsma2010, p. 66) and follow instructions diligently (Oppenheimer, Meyvis, and Davidenko Reference Oppenheimer, Meyvis and Davidenko2009). However, this practice may lead to serious bias in estimation, as dropping subjects may induce an asymmetry across treatment arms.
In this note, we show that the practice of dropping subjects based on a manipulation check should generally be avoided. We provide a number of statistical results establishing that doing so can bias estimates or undermine identification of causal effects. We also show that this practice is equivalent to inducing differential attrition across treatment arms, which may induce bias of unknown sign and magnitude.Footnote 3 We do not claim that our statistical formulations are particularly novel—they follow from well-known results about conditioning on posttreatment variables and attrition—but, given the prevalence of this practice, we believe that the relationship between these findings and practice in experimentation is underappreciated.
Our contribution is not solely negative—we provide a number of positive results. First, we reiterate the well-known result that the intent-to-treat effect is point identified: if subjects are not discarded, a well-defined causal effect can be estimated consistently. Furthermore, we show that when the result of the manipulation check does not depend on the treatment, an alternative causal quantity—the average treatment effect among those who would pass the manipulation check under all conditions—may be estimated dropping subjects. This condition can be ensured in the design of an experiment, by conditioning solely on checks that are delivered before the experimental treatment is administered. When this condition fails, we provide sharp bounds for the average treatment effect among those who would pass the manipulation check under all conditions. Taken together, our results suggest extreme caution in dropping subjects who fail a manipulation check.
In elaborating the potential pitfalls of dropping subjects who fail a manipulation check, we consider Press, Sagan, and Valentino (Reference Press, Sagan and Valentino2013)’s (henceforth PSV) survey experiment on public opinion about nuclear weapons. We provide a number of results from an augmented replication of PSV that does not drop subjects that failed the manipulation check.Footnote 4 Our findings do not contradict the primary substantive findings of PSV, but instead reinforce its claims: we find that study’s exclusion of subjects who failed the manipulation check produced weaker findings than would likely have been returned by a full sample. We then conclude with recommendations for applied practice, namely a focus on what is revealed without discarding subjects.
2 Results
Suppose we have an i.i.d. sample from
![]() $(Y,S,Z)$
, where
$(Y,S,Z)$
, where
![]() $Y$
denotes the subject’s response,
$Y$
denotes the subject’s response,
![]() $S$
denotes the result of a manipulation check (1 if the subject passed, 0 if the subject failed), and
$S$
denotes the result of a manipulation check (1 if the subject passed, 0 if the subject failed), and
![]() $Z$
denotes the subject’s treatment assignment (1 for treatment 1, 2 for treatment
$Z$
denotes the subject’s treatment assignment (1 for treatment 1, 2 for treatment
![]() $2,\ldots$
). Without loss of generality, assume that the support of
$2,\ldots$
). Without loss of generality, assume that the support of
![]() $Z$
is
$Z$
is
![]() $\{1,\ldots ,K\}$
, where
$\{1,\ldots ,K\}$
, where
![]() $K$
is finite.
$K$
is finite.
We make three assumptions to proceed. First, we assume that both potential responses and potential results from the manipulation check are stable, by invoking SUTVA (Rubin Reference Rubin1980), which implies both no interference between units and no multiple unobserved versions of the treatment.
Assumption 1 (SUTVA).
![]() $Y=\sum _{z=1}^{K}Y(z)\mathbf{I}(Z=z)$
and
$Y=\sum _{z=1}^{K}Y(z)\mathbf{I}(Z=z)$
and
![]() $S=\sum _{z=1}^{K}S(z)\mathbf{I}(Z=z)$
.
$S=\sum _{z=1}^{K}S(z)\mathbf{I}(Z=z)$
.
Second, we assume that the treatment is not systematically related to potential outcomes or potential manipulation check results, as would be ensured by random assignment of the treatment.
Assumption 2 (Ignorability).
For all
![]() $z\in \{1,\ldots ,K\}$
,
$z\in \{1,\ldots ,K\}$
, ![]() , with
, with
![]() $\Pr (Z=z)>0$
.
$\Pr (Z=z)>0$
.
Assumption 2 can be ensured at the design stage by randomizing treatment assignment across subjects.
Finally, we require that at least some subjects pass the manipulation check in both treatment and control.
Assumption 3 (Nonzero Passing Rates).
For all
![]() $z\in \{1,\ldots ,K\}$
,
$z\in \{1,\ldots ,K\}$
,
![]() $\Pr [S|Z=z]>0$
.
$\Pr [S|Z=z]>0$
.
Note that Assumption 3 is verifiable from the experimental data.
2.1 Identification
Without discarding subjects, all mean potential outcomes are well identified, and their differences are also point identified. These differences are sometimes referred to as intent-to-treat effects (Gerber and Green Reference Gerber and Green2012). As we proceed, plug-in estimators will be consistent given suitable regularity conditions (e.g., finite third moments, continuity), with the bootstrap providing a basis for asymptotic inference.
Lemma 1.
![]() $\text{E}\,[Y|Z=z]-\text{E}\,[Y|Z=z^{\prime }]=\text{E}\,[Y(z)-Y(z^{\prime })].$
$\text{E}\,[Y|Z=z]-\text{E}\,[Y|Z=z^{\prime }]=\text{E}\,[Y(z)-Y(z^{\prime })].$
A proof follows from linearity of expectations. Randomization ensures intent-to-treat effects are point identified, and can be estimated simply by examining differences in means.
In order to assess the operating characteristics of dropping subjects, we must formalize the presumed inferential target of a researcher who chooses to drop subjects based on a manipulation check. Here we consider one possible target that seems natural:
![]() $\text{E}\,[Y(z)-Y(z^{\prime })|S(1)=S(2)=\cdots =S(K)=1]$
, or the average treatment effect among subjects who would pass under all treatment conditions. This target parameter is logically equivalent to the complier average causal effect (Angrist, Imbens, and Rubin Reference Angrist, Imbens and Rubin1996) when
$\text{E}\,[Y(z)-Y(z^{\prime })|S(1)=S(2)=\cdots =S(K)=1]$
, or the average treatment effect among subjects who would pass under all treatment conditions. This target parameter is logically equivalent to the complier average causal effect (Angrist, Imbens, and Rubin Reference Angrist, Imbens and Rubin1996) when
![]() $\text{Supp}\,(Z)=\{0,1\}$
and “take-up” is considered to be
$\text{Supp}\,(Z)=\{0,1\}$
and “take-up” is considered to be
![]() $D=SZ+(1-S)(1-Z)$
. However, Angrist, Imbens, and Rubin (Reference Angrist, Imbens and Rubin1996)’s LATE Theorem, facilitating identification of the target parameter using
$D=SZ+(1-S)(1-Z)$
. However, Angrist, Imbens, and Rubin (Reference Angrist, Imbens and Rubin1996)’s LATE Theorem, facilitating identification of the target parameter using
![]() $Z$
as an instrumental variable for
$Z$
as an instrumental variable for
![]() $D$
, is unlikely to hold in this setting. The LATE Theorem requires an exclusion restriction—namely that the effect of the treatment is completely mediated through take-up (e.g., the treatment may have effects on the outcome even for subjects that fail the manipulation check). We thus recommend some caution in instrumental variable-type strategies for utilizing manipulation checks: the validity of the identifying assumptions is not directly verifiable from the experimental data nor can they generally be ensured by design.
$D$
, is unlikely to hold in this setting. The LATE Theorem requires an exclusion restriction—namely that the effect of the treatment is completely mediated through take-up (e.g., the treatment may have effects on the outcome even for subjects that fail the manipulation check). We thus recommend some caution in instrumental variable-type strategies for utilizing manipulation checks: the validity of the identifying assumptions is not directly verifiable from the experimental data nor can they generally be ensured by design.
There is a condition under which dropping subjects who fail a manipulation check recovers this quantity, namely that in which the treatment assigned to a subject is statistically unrelated to whether or not that subject passes or fails the manipulation.
Corollary 1. If
![]() $\Pr [S(1)=S(2)=\cdots =S(K)]=1$
, then
$\Pr [S(1)=S(2)=\cdots =S(K)]=1$
, then
![]() $\text{E}\,[Y|S=1,Z=z]-\text{E}\,[Y|S=1,Z=z^{\prime }]=\text{E}\,[Y(z)-Y(z^{\prime })]|S(1)=S(2)=\cdots =S(K)=1\!]$
.
$\text{E}\,[Y|S=1,Z=z]-\text{E}\,[Y|S=1,Z=z^{\prime }]=\text{E}\,[Y(z)-Y(z^{\prime })]|S(1)=S(2)=\cdots =S(K)=1\!]$
.
Corollary 1 implies sufficient conditions for discarding subjects to be unproblematic if the inferential target is the average potential outcomes among those who pass the manipulation check. In short, the treatment cannot affect whether or not a subject passes the manipulation check (e.g., if the treatment impacts subjects’ ability to pass the manipulation check itself, for instance by inducing variable degrees of stress, or even if subjects receive treatments for different lengths of time). Thus we can find cases where dropping subjects is acceptable: if a check precedes treatment (e.g., a pretreatment attention check), then discarding subjects is not a problem, at least for characterizing effects for a well-defined subpopulation of units.
Note that the condition in Corollary 1 has a testable implication.
Corollary 2. If
![]() $\Pr [S(1)=S(2)=\cdots =S(K)]=1$
, then
$\Pr [S(1)=S(2)=\cdots =S(K)]=1$
, then ![]() .
.
A proof follows directly from Assumptions 1 and 2. That is, if the treatment does not affect whether a subject passes the manipulation check, then it must be the case that passing will be unrelated to the treatment condition. Thus, if ![]() (i.e., there is an effect of
(i.e., there is an effect of
![]() $Z$
on
$Z$
on
![]() $S$
), then we know that the condition for Corollary 1 to hold (and dropping subjects to be unproblematic) must be false.
$S$
), then we know that the condition for Corollary 1 to hold (and dropping subjects to be unproblematic) must be false.
However, the converse does not generally hold. In order to justify discarding subjects, it is not sufficient to show that
![]() $Z$
and
$Z$
and
![]() $S$
are unrelated.
$S$
are unrelated.
Corollary 3.
![]() does not imply that
does not imply that
![]() $\text{E}\,[Y|S=1,Z=z]-\text{E}\,[Y|S=1,Z=z^{\prime }]=\text{E}\,[Y(z)-Y(z^{\prime })|S(1)=S(2)=\cdots =S(K)=1]$
.
$\text{E}\,[Y|S=1,Z=z]-\text{E}\,[Y|S=1,Z=z^{\prime }]=\text{E}\,[Y(z)-Y(z^{\prime })|S(1)=S(2)=\cdots =S(K)=1]$
.
Corollary 3 reinforces an important point: even if the failure rates are identical across treatments, conditioning on a manipulation check may still induce bias. This is because the types of subjects who fail the manipulation check under one treatment may not be the same as those who fail under a different treatment.
To this end, potential outcomes among those who would pass regardless of condition are not generally point identified. In a generalization of Lee (Reference Lee2009) (which imposes a monotonicity assumption) and Zhang and Rubin (Reference Zhang and Rubin2003), we derive sharp bounds on potential outcome means
![]() $\text{E}\,[Y(z)|S(1)=1,S(2)=1,\ldots ,S(K)=1]$
.Footnote
5
$\text{E}\,[Y(z)|S(1)=1,S(2)=1,\ldots ,S(K)=1]$
.Footnote
5
Proposition 1. Suppose that
![]() $\Pr [S(1)=S(2)=\cdots =S(K)=1]>0$
and that
$\Pr [S(1)=S(2)=\cdots =S(K)=1]>0$
and that
![]() $Y$
is continuous with unbounded support. Let
$Y$
is continuous with unbounded support. Let
![]() $Q_{Y|Z=z,S=1}(.)$
denote the conditional quantile function of
$Q_{Y|Z=z,S=1}(.)$
denote the conditional quantile function of
![]() $Y$
given
$Y$
given
![]() $Z=z$
and
$Z=z$
and
![]() $S=1$
. Then, sharp bounds for
$S=1$
. Then, sharp bounds for
![]() $\text{E}\,[Y(z)|S(1)=S(2)=\cdots =S(K)=1]$
are given by
$\text{E}\,[Y(z)|S(1)=S(2)=\cdots =S(K)=1]$
are given by
 $$\begin{eqnarray}\displaystyle & & \displaystyle \text{E}\,\left[Y|Y\leqslant Q_{Y|Z=z,S=1}\left(1-\mathop{\sum }_{z^{\prime }\in \{1,\ldots ,K\}:z^{\prime }\neq z}\frac{\Pr [S=0|Z=z^{\prime }]}{\Pr [S=1|Z=z]}\right),Z=z\right]\nonumber\\ \displaystyle & & \displaystyle \qquad \leqslant \text{E}\,[Y(z)|S(1)=S(2)=\cdots =S(K)=1]\leqslant \nonumber\\ \displaystyle & & \displaystyle \text{E}\,\left[Y|Y\geqslant Q_{Y|Z=z,S=1}\left(\mathop{\sum }_{z^{\prime }\in \{1,\ldots ,K\}:z^{\prime }\neq z}\frac{\Pr [S=0|Z=z^{\prime }]}{\Pr [S=1|Z=z]}\right),Z=z\right]\nonumber\end{eqnarray}$$
when
![]() $\sum _{z^{\prime }\in \{1,\ldots ,K\}:z^{\prime }\neq z}\frac{\Pr [S=0|Z=z^{\prime }]}{\Pr [S=1|Z=z]}<1$
, else these bounds are given by
$\sum _{z^{\prime }\in \{1,\ldots ,K\}:z^{\prime }\neq z}\frac{\Pr [S=0|Z=z^{\prime }]}{\Pr [S=1|Z=z]}<1$
, else these bounds are given by
![]() $-\infty \leqslant \text{E}\,[Y(z)|S(1)=S(2)=\cdots =S(K)=1]\leqslant \infty$
.
$-\infty \leqslant \text{E}\,[Y(z)|S(1)=S(2)=\cdots =S(K)=1]\leqslant \infty$
.
Assuming that
![]() $\Pr [S(1)=S(2)=\cdots =S(K)=1]>0$
ensures that
$\Pr [S(1)=S(2)=\cdots =S(K)=1]>0$
ensures that
![]() $\text{E}\,[Y(z)|S(1)=S(2)=\cdots =S(K)=1]$
exists and continuity of
$\text{E}\,[Y(z)|S(1)=S(2)=\cdots =S(K)=1]$
exists and continuity of
![]() $Y$
ensures that the quantile function is well defined. As with Lee (Reference Lee2009)’s bounds, even when
$Y$
ensures that the quantile function is well defined. As with Lee (Reference Lee2009)’s bounds, even when
![]() $Y$
is discrete, then bounds can be constructed simply by trimming the observations associated with the upper or lower
$Y$
is discrete, then bounds can be constructed simply by trimming the observations associated with the upper or lower
![]() $\sum _{z^{\prime }\in \{1,\ldots ,K\}:z^{\prime }\neq z}\frac{\Pr [S=0|Z=z^{\prime }]}{\Pr [S=1|Z=z]}$
th proportions of the empirical distributions of subjects who pass the manipulation check under treatment and control. With weighted data, this entails using the weighted empirical distribution function. Note that our bounds provide information about the potential for bias introduced by dropping subjects. Differences between the asymptotic value of an estimator computed after dropping subjects and the bounds for
$\sum _{z^{\prime }\in \{1,\ldots ,K\}:z^{\prime }\neq z}\frac{\Pr [S=0|Z=z^{\prime }]}{\Pr [S=1|Z=z]}$
th proportions of the empirical distributions of subjects who pass the manipulation check under treatment and control. With weighted data, this entails using the weighted empirical distribution function. Note that our bounds provide information about the potential for bias introduced by dropping subjects. Differences between the asymptotic value of an estimator computed after dropping subjects and the bounds for
![]() $\text{E}\,[Y(z)|S(1)=S(2)=\cdots =S(K)=1]$
provide a range of potential values for asymptotic bias.
$\text{E}\,[Y(z)|S(1)=S(2)=\cdots =S(K)=1]$
provide a range of potential values for asymptotic bias.
2.2 Simulations
In Appendix C, we provide full details and results of a set of simulations to evaluate the properties of the difference-in-means estimator after dropping subjects and of the proposed bounds. We summarize our setup and conclusions here. We assume a treatment
![]() $Z$
with
$Z$
with
![]() $\text{Supp}\,(Z)=\{1,2\}$
and
$\text{Supp}\,(Z)=\{1,2\}$
and
![]() $\Pr (Z=1)=1/2$
. We generated potential outcomes
$\Pr (Z=1)=1/2$
. We generated potential outcomes
![]() $Y(1)=Y(2)=\unicode[STIX]{x1D706}[S(2)-S(1)]+N(0,\unicode[STIX]{x1D70E})$
, and vary
$Y(1)=Y(2)=\unicode[STIX]{x1D706}[S(2)-S(1)]+N(0,\unicode[STIX]{x1D70E})$
, and vary
![]() $\unicode[STIX]{x1D706}$
,
$\unicode[STIX]{x1D706}$
,
![]() $\unicode[STIX]{x1D70E}$
, and the joint distribution of
$\unicode[STIX]{x1D70E}$
, and the joint distribution of
![]() $(S(1),S(2))$
. In short, we show, all else equal, that bias tends to increase as the average potential outcomes of subjects who would pass the control manipulation check diverge from those who would pass the treatment manipulation check and as failure rates increase. We further show that the width of the bounds increases as failure rates increase, but also as the variability of potential responses increases. Our results shed light on the conditions under which dropping subjects is most problematic, both in terms of the bias introduced and in terms of the fundamental uncertainty about the target parameter.
$(S(1),S(2))$
. In short, we show, all else equal, that bias tends to increase as the average potential outcomes of subjects who would pass the control manipulation check diverge from those who would pass the treatment manipulation check and as failure rates increase. We further show that the width of the bounds increases as failure rates increase, but also as the variability of potential responses increases. Our results shed light on the conditions under which dropping subjects is most problematic, both in terms of the bias introduced and in terms of the fundamental uncertainty about the target parameter.
2.3 Using Covariates for Diagnostics
Suppose that we had a vector of covariates
![]() $\mathbf{X}$
associated with each unit, so that we now have an i.i.d. sample from
$\mathbf{X}$
associated with each unit, so that we now have an i.i.d. sample from
![]() $(Y,S,Z,\mathbf{X})$
. We can now write an assumption analogous to Assumption 2.
$(Y,S,Z,\mathbf{X})$
. We can now write an assumption analogous to Assumption 2.
Assumption 4 (Ignorability with Covariates).
For all
![]() $z\in \{1,\ldots ,K\}$
,
$z\in \{1,\ldots ,K\}$
, ![]() , with
, with
![]() $\Pr (Z=z)>0$
.
$\Pr (Z=z)>0$
.
Note that if
![]() $Z$
is randomized and
$Z$
is randomized and
![]() $\mathbf{X}$
is measured prior to administration of the treatment, then Assumption 4 holds by construction. However, if
$\mathbf{X}$
is measured prior to administration of the treatment, then Assumption 4 holds by construction. However, if
![]() $\mathbf{X}$
is measured posttreatment and
$\mathbf{X}$
is measured posttreatment and
![]() $\mathbf{Z}$
has causal effects on
$\mathbf{Z}$
has causal effects on
![]() $\mathbf{X}$
, then Assumption 4 may be violated.
$\mathbf{X}$
, then Assumption 4 may be violated.
These covariates can shed light on the plausibility of the condition for Corollary 1,
![]() $\Pr [S(1)=S(2)=\cdots =S(K)]=1$
.
$\Pr [S(1)=S(2)=\cdots =S(K)]=1$
.
Corollary 4. If
![]() $\Pr [S(1)=S(2)=\cdots =S(K)]=1$
, then
$\Pr [S(1)=S(2)=\cdots =S(K)]=1$
, then ![]() .
.
A proof directly follows from Assumptions 1 and 4. One practical implication is that the plausibility of the conditions for Corollary 1 can be verified using a balance test. That is, if ![]() , then it must be the case that
, then it must be the case that
![]() $\Pr [S(1)=S(2)=\cdots =S(K)]\neq 1$
.
$\Pr [S(1)=S(2)=\cdots =S(K)]\neq 1$
.
Again, however, the converse does not hold. In order to justify discarding subjects, it is not sufficient to have balance on the observed covariates.
Corollary 5.
![]() does not imply that
does not imply that
![]() $\text{E}\,[Y|S=1,Z=z,\mathbf{X}=\mathbf{x}]-\text{E}\,[Y|S=1,Z=z^{\prime },\mathbf{X}=\mathbf{x}]=\text{E}\,[Y(z)-Y(z^{\prime })|S(1)=S(2)=\cdots =S(K)=1,\mathbf{X}=\mathbf{x}]$
.
$\text{E}\,[Y|S=1,Z=z,\mathbf{X}=\mathbf{x}]-\text{E}\,[Y|S=1,Z=z^{\prime },\mathbf{X}=\mathbf{x}]=\text{E}\,[Y(z)-Y(z^{\prime })|S(1)=S(2)=\cdots =S(K)=1,\mathbf{X}=\mathbf{x}]$
.
A proof directly follows from that of Corollary 3. So while covariates can help in testing a particular identification condition that justifies dropping subjects, failure to reject the null hypothesis of ![]() (or even accepting said null hypothesis) need not imply that dropping subjects is unproblematic.
(or even accepting said null hypothesis) need not imply that dropping subjects is unproblematic.
Note that when Assumption 4 holds, tighter bounds can be obtained than those of Proposition 1. Derivation of these bounds goes outside the scope of the current manuscript, but we note that with even one continuous variable in
![]() $\mathbf{X}$
, nonparametric estimation of these bounds will likely be practically difficult, requiring estimation of an infinite-dimensional function.
$\mathbf{X}$
, nonparametric estimation of these bounds will likely be practically difficult, requiring estimation of an infinite-dimensional function.
2.4 Summary of Results
Taken together, our results establish the following: (i) Intent-to-treat effects are point identified. (ii) Potential outcomes among those who would pass a manipulation check under all conditions are not generally point identified. (iii) Sharp bounds for potential outcomes among those who would pass a manipulation check under all conditions may not have finite width. (iv) Showing that equal proportions of subjects failed the manipulation check across all conditions is not sufficient to justify dropping subjects, because the types of subjects that comprise those groups may differ between treatments. (v) If a check precedes treatment (e.g., a pretreatment attention check), or if its result is otherwise unrelated to treatment assignment, dropping subjects who fail such a check does not lead to bias in estimation of outcomes for those who would pass the manipulation check under all treatment conditions. (vi) As passing rates decrease, the risk of bias from dropping subjects increases, and the width of the bounds grows accordingly. (vii) Covariates may provide information about the consequences of dropping subjects, though their informative power is limited.
3 Application
We now discuss these findings in the context of PSV, which presents a survey conducted using a representative sample of voting-age American citizens. PSV reports on whether public opinion regarding nuclear weapons use is shaped primarily by ethical or strategic considerations. PSV’s five treatment conditions detail a scenario in which an Al Qaeda nuclear weapons lab in Syria obtains weapons-grade uranium intended for offensive use against the United States. We focus on three of the treatments, which manipulate the relative expected effectiveness of a nuclear or conventional strike on the Al Qaeda facility. The treatments describe the effectiveness ratios of nuclear/conventional weapons at 90 percent/90 percent, 90 percent/70 percent, and 90 percent/45 percent, respectively (henceforth referred to as 90–90, 90–70, and 90–45). As demonstrated in Panel A of Figure 1, PSV reports a strongly monotonic increase in subjects’ approval of and preference for nuclear weapons use as nuclear weapons’ effectiveness increases relative to that of conventional weapons.
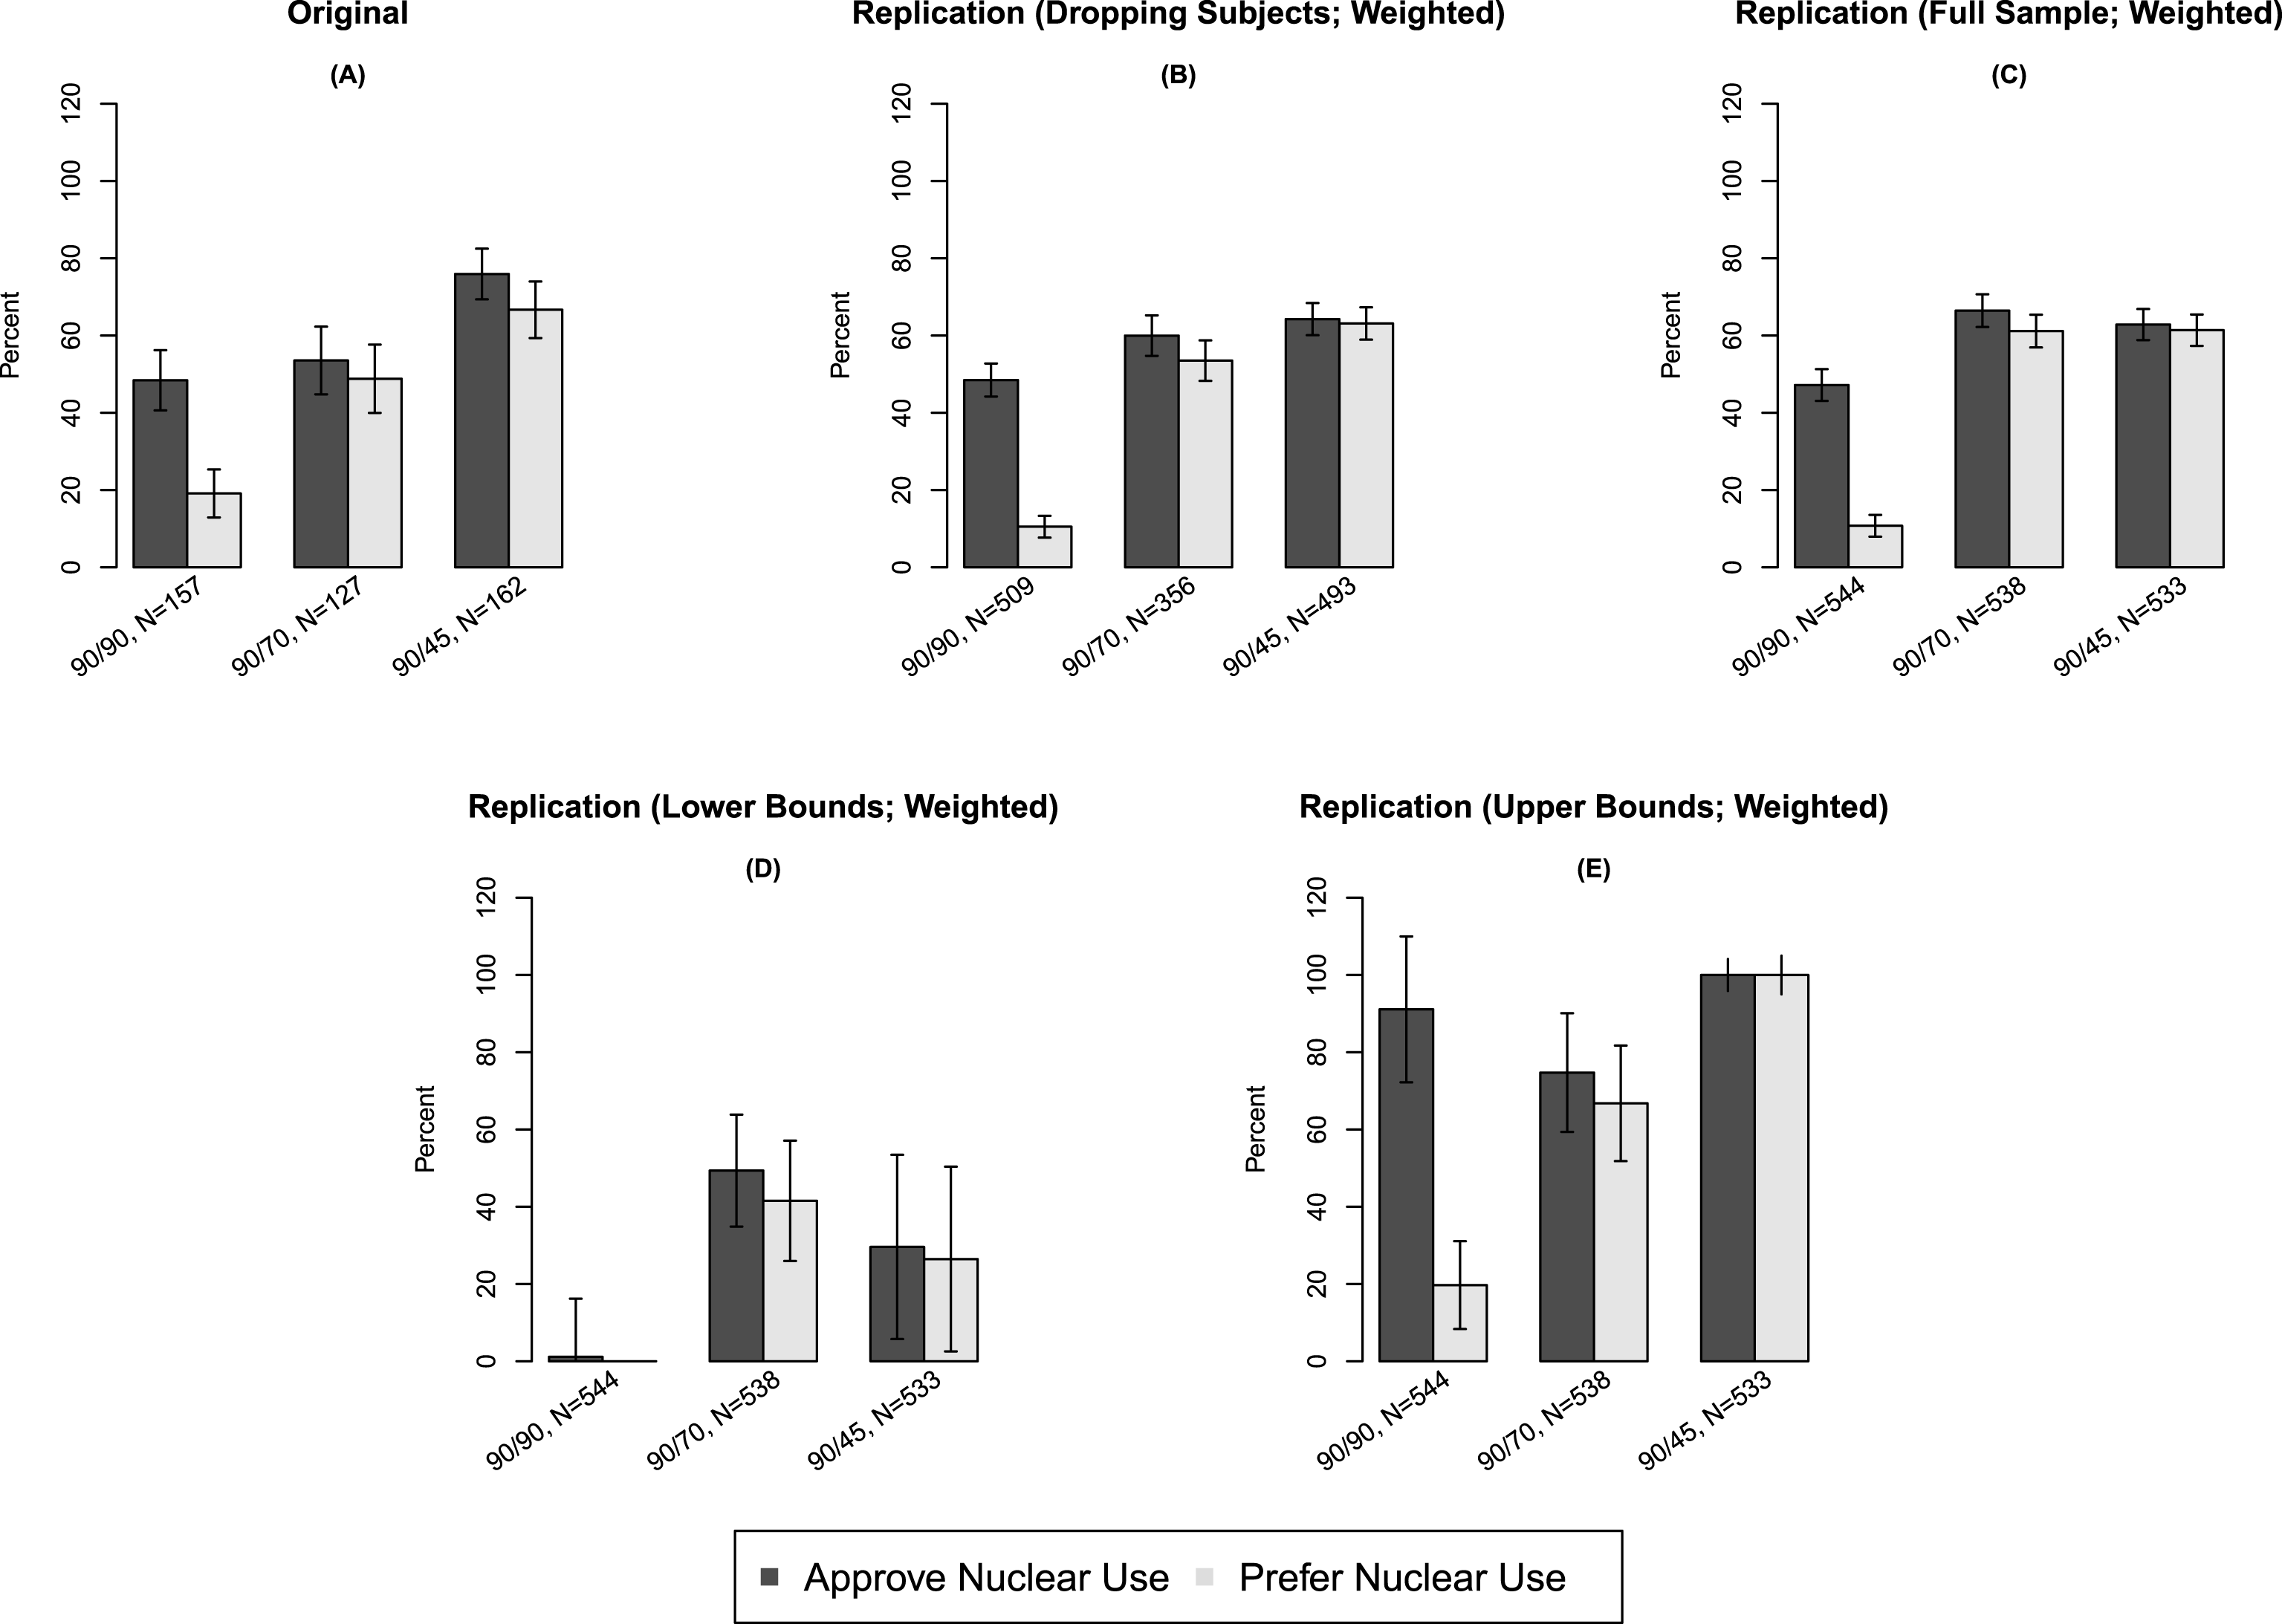
Figure 1. Results from Press, Sagan, and Valentino (2013) and Replication. Comparisons of original and weighted replication data. Panel A presents results from PSV with subjects dropped; Panel B presents results from the replication with subjects dropped; Panel C presents results from the replication using the full sample; Panel D presents results imputing the lower bounds for all treatment conditions; Panel E presents results imputing the upper bounds for all treatment conditions. Vertical bars represent 95% confidence intervals on point estimates calculated using the bootstrap.
However, we will show that this finding—namely a strong monotonic increase—is partly attributable to dropping subjects, and that, without dropping subjects, even stronger results are obtained. PSV utilized a manipulation check following the treatment as a means of gauging subjects’ attention to the treatment articles; subjects who fail the manipulation check are dropped from the analysis. This check asked subjects to choose from five options including whether the treatment they had received had concluded that nuclear weapons would be equally effective, moderately more effective, or much more effective than conventional weapons; these answers were intended to correspond to the 90–90, 90–70, and 90–45 comparisons, respectively. Subjects who failed the manipulation check were given an opportunity to read the article a second time, but their responses were dropped due to failure.
We conducted a successful replication of PSV, showing that the primary findings of the study are robust, including robustness to treatment variations not considered in the original article (details are provided in Appendix B). One notable variation in our replication was that subjects were not informed of whether they had passed or failed the manipulation check, and data were collected regardless, allowing us to assess the consequences of dropping subjects. Our study used 2,733 subjects recruited from Amazon.com Mechanical Turk.Footnote 6 Note that there is a good body of evidence to suggest that subjects on Mechanical Turk tend to be more attentive than other (representative) samples (Hauser and Schwarz Reference Hauser and Schwarz2016), and thus it is possible that our passing rates are higher than those of PSV. If so, then all else equal, the bias in our estimates after dropping subjects would be smaller, and the width of our bounds would also be smaller than the bounds that would be associated with the original data.
Subjects were compensated at $.50 each, with the added chance of winning a $100 bonus if they passed the manipulation check. For our primary analysis, we used inverse probability weighting (IPW) to adjust the replication sample to match the covariate distribution of the sample used in PSV, and computed estimates after weighting.Footnote 7 We then performed our analysis both including and excluding subjects who failed the manipulation check.
The primary results of our replication are presented in Panels B and C of Figure 1. (Unweighted analyses are presented in Figure 2.) PSV argues that a clear majority of subjects both approve of and prefer a prospective nuclear strike in only 90–45. However, we show that these findings are actually attenuated as a consequence of dropping the subjects who failed from the analysis. Panel C demonstrates that including data from all subjects, regardless of performance on the manipulation check, alters results substantially, rendering estimates in 90–70 and 90–45 practically indistinguishable. The discrepancy is notable in its substantive importance for the results of PSV: subjects dropped from the analysis actually perceived a “moderate” decline in conventional weapons’ relative effectiveness to be a “significant” decrease; including such subjects in the analysis provides even stronger evidence against a nuclear-nonuse norm than PSV depicts.
The replication also illustrates the importance of Corollary 3: showing the equivalence between failure rates under two conditions does not imply that the types of individuals who fail are equivalent. Treatments 1 and 3 have statistically and substantively indistinguishable failure rates (6.4% vs. 7.5%), and yet the covariate profiles of those who failed the manipulation check are strikingly different, as can be seen in Table 2 in Appendix D. For example, 63.7% of subjects who fail the manipulation check under Treatment 3 are female, but only 24.9% of the subjects who fail the manipulation check under Treatment 1 are female. Similar differences are found in political party, religious importance, region, and racial composition.
We also report sharp bounds for the average potential outcomes among subjects who would pass the manipulation check regardless of treatment assignment. We are unable to calculate analogous bounds using the PSV data, because no information was available on the proportion of subjects who were dropped. Panel D depicts our results imputing the lower bound, whereas Panel E shows our estimates imputing the upper bound. We observe that the bounds for all treatment conditions have overlapping regions, in both outcome variables, making it impossible to fully differentiate results across the treatments. The bounds are largely uninformative, suggesting the fundamental uncertainty induced by attempting to estimate effects among the subpopulation of subjects who would always pass the manipulation check. If these effects are indeed the inferential target of the researcher, very little is revealed by the experimental data, and dropping subjects may introduce serious bias of unknown sign and magnitude (as any values within the range of the bounds are compatible with the experimental data).
4 Conclusion
We reiterate that our critiques do not apply to research designs that use pretreatment attention checks to screen subjects, as established by Corollary 3. Attention checks placed before treatment can be used to prune subjects from final analysis in a principled manner. Although screening changes the inferential target from the whole population to a subpopulation of subjects who are paying sufficient attention and have the ability to pass the attention check, it does not compromise internal validity. The use of manipulation checks in the pilot stage can provide information for improving the interpretability of treatments and manipulation checks to maximize passing rates in the manipulation. The use of pretreatment checks and piloting may also improve estimates by focusing only on the subpopulation of subjects who are able to pass and do so. Of course, there is significant debate about best practices here (see, e.g., Peer, Vosgerau, and Acquisti Reference Peer, Vosgerau and Acquisti2014). As such, we recommend Oppenheimer, Meyvis, and Davidenko (Reference Oppenheimer, Meyvis and Davidenko2009)’s suggestions for compelling experimental subjects to participate more diligently; as well as Berinsky, Margolis, and Sances (Reference Berinsky, Margolis and Sances2014)’s analysis of the benefits and drawbacks of screening, and recommendations for practice. Oppenheimer, Meyvis, and Davidenko (Reference Oppenheimer, Meyvis and Davidenko2009) finds that forcing inattentive subjects to repeat Instructional Manipulation Checks (IMCs) until the subjects read the checks thoroughly homogenizes the subject group. We recognize the potential benefits of this approach when performed prior to treatment, but we caution against the use of posttreatment IMCs as a statistical conditioning strategy. Berinsky, Margolis, and Sances (Reference Berinsky, Margolis and Sances2014)’s suggested use of screens to assess subjects’ attention on a continuum also represents a transparent approach to presenting findings by showing the results conditional on each value of attention. However, doing so with a posttreatment check would again introduce the issues discussed here.
In general, we stress the importance of manipulations that are sufficiently clear so as to minimize the necessity to remove subjects based on a lack of comprehension. Although we have proposed bounds for causal effects among the subjects who would always pass the manipulation check, these bounds will be uninformative in practice when failure rates are high. Pilot studies may help to ensure that the treatments are understood by subjects as the researchers intended, with the caveat that the pilot population may be unrepresentative of the final test population. We underline that best practice should maintain a focus on intent-to-treat effects, which are generally point identified and have a clear substantive interpretation. The credibility of the experiment ultimately rests on the quality of the manipulation, rather than post hoc statistical adjustments. As a means of validation, manipulation checks can help researchers to understand whether or not this criterion has been met. But dropping subjects who fail a manipulation check presented after the intervention may introduce biases of unknown sign and magnitude.
Supplementary material
For supplementary material accompanying this paper, please visit https://doi.org/10.1017/pan.2019.5.
Appendix A. Proofs
Proof of Corollary 1.
![]() $\Pr [S(1)=S(2)=\cdots =S(K)]=1$
implies
$\Pr [S(1)=S(2)=\cdots =S(K)]=1$
implies
![]() $S=S(1)=S(2)=\cdots =S(K)$
, thus ensuring
$S=S(1)=S(2)=\cdots =S(K)$
, thus ensuring ![]() . Joint independence implies that
. Joint independence implies that
![]() $\text{E}\,[Y(z)|S=1,Z=z]-\text{E}\,[Y(z^{\prime })|S=1,Z=z^{\prime }]=\text{E}\,[Y(z)|S(1)=1,S(2)=1,\ldots ,S(K)=1]-\text{E}\,[Y(z^{\prime })|S=1]$
.
$\text{E}\,[Y(z)|S=1,Z=z]-\text{E}\,[Y(z^{\prime })|S=1,Z=z^{\prime }]=\text{E}\,[Y(z)|S(1)=1,S(2)=1,\ldots ,S(K)=1]-\text{E}\,[Y(z^{\prime })|S=1]$
.
Proof of Corollary 3.
We prove the claim via a simple counterexample. Suppose
![]() $\text{Supp}\,(Z)=\{1,2\}$
and
$\text{Supp}\,(Z)=\{1,2\}$
and
 $$\begin{eqnarray}\displaystyle f(Y(1),Y(2),S(1),S(2))=\left\{\begin{array}{@{}l@{}}1/3:Y(1)=1,Y(2)=1,S(1)=0,S(2)=1\\ 1/3:Y(1)=0,Y(2)=0,S(1)=1,S(2)=0\\ 1/3:Y(1)=0,Y(2)=0,S(1)=1,S(2)=1\\ 0:\text{otherwise}.\end{array}\right. & & \displaystyle \nonumber\end{eqnarray}$$
Note that
![]() $\text{E}\,[S(2)-S(1)]=0$
and
$\text{E}\,[S(2)-S(1)]=0$
and
![]() $\text{E}\,[\unicode[STIX]{x1D70F}|S(1)=S(2)=1]=\text{E}\,[\unicode[STIX]{x1D70F}|S(1)=1,S(2)=0]=\text{E}\,[\unicode[STIX]{x1D70F}|S(1)=0,S(2)=1]=0$
.
$\text{E}\,[\unicode[STIX]{x1D70F}|S(1)=S(2)=1]=\text{E}\,[\unicode[STIX]{x1D70F}|S(1)=1,S(2)=0]=\text{E}\,[\unicode[STIX]{x1D70F}|S(1)=0,S(2)=1]=0$
.
![]() $\text{E}\,[Y|S=1,Z=2]-\text{E}\,[Y|S=1,Z=1]=0-1/2=-1/2.$
$\text{E}\,[Y|S=1,Z=2]-\text{E}\,[Y|S=1,Z=1]=0-1/2=-1/2.$
Proof of Proposition 1.
We will follow the general logic of Lee (Reference Lee2009), and technical details carry through from the proof of Lee’s Proposition 1a. Without loss of generality, we consider the upper bound for
![]() $\text{E}\,[Y(1)|S(1)=S(2)=\cdots =S(K)=1]$
.
$\text{E}\,[Y(1)|S(1)=S(2)=\cdots =S(K)=1]$
.
Define
![]() $U=1$
if
$U=1$
if
![]() $S(2)=\cdots =S(K)=1$
, else let
$S(2)=\cdots =S(K)=1$
, else let
![]() $U=0$
. Then
$U=0$
. Then
![]() $\text{E}\,[Y(1)|S(1)=S(2)=\cdots =S(K)=1]=\text{E}\,[Y(1)|U=1,S(1)=1]$
. We do not observe the joint distribution of
$\text{E}\,[Y(1)|S(1)=S(2)=\cdots =S(K)=1]=\text{E}\,[Y(1)|U=1,S(1)=1]$
. We do not observe the joint distribution of
![]() $(Y(1),U)|S(1)=1$
, as we never jointly observe
$(Y(1),U)|S(1)=1$
, as we never jointly observe
![]() $Y(z)$
and
$Y(z)$
and
![]() $S(z^{\prime })$
, for
$S(z^{\prime })$
, for
![]() $z\neq z^{\prime }$
. Let
$z\neq z^{\prime }$
. Let
![]() $p_{U^{0}}=\Pr [U=0|S(1)=1]$
. Given continuity of
$p_{U^{0}}=\Pr [U=0|S(1)=1]$
. Given continuity of
![]() $Y(1)$
, then among all possible joint distributions
$Y(1)$
, then among all possible joint distributions
![]() $(Y(1),U)|S(1)=1$
,
$(Y(1),U)|S(1)=1$
,
![]() $\text{E}\,[Y(1)|U=1,S(1)=1]$
is maximized when
$\text{E}\,[Y(1)|U=1,S(1)=1]$
is maximized when
![]() $U=1$
for all
$U=1$
for all
![]() $Y(1)\geqslant Q_{Y(1)}(p_{U^{0}})$
. By weak monotonicity of the quantile function, it suffices to maximize
$Y(1)\geqslant Q_{Y(1)}(p_{U^{0}})$
. By weak monotonicity of the quantile function, it suffices to maximize
![]() $p_{U^{0}}$
to find a maximum for
$p_{U^{0}}$
to find a maximum for
![]() $\text{E}\,[Y(1)|U=1,S(1)=1]$
.
$\text{E}\,[Y(1)|U=1,S(1)=1]$
.
We again do not observe the joint distribution
![]() $(U,S(1))$
. By
$(U,S(1))$
. By
![]() $\unicode[STIX]{x1D70E}$
-additivity, a sharp upper bound is obtained for
$\unicode[STIX]{x1D70E}$
-additivity, a sharp upper bound is obtained for
![]() $\Pr [U=0]$
is obtained when the regions where
$\Pr [U=0]$
is obtained when the regions where
![]() $S(2),S(3),\ldots ,S(K)$
each equal zero are disjoint, with
$S(2),S(3),\ldots ,S(K)$
each equal zero are disjoint, with
 $$\begin{eqnarray}\Pr [U=0]\leqslant \left\{\begin{array}{@{}lr@{}}\displaystyle \mathop{\sum }_{k=2}^{K}\Pr [S(k)=0] & :\mathop{\sum }_{k=2}^{K}\Pr [S(k)=0]<1\\ 1 & :\displaystyle \mathop{\sum }_{k=2}^{K}\Pr [S(k)=0]\geqslant 1.\end{array}\right.\end{eqnarray}$$
Thus, among all possible joint distributions
![]() $(U,S(1))$
,
$(U,S(1))$
,
![]() $\Pr [U=0|S(1)=1]=p_{U^{0}}$
is maximized when
$\Pr [U=0|S(1)=1]=p_{U^{0}}$
is maximized when
 $$\begin{eqnarray}p_{U^{0}}=\left\{\begin{array}{@{}lr@{}}\displaystyle \frac{\mathop{\sum }_{k=2}^{K}\Pr [S(k)=0]}{\Pr [S(1)=1]} & :\displaystyle \frac{\mathop{\sum }_{k=2}^{K}\Pr [S(k)=0]}{\Pr [S(1)=1]}<1\\ 1 & :\displaystyle \frac{\mathop{\sum }_{k=2}^{K}\Pr [S(k)=0]}{\Pr [S(1)=1]}\geqslant 1.\end{array}\right.\end{eqnarray}$$
Thus if
![]() $\frac{\sum _{k=2}^{K}\Pr [S(k)=0]}{\Pr [S(1)=1]}<1$
, a sharp upper bound is given by
$\frac{\sum _{k=2}^{K}\Pr [S(k)=0]}{\Pr [S(1)=1]}<1$
, a sharp upper bound is given by
![]() $\text{E}\,[Y(1)|U=1,S(1)=1]\leqslant \text{E}\,[Y(1)|Y(1)\leqslant Q_{Y(1)|S(1)=1}(1-\sum _{k=2}^{K}\frac{\Pr [S(k)=0]}{\Pr [S(1)=1]})]$
, else the upper bound is infinite.
$\text{E}\,[Y(1)|U=1,S(1)=1]\leqslant \text{E}\,[Y(1)|Y(1)\leqslant Q_{Y(1)|S(1)=1}(1-\sum _{k=2}^{K}\frac{\Pr [S(k)=0]}{\Pr [S(1)=1]})]$
, else the upper bound is infinite.
By random assignment and SUTVA, the conditional distribution of
![]() $Y(1)|S(1)=1$
is equivalent to the conditional distribution of
$Y(1)|S(1)=1$
is equivalent to the conditional distribution of
![]() $Y|S=1,Z=1$
, and the marginal distributions of
$Y|S=1,Z=1$
, and the marginal distributions of
![]() $S(k)$
are each equivalent to
$S(k)$
are each equivalent to
![]() $S|Z=k$
. Thus a sharp upper bound is given by
$S|Z=k$
. Thus a sharp upper bound is given by
![]() $\text{E}\,[Y(1)|U=1,S(1)=1]\leqslant \text{E}\,[Y|Y\geqslant Q_{Y|Z=1,S=1}(\sum _{k=2}^{K}\frac{\Pr [S=0|Z=k]}{\Pr [S=1|Z=k]}),Z=1]$
when
$\text{E}\,[Y(1)|U=1,S(1)=1]\leqslant \text{E}\,[Y|Y\geqslant Q_{Y|Z=1,S=1}(\sum _{k=2}^{K}\frac{\Pr [S=0|Z=k]}{\Pr [S=1|Z=k]}),Z=1]$
when
![]() $\sum _{k=2}^{K}\frac{\Pr [S=0|Z=k]}{\Pr [S=1|Z=k]}<1$
, else the upper bound is infinite. The bounds are invariant to indexing of treatments
$\sum _{k=2}^{K}\frac{\Pr [S=0|Z=k]}{\Pr [S=1|Z=k]}<1$
, else the upper bound is infinite. The bounds are invariant to indexing of treatments
![]() $Z$
, thus yielding the general upper bound in Proposition 1. Analogous calculations yield lower bounds.
$Z$
, thus yielding the general upper bound in Proposition 1. Analogous calculations yield lower bounds.
Appendix B. Details of Replication of Press, Sagan, and Valentino (2013)
Our replication and preanalysis plan are hosted at EGAP (ID: 20150131AA). Our replication included three major variations, the analysis of which underlines the robustness of PSV. We list these analyses in turn below.
First, because the original experiment was performed prior to the onset of the Syrian civil war, we sought to assess whether the results were invariant to shifts in time and context (i.e., whether the results might differ in our replication, given the political changes that have occurred in Syria). We thus randomized whether treatment frames presented the scenario in Syria or Lebanon, which was used as an analog to pre-civil-war Syria; treatments were assigned through a
![]() $2\times 5$
factorial design. We found no statistically or substantively significant difference between Syria and Lebanon treatment frames, demonstrating that the results presented in PSV are robust to these temporal and contextual changes.
$2\times 5$
factorial design. We found no statistically or substantively significant difference between Syria and Lebanon treatment frames, demonstrating that the results presented in PSV are robust to these temporal and contextual changes.
Second, we analyzed whether the PSV study’s use of posttreatment covariates introduced bias. We added another treatment (rendering our augmented replication a
![]() $2\times 2\times 5$
factorial design) that randomized whether subjects answered these questions before or after treatment. This analysis failed to reveal any statistically or substantively significant results.
$2\times 2\times 5$
factorial design) that randomized whether subjects answered these questions before or after treatment. This analysis failed to reveal any statistically or substantively significant results.
Third, as noted above, we performed weighting on our survey sample to approximate the experimental population used by PSV. Our subjects were recruited from Mechanical Turk, and likely constituted an unrepresentative sample. As noted in the main text, we used logistic regression and IPW to assign treatment probabilities and corresponding weights for each subject. We did observe differences between the weighted and unweighted analyses, but neither undermined the substantive findings of PSV.
Appendix C. Simulations
We assume a treatment
![]() $Z$
with
$Z$
with
![]() $\text{Supp}\,(Z)=\{1,2\}$
and
$\text{Supp}\,(Z)=\{1,2\}$
and
![]() $\Pr (Z=1)=1/2$
. We generated potential outcomes
$\Pr (Z=1)=1/2$
. We generated potential outcomes
![]() $Y(1)=Y(2)=\unicode[STIX]{x1D706}[S(2)-S(1)]+N(0,\unicode[STIX]{x1D70E})$
, and vary
$Y(1)=Y(2)=\unicode[STIX]{x1D706}[S(2)-S(1)]+N(0,\unicode[STIX]{x1D70E})$
, and vary
![]() $\unicode[STIX]{x1D706}$
,
$\unicode[STIX]{x1D706}$
,
![]() $\unicode[STIX]{x1D70E}$
, and the joint distribution of
$\unicode[STIX]{x1D70E}$
, and the joint distribution of
![]() $(S(1),S(2))$
. Note that in the simulation, we have assumed that there is no effect of the treatment whatsoever, and the results would be invariant to the introduction of any constant treatment effect.
$(S(1),S(2))$
. Note that in the simulation, we have assumed that there is no effect of the treatment whatsoever, and the results would be invariant to the introduction of any constant treatment effect.
![]() $\unicode[STIX]{x1D706}$
represents the divergence in potential outcomes between those who would pass and those who would fail the manipulation check and
$\unicode[STIX]{x1D706}$
represents the divergence in potential outcomes between those who would pass and those who would fail the manipulation check and
![]() $\unicode[STIX]{x1D70E}$
represents the unexplained variability of potential outcomes. To put our results in asymptopia, we assume
$\unicode[STIX]{x1D70E}$
represents the unexplained variability of potential outcomes. To put our results in asymptopia, we assume
![]() $N=1,000$
, and perform
$N=1,000$
, and perform
![]() $100,000$
simulations.
$100,000$
simulations.
Table 1 presents the results of our simulations. We first discuss the bias of the difference-in-means estimator after dropping subjects. We show that bias tends to increase as
![]() $\unicode[STIX]{x1D706}$
—the divergence between the average potential outcomes of subjects who would pass the control manipulation check and that of those who would pass the treatment manipulation check—increases. See, e.g., row 1 vs. 2. As failure rates increase, not necessarily differentially across treatment arms, we also see that bias increases; compare rows 1–4 to 5–8 to 9–12. Furthermore, as
$\unicode[STIX]{x1D706}$
—the divergence between the average potential outcomes of subjects who would pass the control manipulation check and that of those who would pass the treatment manipulation check—increases. See, e.g., row 1 vs. 2. As failure rates increase, not necessarily differentially across treatment arms, we also see that bias increases; compare rows 1–4 to 5–8 to 9–12. Furthermore, as
![]() $\unicode[STIX]{x1D70C}(S(1),S(2))$
—the correlation between potential responses to the manipulation check—decreases, bias also increases, as evidenced by, e.g., row 4 vs. row 1.
$\unicode[STIX]{x1D70C}(S(1),S(2))$
—the correlation between potential responses to the manipulation check—decreases, bias also increases, as evidenced by, e.g., row 4 vs. row 1.
The width of the bounds also depends on multiple factors. As the variability of potential outcomes increases (characterized by
![]() $\unicode[STIX]{x1D70E}$
, and to a lesser extent
$\unicode[STIX]{x1D70E}$
, and to a lesser extent
![]() $\unicode[STIX]{x1D706}$
), the width of the bounds increases, as evidenced by comparing, e.g., row 1 vs. 2 vs. 3. The width of the bounds also depends on failure rates; again compare rows 1–4 to 5–8 to 9–12. The bounds do not depend on any unobservable features of the joint distributions of potential outcomes and responses to the manipulation check. To wit, the width of the bounds does not change as
$\unicode[STIX]{x1D706}$
), the width of the bounds increases, as evidenced by comparing, e.g., row 1 vs. 2 vs. 3. The width of the bounds also depends on failure rates; again compare rows 1–4 to 5–8 to 9–12. The bounds do not depend on any unobservable features of the joint distributions of potential outcomes and responses to the manipulation check. To wit, the width of the bounds does not change as
![]() $\unicode[STIX]{x1D70C}(S(1),S(2))$
is varied; compare, e.g., row 1 to row 4.
$\unicode[STIX]{x1D70C}(S(1),S(2))$
is varied; compare, e.g., row 1 to row 4.
Table 1. Simulations demonstrating the effects of dropping. Simulations performed with
![]() $N=1,000$
and
$N=1,000$
and
![]() $100,000$
simulations; bound widths are presented as averages over all simulations.
$100,000$
simulations; bound widths are presented as averages over all simulations.

Appendix D. Additional (Weighted) Summary Statistics
Below, we present distributions of the reweighted covariate profiles of subjects in our replication study, disaggregated by treatment condition and performance on the manipulation checks.
Table 2. Weighted covariate distributions among subjects who failed the manipulation check.
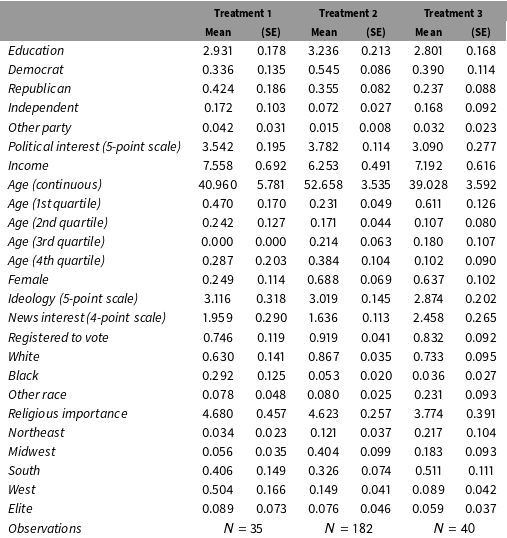
Table 3. Weighted covariate distributions among subjects who passed the manipulation check.
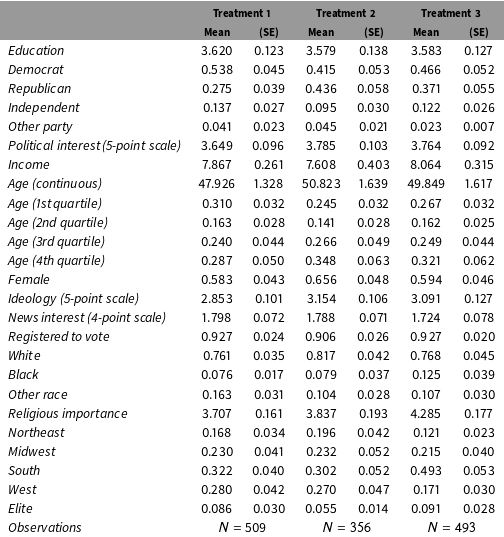
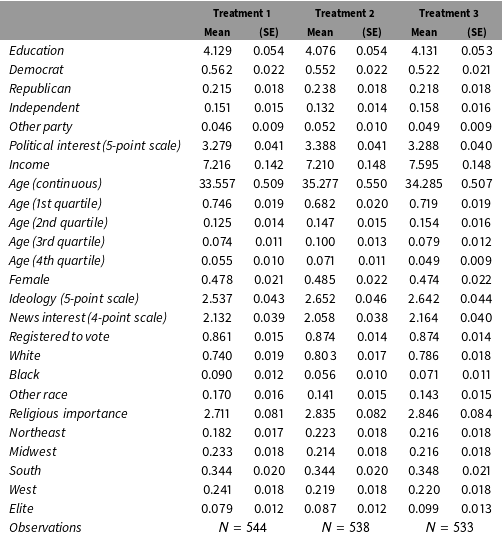
Table 4. Weighted covariate distributions for all subjects.

Appendix E. Additional (Unweighted) Summary Statistics
Below, we present distributions of the unweighted covariate profiles of subjects in our replication study, disaggregated by treatment condition and performance on the manipulation checks.
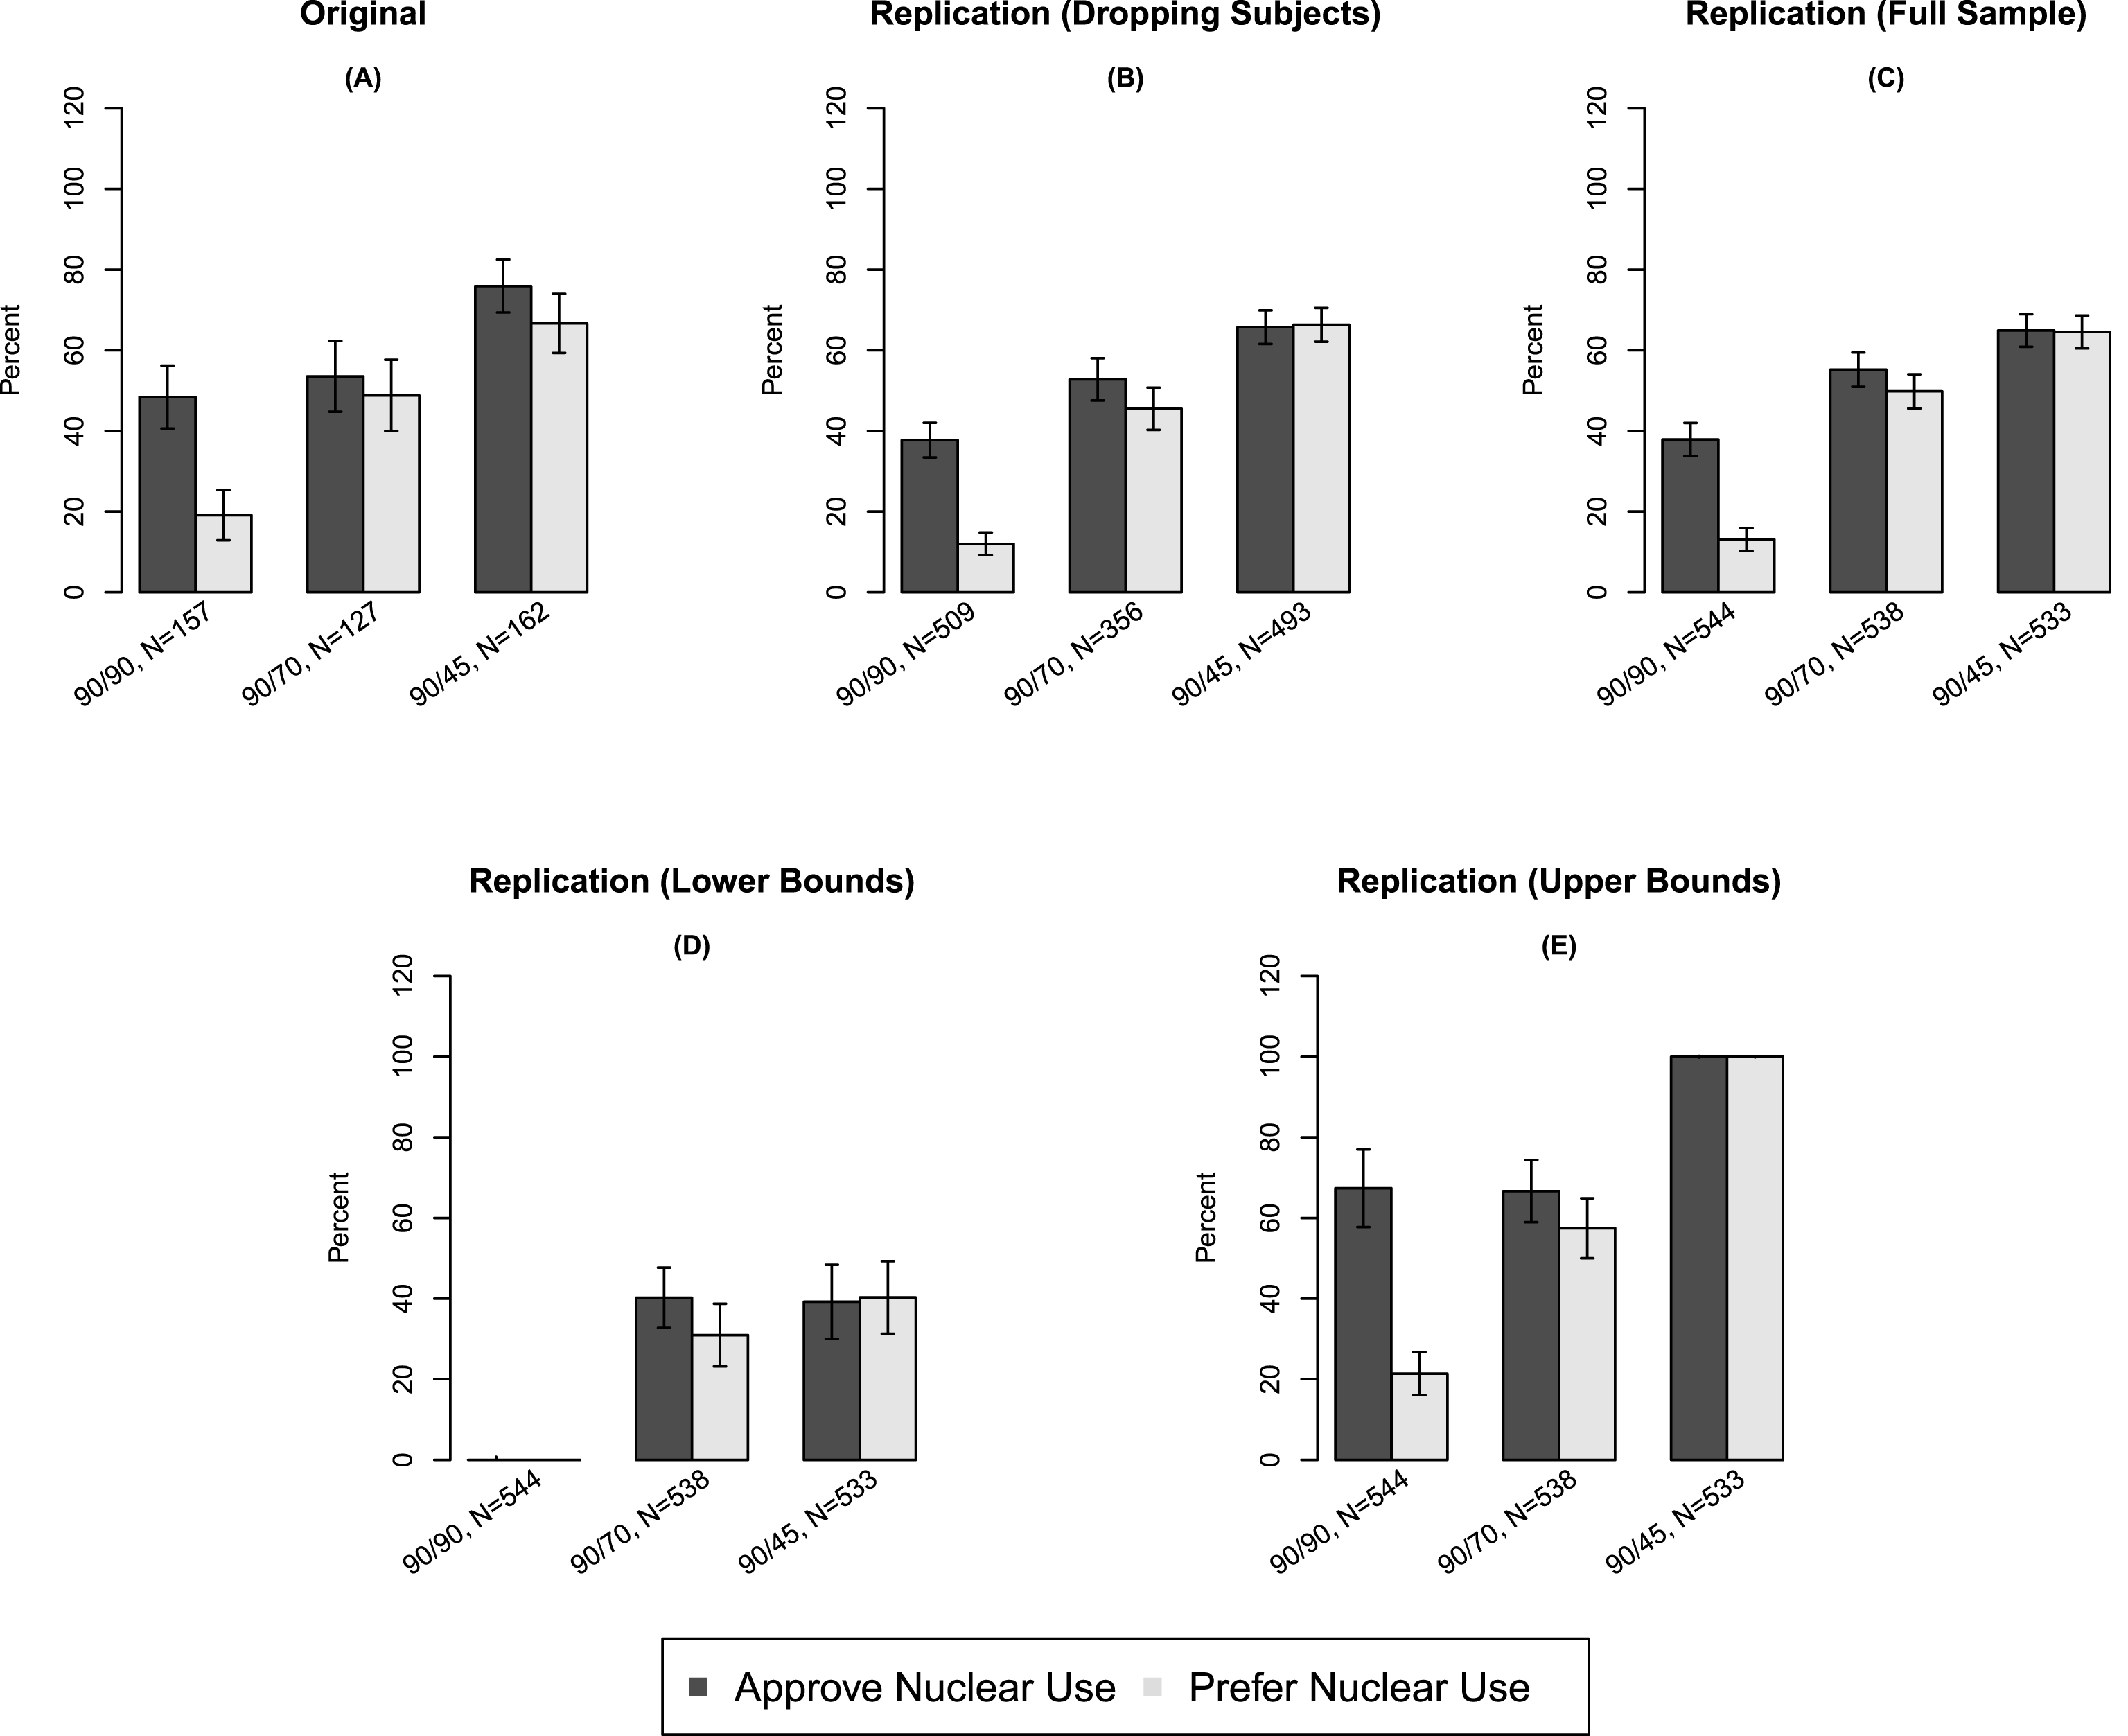
Figure 2. Unweighted Results from Press, Sagan, and Valentino (2013) and Replication. Comparisons of original and unweighted replication data. Panel A presents results from PSV with subjects dropped; Panel B presents results from the replication with subjects dropped; Panel C presents results from the replication using the full sample; Panel D presents results imputing the lower bounds for all treatment conditions; Panel E presents results imputing the upper bounds for all treatment conditions. Vertical bars represent 95% confidence intervals on point estimates calculated using the bootstrap.
Table 5. Unweighted covariate distributions among subjects who failed the manipulation check.
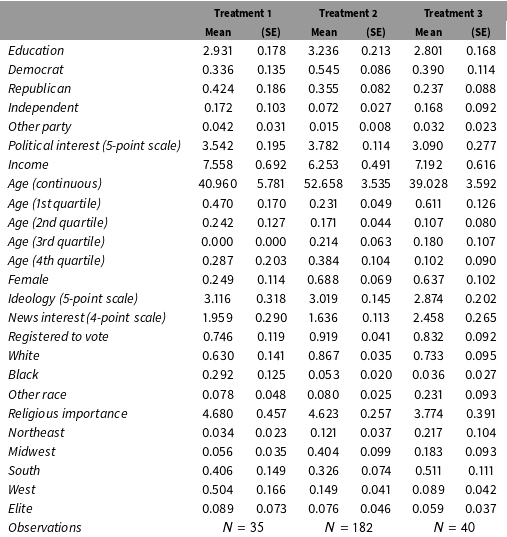
Table 6. Unweighted covariate distributions among subjects who passed the manipulation check.
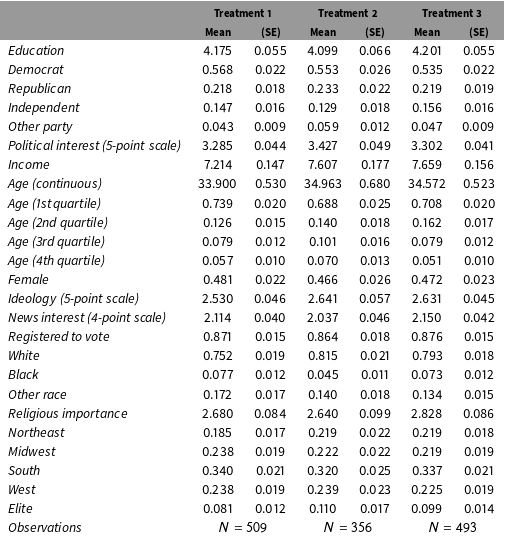
Table 7. Unweighted covariate distributions for all subjects.
