INTRODUCTION
Urinary tract infections (UTIs) are one of the most important community-acquired infections and recurrence is common, particularly among women. Studies show that 20–30% of women will have recurrent episodes during their lifetime [Reference Gupta1]. Patients with diabetes mellitus (DM) have an increased risk of UTIs [Reference Boyko2–Reference Muller4].
DM may predispose patients to more severe infections and complications of the upper urinary tract [Reference Muller4–Reference Joshi6]. In addition, infections in these patients may be more difficult to treat and recur often [Reference Hoepelman, Meiland and Geerlings7, Reference Patterson and Andriole8]. However, data are lacking on individual risks of patients with DM for UTIs. Therefore, a risk assessment using an accurate, objective model of prognosis derived from population-based data could help primary-care physicians make management decisions. The aim of this study was to develop a clinical prediction rule for recurrent UTIs in women with type 2 DM (DM2) and lower UTI in men with DM2 in primary care.
METHODS
A prospective cohort study was conducted using data from the Second Dutch National Survey of General Practice (DNSGP-2). In this survey, 195 family general practitioners (GP) were trained to register all patient visits (n=390 000) for a 12-month period during the study period from May 2000 until April 2002 [Reference Westert9]. Patient visits were registered in computerized medical records using the International Classification of Primary Care (ICPC) codes [Reference Muller4, Reference Lamberts and Wood10] for diagnoses and the codes of the Anatomical Therapeutical Chemical (ATC) classification index [Reference Muller4, 11] for drugs. Active medical comorbid conditions were considered present if a visit for such diseases was made in the year of registration.
Patients aged ⩾45 years with at least one visit with an ICPC code of DM2 were included. Patients with a visit registered with ICPC codes T90.0 (diabetes not specified) or T90.3 (other diabetes) were classified on the basis of their age and medical management [Reference Muller4]. We excluded patients with rare diseases and malignancies requiring a specific management of infections [Reference Muller4].
Potential predictor variables
The selection of potential predictor variables was based on literature on DM and UTIs in general, but restricted by registered variables in the database. The following demographics were selected: age and type of health insurance as a proxy for socioeconomic status [Reference Muller4]. Moreover, use of medication (insulin and/or oral blood glucose lowering medication), health-care use and possibly relevant comorbidity were selected. Health-care use was defined as the number of GP visits, including regular check-ups for DM. Because we only had data for 1 year, successive visits could have been defined as a first visit. The selected comorbidity was the same as that described in a previous study by our group [Reference Muller4]. In addition, the following diseases were recorded: depression, chronic alcohol abuse, hypertension, cerebrovascular disease, dementia and urinary incontinence.
Outcome measure
The outcome measure was an episode of recurrent UTI (cystitis) in women and an episode of lower UTI (cystitis and prostatitis) in men, diagnosed and classified by a GP. As differentiation between cystitis and prostatitis in men is difficult in clinical practice, we combined these two diseases and called them lower UTIs. Such a diagnosis could have been assessed in patients without documentation of bacterial cultures as is common in general practice. An episode could include one or more visits to a GP. A new episode was defined if a patient was free of complaints for 30 days after start of the treatment. A second episode after these 30 days was considered a recurrence.
Statistical analysis
Proportions or means were calculated using SPSS for Windows version 11.0 (SPSS Inc., Chicago, IL, USA) to describe the baseline characteristics of the study population. Univariable logistic regression analysis was used to select potential predictors (P<0·10), which were subsequently examined in a multivariable logistic regression model (P<0·05). Odds ratios (OR) and their corresponding 95% confidence intervals (95% CI) were assessed. For practical purposes, we presented a model with categorized predictors as well as a model with continuous predictors. Calibration of the multivariable logistic regression models was tested using the Hosmer–Lemeshow goodness-of-fit statistic. The ability to discriminate between patients with and without (recurrent) UTI was assessed by the area under the receiver-operating curve (ROC area). A ROC area of 0·5 indicates no discrimination whereas an estimate of 1·0 indicates perfect discrimination.
During the final stage, the regression coefficients of the model were divided by the lowest β [(age)=0·595 for women and (age)=0·583 for men] to form the scores of the predictors. Total score results were used to define clinically useful risk classes. For each class, we calculated sensitivity, specificity, positive and negative predictive value, proportion of outcomes missed (1 – sensitivity) and proportion of persons selected.
RESULTS
Women with recurrent UTIs
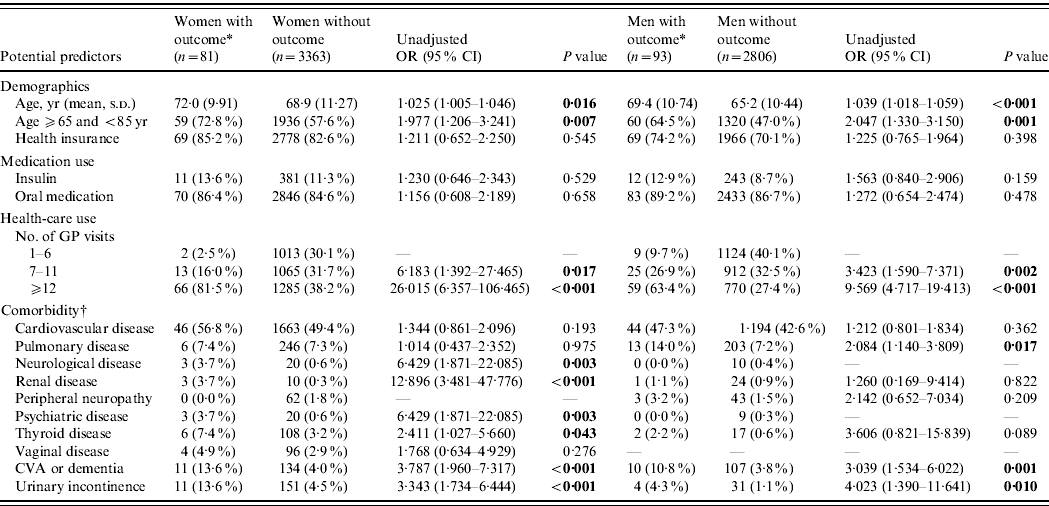
Mean age of the 3444 women included with DM2 was 69 years (s.d.=11). The incidence of recurrent UTI was 2/100 patients followed for 1 year (n=81). The women with recurrent UTIs had a mean age of 72 years (s.d.=10). Those without these infections were aged 69 years (s.d.=11) (Table 1).
Table 1. Unadjusted associations between potential predictors and urinary tract infections in patients with type 2 diabetes mellitus

OR, Odds ratio; CI, confidence interval; CVA, cerebrovascular disease.
Values are given as number (percentage) unless otherwise indicated.
* Outcome: ⩾2 episodes of cystitis in women and ⩾1 episodes of lower UTI in men.
† A definition of the different groups is given in the Methods section.
The univariable analyses showed that increasing age, number of GP visits, neurological, renal, psychiatric and thyroid disease, cerebrovascular disease or dementia and urinary incontinence were significant potential predictors of a recurrent UTI (Table 1).
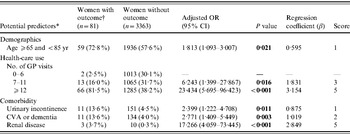
Finally, our multivariable logistic regression model consisted of the following predictors: increasing age (OR, 1·01, 95% CI 1·00–1·03), number of GP visits (OR 1·06, 95% CI 1·05–1·08), urinary incontinence (OR 2·07, 95% CI 1·03–4·16), cerebrovascular disease or dementia (OR 2·23, 95% CI 1·07–4·67) and renal disease (OR 17·71, 95% CI 4·55–68·93). Table 2 a shows the model with age and number of GP visits analysed as categorized variables.
Table 2 a. Adjusted associations between potential predictors and recurrent urinary tract infections in women with type 2 diabetes mellitus

OR, Odds ratio; CI, confidence interval; CVA, cerebrovascular disease.
Values are given as number (percentages) unless otherwise indicated.
* Potential predictors with n⩾5.
† Outcome: ⩾2 episodes of cystitis in women.
The AUC of the final model, including the categorized variables age and number of GP visits, did not differ from the model with the continuous variables age and GP visits (AUC 0·79, 95% CI 0·74–0·83). The Hosmer–Lemeshow goodness-of-fit test statistic indicated an excellent calibration (P=0·76). Using a cut-off score of 4, patients with a lower risk assignment (score 0–3) had a probability of 0·3% and patients with a higher risk assignment (score ⩾4) had a probability of 3·9% for a recurrent UTI. Using a cut-off score of 6, patients with a lower risk assignment had a probability of 1·1% and patients with a higher risk assignment had a probability of 5·8% for an outcome. The proportion of outcomes missed increased from 4·9% to 34·6% (Table 3 a).
Men with lower UTIs
Mean age of the 2899 men included with DM2 was 65 years (s.d.=10). The incidence of lower UTI was 3/100 patients followed for 1 year (n=93). The subjects with lower UTIs had a mean age of 69 years (s.d.=11). Those without these infections were aged 65 years (s.d.=10) (Table 1).
The univariable analyses showed that increasing age, number of GP visits, pulmonary disease, cerebrovascular disease or dementia, and urinary incontinence were significant potential predictors of a lower UTI (Table 1).
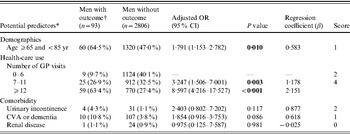
Finally, our multivariable logistic regression model consisted of the following predictors: increasing age (OR 1·02, 95% CI 1·00–1·04), number of GP visits (OR 1·06, 95% CI 1·04–1·08), urinary incontinence (OR 1·33, 95% CI 0·36–4·85) and cerebrovascular disease or dementia (OR 2·10, 95% CI 1·03–4·28). Table 2 b shows the model with age and number of GP visits analysed as categorized variables.
Table 2 b. Adjusted associations between potential predictors and lower urinary tract infections in men with type 2 diabetes mellitus

OR, Odds ratio; CI, confidence interval; CVA, cerebrovascular disease.
Values are given as number (percentages) unless otherwise indicated.
* Potential predictors with n⩾5.
† Outcome: ⩾1 episode of lower UTI in men.
Table 3 a. Recurrent urinary tract infections in women with type 2 diabetes mellitus (DM2) in different risk classes

SE, Sensitivity; SP, specificity; PPV, positive predictive value for an outcome among subjects having a score greater or equal to the cutoff point; NPV, negative predictive value; OM, outcomes missed; Selection, the percentage of the cohort having a score greater or equal to the indicated cut-off point.
* Outcome: ⩾2 episodes of cystitis in women.
The AUC of the final model, including the categorized variables age and number of GP visits, did not differ from the model with the continuous variables age and GP visits (AUC 0·75, 95% CI 0·70–0·80). The Hosmer–Lemeshow goodness-of-fit test statistic indicated an excellent calibration (P=0·42). Using a cut-off score of 2, patients with a lower risk assignment (score 0–1) had a probability of 0·8% and patients with a higher risk assignment (score ⩾2) had a probability of 4·7% for a lower UTI (Table 3 b). Using a cut-off score of 4, patients with a lower risk assignment (score 0–3) had a probability of 1·6% and patients with a higher risk assignment (score ⩾4) had a probability of 7·1% for a lower UTI. The proportion of outcomes missed increased from 8·7% to 34·4% (Table 3 b).
Table 3 b. Lower urinary tract infections in men with type 2 diabetes mellitus (DM2) in different risk classes

SE, Sensitivity; SP, specificity; PPV, positive predictive value for an outcome among subjects having a score greater or equal to the cut-off point; NPV, negative predictive value; OM, outcomes missed; Selection, the percentage of the cohort having a score greater or equal to the indicated cut-off point.
* Outcome: ⩾1 episode of lower UTI in men.
DISCUSSION
We were able to derive an accurate model to predict recurrent UTI in women with DM2 and lower UTI in men with DM2 using a nationally representative large population-based database in primary care. To our knowledge this is the first population-based study on individual risks for UTIs in DM2 using a prospective design, with a sufficient sample size and taking into account a large range of potential predictors. Moreover, the diagnosed comorbidity is well registered due to the fact that in The Netherlands more than 90% of patients have their own GP who is acts as a filter for specialist care. Therefore, a detailed record of each patient's ongoing medical history and characteristics were available.
Several studies described risk factors for the development of UTIs [Reference Boyko2, Reference Nickel5, Reference Ronald and Ludwig12] and different results have been found regarding age [Reference Hooton13, Reference Geerlings14]. Urinary incontinence has been described as a risk factor [Reference Hu3, Reference Brown15]. In contrast to some earlier studies, we did not find insulin therapy to be a predictor for UTIs [Reference Brown15, Reference Boyko16]. Dementia in relation to UTIs has been described in the elderly [Reference Nicolle17, Reference Singal18]. However, according to Ginde et al. [Reference Ginde, Rhee and Katz19] dementia may not be as important as previous studies have suggested, although this retrospective cohort study had a relatively small sample size.
Several limitations of the present study should be noted. The power was not adequate to choose more distinct categories of comorbidity and to enable analysis of specific subgroups of patients. Therefore, we were not able to use hospitalization or death as an outcome, two measures that are frequently used in prognostic research. In addition, laboratory biochemical data were not registered. Taking a small sample size into account, Ginde et al. [Reference Ginde, Rhee and Katz19] showed that laboratory data were helpful in determining risks in geriatric patients. However, our prediction rule permits GPs to avoid ordering laboratory tests and enhance the possibility of risk calculation immediately. Unfortunately, diagnostic tests such as the routine measurement of glycaemic control were not validly registered or available for analysis. Thus far, data regarding this potential predictor is not conclusive [Reference Ronald and Ludwig12, Reference McMahon and Bistrian20, Reference Leibovici21]. Since this study concerns a computerized database study it was necessary to make use of the ICPC coding system for the registration of medical encounters. In such records, a detailed description of sexual habits is not available, let alone being valid. Although, this might be a very important predictor, we were not able to use it for our analysis using routine medical care data. Furthermore, it might be argued that we missed some patients with DM2. First, we could have missed them by taking a cut-off of age 45 years. For example, it has recently been described that a growing number of children and adolescents are developing DM2. However, this especially concerns ethnic minority populations [22, Reference Ehtisham23]. Second, the onset of DM might have been after the date of the UTI. However, we do not believe that this has biased our results, because the incidence of new patients with DM is about ten times lower than the prevalence (26·3 cases/1000 patients). By far the majority of patients with DM2 are aged ⩾45 years and most cases of UTI occur in this age group.
Our prediction rule can be used in all patients with DM2 aged ⩾45 years. The choice of the optimum cut-off level of the prediction rule may be chosen depending on the acceptability of the proportion of missed outcomes. For example, a higher cut-off point, in favour of a higher specificity, may be chosen in case of intensive and costly treatment strategies. Choosing a cut-off level of 4 points, the proportion of selected women is 58% and a low number of complications would be missed. Choosing a cut-off level of 6 points increases the probability of a recurrent UTI in women (from 3·9% to 5·8%), but the proportion of outcomes missed increases accordingly (from 4·9% to 34·6%). For patients at increased risk for (recurrent) UTI, GPs can take accompanying preventive measures. GPs may recommend that these patients should visit their practice as soon as possible when symptoms of UTI occur. People could be educated about risk factors and signs indicating a UTI. For example, they should pay attention to indicators of UTI in the early stage and visit their GP for advice. Moreover, these patients could use self-diagnosis strategies that can simplify the required care for UTIs. For example, the study by Gupta et al. [Reference Gupta1] provides strong evidence for a safe and feasible strategy for recurrent UTIs in women. GPs could consider further options to manage cases of recurrent UTI [Reference Car and Sheikh24]. In the future, E. coli vaccination might be a potential method of preventing UTIs in women with DM [Reference Meiland25], particularly as there are important concerns about the possible future global implications associated with the overuse of antibiotics [Reference Abbasi26, Reference Wise27].
In conclusion, we were able to derive an objective model with acceptable discriminatory ability to predict recurrent UTIs in women with DM2 and lower UTIs in men with DM2. Simple variables can be used for the risk stratification of patients. Future prospective trials should focus on cost-effectiveness and safety of application of the rule by GPs. Importantly, further studies are needed to verify whether the same predictors are relevant to predict the prognosis once a patient with DM2 has been diagnosed with a UTI. Whether or not the GP should treat more aggressively or for a longer period should be established in further studies.
ACKNOWLEDGEMENTS
This work was supported by grants from the Public Health Fund, The Hague, The Netherlands (U03/175-P230) and the Dutch Diabetes Research Foundation, Amersfoort, The Netherlands (2003.00.031). We thank Mrs N. Boekema for support with data management and Mr N. P. A. Zuithoff for statistical assistance.
DECLARATION OF INTEREST
None.


