Acute gastrointestinal illness (AGI) is a common cause of illness in New Zealand as in other countries and carries a large human and economic cost [Reference Lake1]. New Zealand has a notifiable disease surveillance system that provides information generated from patients presenting to a medical practitioner. Many of these notifiable diseases present as AGI. It is generally accepted that these patients represent a small fraction of the total community AGI burden and a number of studies have elucidated the broader picture in terms of a disease pyramid for specific countries [Reference Majowicz2–Reference Hall6]. Such pyramids quantitatively depict the under-ascertainment of cases at each step of the pathway [general practitioner (GP), clinical laboratory, notifiable disease system] leading to an AGI-related notified illness.
Initiatives to reduce the burden of AGI are required at a population level as well as pathogen-specific strategies [7]. An overview of the AGI burden and the under-ascertainment at each level of the pyramid assists risk management by:
• providing baseline measurements of the AGI burden in the New Zealand community;
• highlighting the large numbers of community cases for which there is very little diagnostic information;
• highlighting that medical consultation, laboratory testing and notification data represent small subsets of the overall number of cases;
• identifying data gaps, and providing the impetus for modifications in surveillance systems;
• indicating that much of AGI is not due to sources or transmission routes subject to regulatory controls, e.g. person-to-person transmission rather than contaminated food or water.
In this report we describe the AGI disease pyramid for New Zealand, drawing on notification data and two surveys. Data for estimating the disease pyramid in New Zealand came from the following sources:
(1) The number of community cases of AGI, GP consultations, and faecal samples requested and provided were determined by a nationwide 12-month (February 2006–January 2007) telephone survey [Reference Adlam8]. Community case data were adjusted to correct for age, gender and ethnicity, based on results from the 2006 New Zealand Census.
(2) Data on faecal sample testing were derived from a survey of community and hospital laboratories conducted in mid-2006, requesting information for the calendar year 2005 [Reference Lake9].
(3) The number of notified cases of relevant diseases during the period of the community survey was extracted from EpiSurv, the national notifiable disease database maintained by the Institute of Environmental Science and Research under contract to the New Zealand Ministry of Health.
Client reports of these studies have been made available on the website of the New Zealand Food Safety Authority (http://www.nzfsa.govt.nz/).
The data from these studies were used to describe Beta distributions for a model constructed in @RISK (version 5.0, Palisade Corporation, USA). The Beta distributions concerned the probability of each event in the disease pyramid extrapolated from the survey data. These probabilities were then multiplied by the revised June 2006 New Zealand estimated resident population provided by Statistics New Zealand (4184600).
The number of community AGI cases meeting the case definition used for the survey (any diarrhoea and/or vomiting experienced in the previous 4 weeks, excluding non-infectious causes) was 297/3655, giving a crude period prevalence of 8·1% (95% CI 7·2–9·0). This corresponded to a weighted age, sex, and Maori/non-Maori ethnic status period prevalence of 8·6% (95% CI 7·6–9·6) using the New Zealand 2006 Census population as the reference standard. After extrapolation the weighted prevalence represents 4·66 million cases (95% CI 4·17–5·16 million) over a full year for the 2006 national population (1·11 cases/person per year). Crude data from the community study showed that 22% (65/297) of all AGI cases had consulted their GP for healthcare. After adjustment, this represents 0·92 million cases (95% CI 0·73–1·12 million) consulting their GP over the year.
There were 65 AGI cases that visited a GP, 49 of whom had diarrhoea as a symptom. Of those AGI cases with diarrhoeal illness, 20 had a faecal sample requested for laboratory testing. Therefore, 31% (20/65) of all AGI cases attending their GP had a faecal specimen requested (it was assumed the AGI cases without diarrhoea were not asked to provide faecal samples). Of the 20 respondents who were asked to provide a faecal sample, 18 submitted a sample giving a compliance rate of 90%.
The laboratory survey estimated that about 250 000 faecal samples were submitted in 2005 to community and hospital laboratories, 77% of which were estimated to be at the request of GPs. This survey indicated that very few samples were discarded before testing. From the laboratories reporting this ratio, it was also estimated that pathogens were identified in about 20% of these samples.
Several diseases that are notifiable in New Zealand can clinically manifest as AGI. The number of cases of these diseases reported to the notifiable diseases surveillance system during the period of the community survey is shown in Table 1. Although clinicians are required to notify on ‘clinical suspicion’ the majority delay until a laboratory diagnosis is made.
Table 1. Number of cases and population incidence rates of AGI-related notifiable diseases reported to the New Zealand notifiable disease surveillance system during the 12-month period of the community survey, February 2006–January 2007

* June 2006.
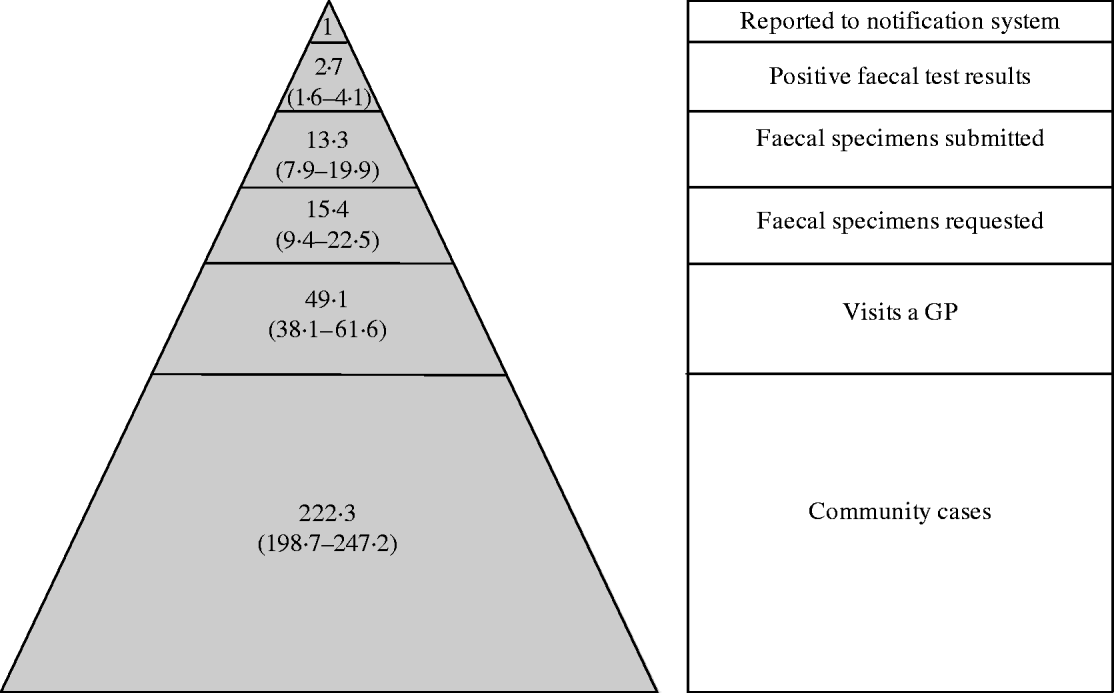
The mean number of cases or events at each step in the disease pyramid was related to the number of notified cases to provide the final pyramid ratios shown in Figure 1. The figure also shows the 5th and 95th percentile values from the generated binomial distributions. These data show that whereas 22% (49·1/222·3) of community AGI cases visit a GP, only about 0·4% (1/222·3) of community cases ultimately result in a reported case of a notifiable disease.

Fig. 1. The New Zealand acute gastrointestinal illness reporting pyramid showing ratios of cases in the community, general practice, and clinical laboratory levels relative to notifiable diseases, 2006 (mean, 5th and 95th percentiles).
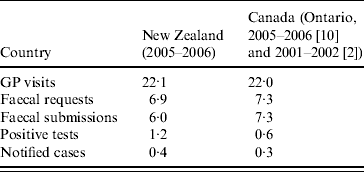
Several international studies have produced data that could be compared with this New Zealand study, but differing case definitions for AGI make direct comparisons difficult [Reference Wheeler3–Reference Hall6]. Studies in Ontario, Canada [Reference Majowicz2, Reference Sargeant10], using the same case definition (any diarrhoea or vomiting in the previous 4 weeks, excluding non-infectious causes) found very similar under-ascertainment ratios in the AGI pyramid to this New Zealand study (Table 2). Estimation of the prevalence of AGI using other more restrictive case definitions [Reference Adlam8] are complicated by the proportion of cases who were unable to report the number of loose stools in a 24-h period (49/297, 16·5%), so recalculation of the pyramid was not undertaken.
Table 2. Comparison of under-ascertainment in the surveillance pyramid (percentage of community cases) for New Zealand with that from Ontario, Canada

The finding that notified cases represent a very small proportion of the overall total of AGI cases in New Zealand is entirely expected and confirms that notified cases do not serve as a measure of the overall burden. Ongoing sentinel surveillance or periodic repeated surveys could be considered as ways of monitoring AGI incidence, with notifiable disease data as an indicator of disease trends, intervention impacts, and epidemic occurrence.
The ratios determined for AGI cannot be applied to estimating the pyramids for any specific types of AGI. Overseas studies [Reference Wheeler3, Reference de Wit11, Reference Amar12] have demonstrated that the base of the pyramid is very large for viral gastroenteritis compared to the more severe bacterial infections such as campylobacteriosis. It would be useful to carry out further work in New Zealand to measure pathogen-specific rates of AGI in the community. Such work would require resource intensive community cohort studies, such as have been conducted in the UK and The Netherlands [Reference Wheeler3, Reference de Wit11], or modelling approaches to produce plausible estimates [Reference Hall13, Reference Voetsch14].
ACKNOWLEDGEMENTS
The New Zealand Food Safety Authority funded this study. The New Zealand Ministry of Health provides funding for the notifiable disease reporting system.
DECLARATION OF INTEREST
None.


