The prevalence of overweight and obesity in adolescents has been increasing over past years in many countries( Reference Wang and Lobstein 1 ), including Brazil, where in a period of 35 years (1974–1975 to 2008–2009) overweight in adolescents increased from 3·7 % to 21·7 % in boys and from 7·6 % to 19·4 % in girls( 2 ). This trend in overweight and obesity increase was also observed in 9–12-year-old public schools students investigated in a randomized clinical trial for prevention of obesity in the city of Niterói, Rio de Janeiro, comparing baseline and final data collected after one school year( Reference Sichieri, Veiga and Souza 3 ). On the other hand, the prevalence of underweight decreased among Brazilian adolescents reaching about 3 % among boys and girls in 2008–2009( 2 ).
In a study conducted in 2003 with adolescents from public schools in the metropolitan area of Rio de Janeiro, a considerable prevalence of metabolic disorders was observed, particularly in those who were obese( Reference Alvarez, Vieira and Moura 4 , Reference Alvarez, Vieira and Sichieri 5 ), and an association was found between these disorders and anthropometric measurements of abdominal obesity( Reference Alvarez, Vieira and Sichieri 6 ). Such evidence reinforces the importance of monitoring anthropometric measurements in adolescents.
In general, trends in overweight and obesity in adolescents have been evaluated based on BMI( Reference Chinn and Rona 7 – Reference Ogden, Carroll and Curtin 11 ). However, trends in anthropometric indicators of abdominal obesity such as waist circumference (WC), waist-to-hip ratio (WHR) and waist-to-height ratio (WHtR) have also been studied among adolescents. The increase in these measurements has been demonstrated in adolescents from various countries like Spain( Reference Moreno, Sarria and Fleta 12 ), Australia( Reference Garnett, Cowell and Baur 13 ), the USA( Reference Li, Ford and Mokdad 14 ), the UK( Reference McCarthy, Ellis and Cole 15 , Reference McCarthy and Ashwell 16 ) and New Zealand( Reference Utter, Scragg and Denny 17 ). In Brazil, studies on abdominal fat trends among adolescents have not been published yet.
The aim of the present study was to compare BMI, WC, WHR and WHtR in adolescents from public schools of a municipality in the metropolitan area of Rio de Janeiro, Brazil, between 2003 and 2008.
Methods
The analysis was based on data from two cross-sectional school-based surveys conducted in 2003 and 2008 with probabilistic samples of adolescents from public schools of Niterói, a city located in the metropolitan area of Rio de Janeiro, Brazil, with about 500 000 inhabitants.
The survey conducted in 2003, which aimed to evaluate risk factors for CVD in adolescents, investigated a probabilistic sample of 610 adolescents (cluster sampling by random class selection) aged 12–19 years, from 5th to 11th grades in thirteen of the thirty-three public schools located in the city. The sample size estimation was based on the number of students enrolled in the state education system in Niterói in 2001 (25 102 students in the target age group). Details on sample design and selection can be found elsewhere( Reference Vieira, Alvarez and Kanaan 18 ).
In 2008, there were 26 294 students from 5th to 11th grades enrolled in the state education system in Niterói. To favour the comparability between the two studies, the same thirteen schools included in the first survey were included in the 2008 survey and thirty classes were randomly selected, with a mean expected number of thirty students per class. Therefore, 894 students aged 12–19 years were selected to participate in the survey. In both studies, the same criteria of eligibility were applied: not being pregnant and not having physical deficiencies which would hinder the anthropometric evaluation.
To verify the differences in the anthropometric measurements between the two studies, we opted for evaluating only those adolescents aged 15 years or older, considering that in this age range the changes observed would be less subjected to the effect of the sexual maturation, which can be especially variable between individuals particularly in the first phase of adolescence.
In 2003, there were 641 eligible students in the age group of 15–19 years, of which twenty-six parents did not sign the informed consent, seventy refused to participate in the research and fifteen did not come to school on the days scheduled for measurements. Therefore, 530 students were evaluated (non-response rate of 17·3 %). In 2008, in the same age group, there were 632 eligible students of which thirty-three did not present the consent form signed by the legal guardian, seventy-four refused to participate in the research and twenty-seven did not come to school on the date scheduled for data collection. Therefore, 498 students were evaluated (non-response rate of 21·2 %).
With these sample sizes, it was possible to estimate a prevalence of overweight of about 20 %( 2 ), with 95 % confidence interval and 5 % absolute precision, considering the effect of the cluster design of sampling (classes)( Reference Lwanga and Lemeshow 19 ).
In both studies, interviewers were trained and standardized in anthropometric measurements within the margins of error accepted by Habicht's criterion( Reference Habicht 20 ). When the interviewers did not reach the limit values for reliability and validity they underwent further standardization sessions to reach acceptable values. Interviewers were retrained periodically during the fieldwork using the same procedures. In the two surveys, body weight was measured using an electronic scale (Kratos PPS, Brazil) accurate to 50 g. Height was measured with a portable stadiometer (Leicester model 2003, UK or Alturexata model 2008, Brazil) accurate to 0·1 cm. No significant differences were found between height means measured by the two stadiometers in twenty-five young adults (Leicester = 162·5 (sd 9·2) cm and Alturexata = 162·7 (sd 9·2) cm, P = 0·93).
The adolescents were evaluated wearing light clothing and barefoot, in orthostatic position. Due to the precision of the electronic scale, body weight was measured only once. Height was measured twice, considering the average of both measurements as the valid measure. A maximum variation of 0·5 cm between the two measurements was allowed, repeating the procedure if the difference was greater than this limit( Reference Gordon, Chumlea and Roche 21 ). BMI was calculated dividing weight (in kilograms) by the square of height (in metres). Overweight prevalence was estimated by the age- and gender-specific BMI cut-offs (Z–score > 1) according to reference curves proposed by the WHO( Reference Onis, Onyango and Borghi 22 ).
WC and hip circumference (HC) were measured with inelastic tape measures, with variation of 0·1 cm, on the smallest trunk circumference (natural waist of the individual) and on the maximum circumference over the buttocks, respectively. Two measurements were taken for each circumference and the averages were considered as the valid measures. A maximum variation of 1·0 cm was allowed between both measurements, repeating the procedure if the difference was greater than the acceptable limit( Reference Callaway, Chumlea and Bouchard 23 ).
The age-adjusted means with respective 95 % confidence intervals, and the 3rd, 10th, 50th, 90th and 97th percentiles, of BMI, WC, HC, WHR and WHtR were estimated by sex and year of study. The means were compared by linear regression and frequencies were compared by the χ 2 test. P < 0·05 was taken as the level for a statistically significant difference. These statistical analyses were made considering the cluster sampling design (random classes) and the sampling expansion corrected by the relative weight, using the procedures for complex samples of the statistical software package SPSS version 19·0. Percentiles were compared by quantile regression using the statistical software package SAS version 9·2.
The study was conducted according to the guidelines laid down in the Declaration of Helsinki and all procedures involving human subjects were approved by the Research Ethics Committee of University Hospital Clementino Fraga Filho (for the survey conducted in 2003) and of Institute of Pediatrics Martagão Gesteira (for the survey conducted in 2008), both from the Federal University of Rio de Janeiro. The participation in the surveys was voluntary and only those adolescents who presented written informed consent signed by a legal guardian (for those under 18 years of age) took part in the research.
Results
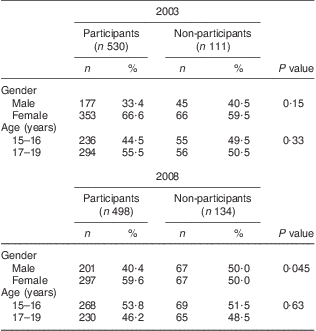
Comparing the participants (530 students in 2003 and 498 students in 2008) with the non-participants (111 students in 2003 and 134 students in 2008), it was observed that there were no significant differences between participants and non-participants in 2003 with regard to gender and age range. In 2008 no differences were verified with regard to age range, but the proportion of boys was smaller among participants than among non-participants (Table 1).
Table 1 Comparison of participants and non-participants according to gender and age range: adolescents from public schools in the metropolitan area of Rio de Janeiro, Brazil, 2003–2008

There were no differences between the investigated groups in the 2003 and 2008 surveys according to gender (girls: 66·6 % in 2003 v. 59·6 % in 2008, P = 0·13), age range (15–16 years: 44·5 % in 2003 v. 53·8 % in 2008; 17–19 years: 55·5 % in 2003 v. 46·2 % in 2008, P = 0·43) and mean age (girls: 17·1 v. 16·9 years, P = 0·55; boys: 17·3 v. 16·5 years, P = 0·12).
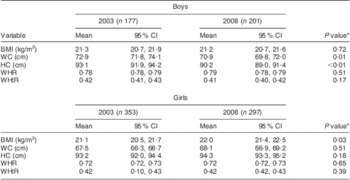
A significant increase in girls’ mean BMI (P = 0·03) and significant decreases in boys’ mean WC (P = 0·01) and HC (P < 0·01) were observed between the two studies (Table 2).
Table 2 Variation in the means of anthropometric obesity indicators according to gender among adolescents from public schools in the metropolitan area of Rio de Janeiro, Brazil, 2003–2008

WC, waist circumference; HC, hip circumference; WHR, waist-to-hip ratio; WHtR, waist-to-height ratio.
*Obtained by linear regression.
In both studies conducted in 2003 and 2008, a high prevalence of overweight for boys and girls was observed; nevertheless, differences were dependent on gender. Although the results were not statistically significant, there was a tendency of increasing overweight among girls (15·9 % in 2003 v. 22·2 % in 2008, P = 0·11), whereas for boys the prevalence of overweight was not different between the two studies (19·8 % in 2003 v. 19·4 % in 2008, P = 0·90).
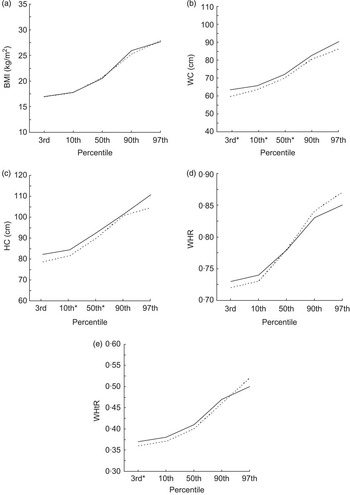
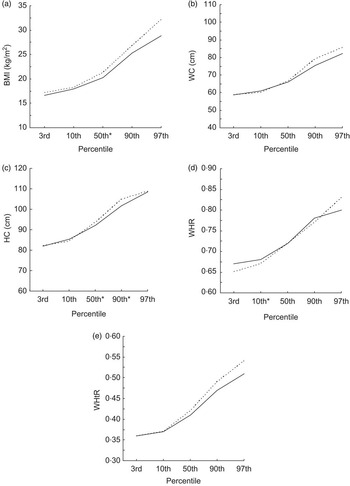
Based on the percentile distribution of anthropometric variables, it was observed that boys’ WC, HC and WHtR curves were lower in 2008, whereas the BMI curves overlapped (Fig. 1) and the WHR curve was higher from the 50th percentile. For girls, the curves for all variables tended to be higher in 2008, except the WHR curve, which was higher only for the most elevated percentiles of the distribution (Fig. 2).

Fig. 1 Variation in the percentiles of anthropometric obesity indicators among male adolescents from public schools in the metropolitan area of Rio de Janeiro, Brazil, 2003 (——) to 2008 (-----): (a) BMI; (b) waist circumference (WC); (c) hip circumference (HC); (d) waist-to-hip ratio (WHR); (e) waist-to-height ratio (WHtR). Significant difference between 2003 and 2008 obtained by quantile regression: *P < 0·05

Fig. 2 Variation in the percentiles of anthropometric obesity indicators among female adolescents from public schools in the metropolitan area of Rio de Janeiro, Brazil, 2003 (——) to 2008 (-----): (a) BMI; (b) waist circumference (WC); (c) hip circumference (HC); (d) waist-to-hip ratio (WHR); (e) waist-to-height ratio (WHtR). Significant difference between 2003 and 2008 obtained by quantile regression: *P < 0·05
Discussion
In the present study we sought to know whether there were differences in means and percentile curves of BMI, WC, WHR and WHtR in adolescents from public schools of a municipality in the metropolitan area of Rio de Janeiro, Brazil, between 2003 and 2008. When we analysed the data, without stratifying by age group, we observed a significant increase in BMI for girls, but not for boys; and the same was observed for overweight prevalence. We also observed a tendency that boys’ anthropometric measurements of abdominal obesity decreased between 2003 and 2008, whereas for girls they tended to increase. National representative surveys have already revealed that overweight and obesity have been increasing significantly in young Brazilians( 2 , Reference Veiga, Cunha and Sichieri 10 ). Based on a birth cohort study in Southern Brazil( Reference Menezes, Hallal and Dumith 24 ), BMI in 15-year-old adolescents was positively associated with early rapid weight gain during early life, which can be a marker of high risk of obesity in older children and young adults. Nutrition during pregnancy as well as infant and young child feeding practices up until the child's second birthday (also referred to as ‘the first 1000 days of life’) should therefore receive priority attention in order to rectify this situation.
During the 2000s, Brazil has undergone profound changes in the socio-economic scenario. Economic growth and social policies for reducing poverty and improving income distribution have increased the population's purchasing power( 25 , Reference Fecomercio 26 ) with important changes in the dietary pattern. For example, consumption of processed foods and sodas has increased, and thus may be related to increased rates of overweight and obesity in all age and sex groups in Brazil( Reference Monteiro and Cannon 27 ). These changes affect the entire population, characterizing a period effect. However, a cohort effect may be present if children are compared with adolescents, showing a greater increase in prevalence of overweight and obesity in children( 2 ). This scenario may explain our findings when changes in mean BMI were analysed by stratifying our school data into two age groups: 15–17 years and 17–19 years (see Supplementary Materials). Mean BMI increased in the younger group by 0·6 kg/m2 among boys and by 1·4 kg/m2 among girls, whereas for the older group these changes in mean BMI were negligible in girls (0·2 kg/m2) and even showed a reduction among boys (−0·4 kg/m2). These changes are in accordance with an important cohort effect: the younger group showing a higher increase in BMI, and the older group showing an increase in BMI only when compared within their own cohort (i.e. those who were younger in 2003), but not when compared with the younger group in 2008.
The stabilization of overweight prevalence in boys could also have resulted from a possible higher level of physical activity among boys compared with girls. Even though we did not analyse physical activity data, it is possible that the boys were more active than the girls as observed by a systematic review( Reference Seabra, Mendonça and Thomis 28 ) and a Brazilian nationwide surveillance study( Reference Hallal, Knuth and Cruz 29 ).
In general, percentile values of girls’ anthropometric measurements increased between 2003 and 2008, except for WHR, which increased only for the highest percentiles of the distribution. Using WHR to estimate abdominal fat accumulation in adolescents is highly dependent on age( Reference Power, Lake and Cole 30 ) and the changes in WHR during pubertal development might be reflecting changes in the relationship between the measures of waist and hip, more than properly central accumulation of fat( Reference Weiss, Dziura and Burgert 31 ). WHR presented poorer performance in the prediction of abdominal fat evaluated by dual-energy X-ray absorptiometry than WC in children aged 3–19 years( Reference Taylor, Jones and Williams 32 ). In contrast, WHtR has been recommended for adolescents because besides being independent of sex and age, it is considered a good marker to monitor overweight for young subjects( Reference Li, Ford and Mokdad 14 , Reference Vander and Seidell 33 ). This index is also highly correlated to visceral fat( Reference Ashwell, Lejeune and McPherson 34 ) and with risk factors for metabolic syndrome in children( Reference Savva, Tornaritis and Savva 35 ). In the students evaluated in the 2003 study, WHtR was the second measure of abdominal fat more closely associated with the components of metabolic syndrome; WC presented the best results while WHR was the one with the poorest association( Reference Alvarez, Vieira and Sichieri 6 ).
The present study therefore demonstrated that, for girls, besides the increase in total body fat reflected by the differences in BMI, there was also a trend of abdominal obesity increase as suggested by percentile distributions of WC and WHtR (Fig. 2b and e), which could indicate a higher risk of metabolic disorders associated with the excess of central body fat.
In boys, 2003 and 2008 BMI curves overlapped (Fig. 1a). There was even a tendency of lower fat accumulation in the abdominal region expressed by lower values of WC and WHtR percentiles in 2008 (Fig. 1b and e). The only exception was for WHtR 97th percentile, which was higher in the second study. The higher values for the 2008 boys’ WHR 50th percentile may be explained by the lower average WC, resulting in higher values for the ratio between these measures of waist and hip. However, this finding does not seem to have any clinical relevance.
Studies analysing trends in percentile distributions of anthropometric indicators of abdominal obesity in young people are scarce, thus limiting the possibility of comparing the results observed in the present study. Studies that evaluated temporal changes in WC and WHtR measures in adolescents have compared averages and demonstrated an increase in these measures, both for boys and girls( Reference Moreno, Sarria and Fleta 12 – Reference Utter, Scragg and Denny 17 ).
Evaluating the BMI of adolescents in Belgium, between 1969 and 1996 Hulens et al. ( Reference Hulens, Beunen and Claessens 36 ) observed an increase in the values of this index between the lowest and the highest percentiles for girls and only in the highest percentiles (85th and 95th) for boys. Kautiainen et al. ( Reference Kautiainen, Rimpelä and Vikat 37 ) also noted an increase between 1977 and 1999 in the 85th and 95th BMI percentiles of Finnish girls and boys.
It is important to highlight that the absolute values of the 90th percentile of BMI both in 2003 (25·9 kg/m2 for boys and 25·3 kg/m2 for girls) and in 2008 (25·2 kg/m2 for boys and 26·8 kg/m2 for girls) were already higher than the cut-off point indicated by WHO( 38 ) to classify overweight in adults (25·0 kg/m2). Likewise, the 97th percentile of WHtR both in 2003 (0·50 for boys and 0·51 for girls) and in 2008 (0·52 for boys and 0·54 for girls) were equal to or greater than the cut-off point suggested to indicate risk of CVD (0·50)( Reference McCarthy and Ashwell 16 ).
The sample size in the present study did not allow the comparison of changes between anthropometric indicators for each year of age, which would be recommended due to the variation in anthropometric measurements with the growth process. This limitation has been softened by adjusting the measurements by age. Despite this limitation, we can confirm the importance of monitoring the nutritional status of adolescents based on anthropometric measurements, a method which is characterized by its practicality and low costs. Therefore this should be implemented in the routine health-care service for children and adolescents, including in the school environment, aiming at better control and prevention of nutritional problems.
The present results revealed that, between 2003 and 2008, among girls from Niterói, Rio de Janeiro, there was a significant increase in mean BMI and a tendency for anthropometric indicators of abdominal obesity to increase. However, among boys, there was stabilization in these measures. Further analysis suggested that a cohort effect may have a role in this phenomenon. Therefore, new studies that could clarify gender differences in the evolution of anthropometric indicators of adolescents in the metropolitan region investigated would be important.
Acknowledgements
Sources of funding: This research was supported by the Conselho Nacional de Desenvolvimento Científico e Tecnológico (CNPq) and the Fundação Carlos Chagas Filho de Amparo à Pesquisa do Estado do Rio de Janeiro (FAPERJ). Conflicts of interest: There are no conflicts of interest to declare. Authors’ contributions: E.G.B. analysed data, interpreted the results and led the writing; R.A.P. assisted with data analysis, interpretation of the data and revised the text; R.S. assisted with data analysis, interpretation of the data and revised the text; G.V.d.V. originated the study, supervised all aspects of analysis and interpretation of the data and revised the text.
Supplementary Materials
For Supplementary Materials for this article, please visit http://dx.doi.org/10.1017/S1368980012005198


