1. Introduction
Peanut (Arachis hypogaea L.) is an important oilseed crop which is widely consumed by humans. In the United States the public consumes approximately 2·4 billion pounds (1·1 billion kg) of peanuts per year (The Peanut Institute, www.peanut-institute.org). Argentina, China and the United States are the largest exporters of peanuts while the European Union and Asia tend to be the largest peanut importers (Revoredo & Fletcher, Reference Revoredo and Fletcher2002). Peanut oil, peanut butter and peanut seeds are highly nutritious for human consumption. The seeds contain approximately 45–51% oil and most of their oil content consists of oleic and linoleic acids (Lopez et al., Reference Lopez, Nadaf, Smith, Connell, Reddy and Fritz2000). Humans whom consume a high amount of monounsaturated fat, such as that found in peanut, tend to have reduced LDL cholesterol, lower triglycerides and improved HDL cholesterol. Peanuts are also a good source of protein, vitamin E, folate, fibre and phytochemicals.
Even though peanut is known to be an important agricultural commodity, genomic and molecular studies have lagged behind those on other legumes such as soybean. Only recently have a fairly abundant number of SSR markers become available for genotyping peanut accessions (Hopkins et al., Reference Hopkins, Casa, Wang, Mitchell, Dean, Kochert and Kresovich1999; He et al., Reference He, Meng, Newman, Gao, Pittman and Prakash2003; Ferguson et al., Reference Ferguson, Burow, Schulze, Bramel, Paterson, Kresovich and Mitchell2004; Moretzsohn Mde et al., Reference Moretzsohn Mde, Hopkins, Mitchell, Kresovich, Valls and Ferreira2004). Additionally, previous studies have reported some difficulties in employing markers such as AFLPs, RFLPs and RAPDs that could distinguish cultivated peanut varieties (Kochert et al., Reference Kochert, Halward, Branch and Simpson1991; Subramanian et al., Reference Subramanian, Gurtu, Rao and Nigam2000; Gimenes et al., Reference Gimenes, Lopes and Valls2002; Herselman, Reference Herselman2003). The deficiency of molecular variation in cultivated peanut is somewhat surprising since there is a large range of variation in morphological characters such as seed size, seed coat colour, maturation time and disease resistance (Hopkins et al., Reference Hopkins, Casa, Wang, Mitchell, Dean, Kochert and Kresovich1999). The lack of polymorphic markers has hindered cultivated peanut, in comparison with other crops, being enhanced by molecular techniques such as marker-assisted selection (MAS), resistance gene cloning, genetic mapping and evolutionary studies (He et al., Reference He, Meng, Newman, Gao, Pittman and Prakash2003).
Peanuts are native to South America and are classified in the legume family (Fabaceae) in the genus Arachis, which consists of about 70 species (Krapovickas & Gregory, Reference Krapovickas and Gregory1994). Almost all the wild species are diploid (2n=20) with the exception of A. monticola, while cultivated peanut (Arachis hypogaea L.) is an allotetraploid (2n=4x=40). Arachis hypogaea is further classified into two subspecies (hypogaea and fastigiata) and six botanical varieties (hypogaea, hirsuta, fastigiata, vulgaris, aequatoriana and peruviana) (Krapovickas & Gregory, Reference Krapovickas and Gregory1994). These distinctions are made based on the presence (subsp. fastigiata) or absence (subsp. hypogaea) of flowers on the main axis and various other morphological traits such as growth habit, pod shape and pod reticulation.
The putative ancestral progenitors of cultivated allotetraploid peanuts have been of great interest to breeders and peanut researchers. A. hypogaea's genome is characterized as AABB. The AA genome contains a pair of chromosomes (AA) that are considerably smaller than the other chromosomes, whereas a species characterized with a BB genome lacks these small chromosomes (Moretzsohn Mde et al., Reference Moretzsohn Mde, Hopkins, Mitchell, Kresovich, Valls and Ferreira2004). Currently, it is believed that cultivated peanut originated from a single hybridization event between wild species A. duranensis (AA genome) and A. ipaensis (BB genome) followed by a chromosome duplication to produce an AABB genome (Kochert et al., Reference Kochert, Stalker, Gimenes, Galgaro, Romero Lopez and Moore1996; Hopkins et al., Reference Hopkins, Casa, Wang, Mitchell, Dean, Kochert and Kresovich1999). This hybridization and chromosome duplication event isolated cultivated peanut from sharing genes with its wild relatives, and natural introgression from wild species has not been demonstrated (Hopkins et al., Reference Hopkins, Casa, Wang, Mitchell, Dean, Kochert and Kresovich1999).
The USDA-ARS Plant Genetic Resources Conservation Unit (USDA-ARS PGRCU) maintains a large peanut collection (∼10 000 accessions). A core collection (831 accessions) was constructed to represent the majority of genetic diversity with minimal redundancy (Holbrook et al., Reference Holbrook, Anderson and Pittman1993) and to help researchers evaluate germplasm and screen for traits of interest more efficiently. This core was designed by using information available on country of origin and morphological characters to select approximately 10% of the samples from the entire collection that would maximize genetic diversity. A mini core was subsequently constructed so that traits which are difficult or expensive to measure could be assayed on a small scale (Holbrook & Dong, Reference Holbrook and Dong2005). To date, there have been no published studies on the molecular characterization/diversity of the peanut mini core and only recently have an abundant number of SSR markers became available for researchers to assay genetic diversity in peanut. Therefore, the objectives of this study were to: assay the genetic diversity of the mini core utilizing the M13-tailed SSR method, determine whether SSR markers would produce PCR products in the wild relatives, sequence a few alleles from an SSR marker to determine whether a repeat motif is present in wild peanuts, use molecular and observational data to putatively classify cultivated peanut accessions into subspecies and/or botanical varieties, and determine the relationships between and among various peanut species.
2. Materials and methods
(i) Plant material and DNA extraction
Taxonomic classifications of the peanut accessions used in this study were determined by using GRIN (Germplasm Resources Information Network) taxonomy (http://www.ars-grin.gov/npgs/). Peanut seeds were obtained from the USDA-ARS PGRCU peanut germplasm collection located in Griffin, GA (Table 1). The seeds were germinated by wrapping them in a wet paper towel which was exposed to ethylene gas. Once germinated the seedlings were transferred to 1 gallon (4·5 l) pots filled with soil and allowed to develop for approximately 8 weeks. Young unopened leaves (approximately 100 mg) were harvested from each plant. The leaves were placed in a 2 ml screw-cap microcentrifuge tube with an o-ring along with two 3 mm tungsten carbide beads (Qiagen Valencia, CA). The tissue was pulverized with a Retsch Mixer Mill 301 (Leeds, UK) for 3 min at 30 hertz. All DNA samples were extracted using EZNA Plant DNA kit from Omega Bio-Tek (Doraville, GA). Peanut is a self-pollinated crop and plants within the same accession are uniform. To save greenhouse space, tissues from a single plant were used for DNA extraction. DNA concentration was measured with a DyNA Quant 200 fluorometer purchased from Hoefer Pharmacia Biotech (San Francisco, CA). Samples were also loaded on a 1% agarose gel along with a quantitative marker from Invitrogen (Carlsbad, CA) to confirm DNA concentration obtained with the fluorometer. All samples were subsequently diluted to 10 ng/μl for PCR.
Table 1. Current taxonomic classification for all peanut accessions that were used in this study as determined by GRIN

Identification numbers 1–111 are from the peanut mini core designed by Holbrook & Dong (Reference Holbrook and Dong2005). The remaining samples are botanical varieties and wild accessions. Three accessions do not currently have an assigned PI number.
(ii) M13-tailed SSR method
A M13 primer 5′ CGTTGTAAAACGACGGCCAGT 3′ with 6-FAM covalently bound to the 5′ end for detection on the ABI 377 was purchased from Qiagen (Valencia, CA). The two unlabelled primers in each reaction consisted of a specific SSR-targeting forward primer with a 5′ M13 tail (CGTTGTAAAACGACGGCCAGT) and a specific SSR-targeting reverse primer. All PCR reactions consisted of three primers in which the M13-labelled primer and reverse primer were in excess of the forward primer, which was limited. This allows the forward M13-tailed primer and reverse primer to initiate the reaction and, when the limited primer is depleted, the labelled primer takes the place of the limited forward primer in the remaining PCR cycles (Schuelke, Reference Schuelke2000). Forward and reverse SSR primer sequences (Table 2) were obtained from previously published peanut studies (Hopkins et al., Reference Hopkins, Casa, Wang, Mitchell, Dean, Kochert and Kresovich1999; He et al., Reference He, Meng, Newman, Gao, Pittman and Prakash2003; Ferguson et al., Reference Ferguson, Burow, Schulze, Bramel, Paterson, Kresovich and Mitchell2004; Moretzsohn Mde et al., Reference Moretzsohn Mde, Hopkins, Mitchell, Kresovich, Valls and Ferreira2004).
Table 2. List of primer sequences used in this study
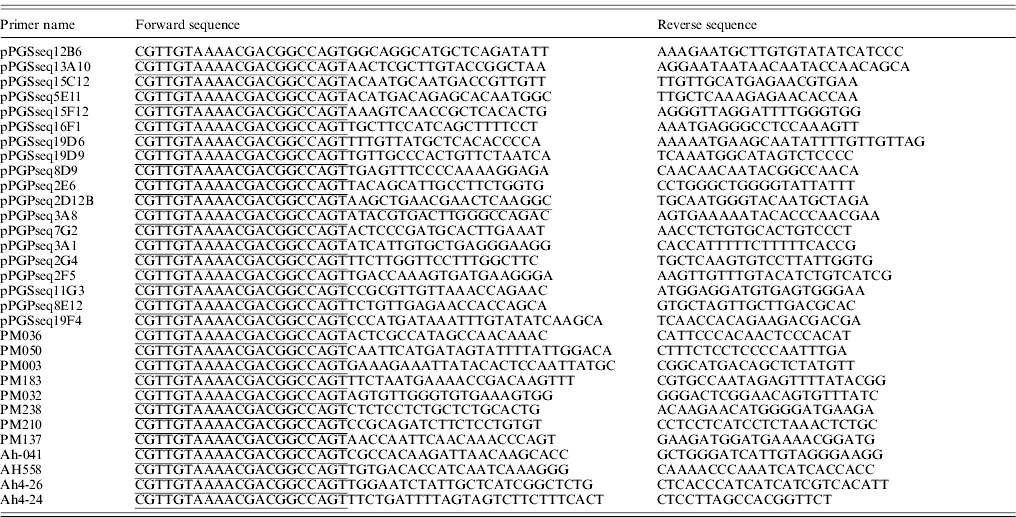
Underlined sequences indicate the 5′ M13 tail.
The PCR reaction consisted of 1× PCR buffer, 1·5 mM MgCl2, 0·2 mM dNTPs, 0·04 units Taq DNA polymerase (Promega Madison, WI), 0·04 μM forward primer, 0·16 μM reverse primer, 0·16 μM M13-labelled primer (Qiagen Valencia, CA), 0·6 ng DNA and dH2O. The total volume of the reaction was 12·5 μl. A few primer sets required additional MgCl2 in the reaction to produce clear uniform bands. A final concentration of 2·25 mM MgCl2 was used for the following primer sets: pPGSseq3A8, pPGSseq3A1, pPGSseq16F1, pPGSseq2F5, pPGSseq2G4, pPGSseq11G3, pPGSseq19F4 and PM210. Primer sets pPGSseq19D9, pPGSseq7G2, pPGSseq8E12 and PM50 had a final concentration of 3 mM MgCl2. All PCR reactions were performed in a Perkin Elmer 9600 thermocycler in a 96-well plate. All primer sets used in this study were amplified using the same cycling conditions. The programme consisted of 1 cycle at 94°C for 5 min for the initial denaturing, 30 cycles of 94°C for 30 s, 56°C for 45 s and 72°C for 45 s, 8 cycles of 94°C for 30 s, 53°C for 45 s and 72°C for 45 s, 1 cycle of 72°C for 10 min for final extension and a 4°C hold for temporal storage.
(iii) PCR product separation
Before loading samples on a gel, PCR products (1·0 μl) were mixed with 1·25 μl loading dye and 0·75 μl of GeneScan 500 TAMRA internal lane standard containing 16 fragments for size analysis (ABI, Foster City, CA) and the samples were denatured at 95°C for 3 min. All PCR products were separated on polyacrylamide gels connected to an ABI 377 Automated DNA Sequencer (Foster City, CA). The gels were 36 cm in length and 0·20 mm thick. Each gel contained 9 g of urea, 2·5 ml of 10× TBE, 2·5 ml Long Ranger Gel Solution (Cambrex Rockland, ME) and water to obtain a final volume of 25 ml. Polymerization occurred by the addition of 125 μl of 10% ammonium persulfate and 17·5 μl of TEMED to the gel solution. The gel was polymerized for 2 h before it was used for electrophoresis.
(iv) Allele sequencing
PCR products were amplified as described above and run on a 3% agarose gel to verify that only a single band was produced. The PCR product was treated with 1 μl of Exonuclease I (10 U/μl) and 1 μl of shrimp alkaline phosphatase (1 U/μl) (GE Healthcare, Piscataway, NJ) for every 12 μl of PCR reaction to digest single-stranded DNA and cleave the 5′ phosphate. The PCR product was also cleaned with a Qiagen PCR cleanup kit (Valencia, CA) to remove excess nucleotides, primers, enzymes and other impurities. Then, 1 μl of the cleaned product was run on an agarose gel with a quantitative marker (Invitrogen Carlsbad, CA) to determine concentration and thus prepare the sample for sequencing. Sequencing reactions were prepared by following the instructions from the DTCS quick start sequencing kit (Beckman Coulter, Fullerton, CA). The sample was sequenced bi-directionally and pUC18 was also sequenced as a positive control. Each sample was sequenced twice to verify fidelity of the sequenced bases. Samples were injected and sequenced on a Beckman CEQ 8000 using the LFR-1 method. The sequence module of the software package CEQ 8000 Genetic Analysis System version 8.0.52 from Beckman was used to call the bases after the sequencing was performed. The forward and reverse strands were aligned using AlignIR version 2.0 (LI-COR, Lincoln, NE).
(v) Data analysis
Gel images were scored and the data were formatted using GeneScan version 3.1.2 and Genotyper version 2.5 (ABI, Foster City, CA). A distance matrix was constructed with Microsat version 1.5 (Minch et al., Reference Minch, Ruiz-Linares, Goldstein, Feldman, Kidd and Cavalli-Sforza1997) using the proportion of shared alleles (D=1−p s) as a genetic distance measure (Bowcock et al., Reference Bowcock, Ruiz-Linares, Tomfohrde, Minch, Kidd and Cavalli-Sforza1994). The distance matrix was imported into the neighbour program part of the software package Phylip (Felsenstein, Reference Felsenstein1996) to construct a neighbour-joining tree and perform bootstrapping. A. ipaensis has diverged from cultivated peanut but is also closely related to cultivated peanut and was therefore chosen as the outgroup in our study. Polymorphic information content (PIC) scores were calculated to determine maker diversity using Botstein's formula:
(Botstein et al., Reference Botstein, White, Skolnick and Davis1980). Botstein originally defined the PIC score as the probability of a given marker being informative in a random mating.
3. Results and discussion
(i) SSR markers and PIC scores
Thirty-one M13-tailed SSR markers were used to assess diversity in a collection of cultivated peanut and some near wild relatives. The number of alleles ranged from 3 to 29 with a mean of 15·4 alleles per locus. A total of 312 alleles were produced in accessions from the mini core, with the alleles per marker ranging from 1 to 20 alleles with a mean of 10·1 alleles per locus. The dinucleotide repeat markers in this data set detected more polymorphisms than the trinucleotide repeat markers, with an average of 17·75 and 14·11 alleles per marker, respectively. PIC scores were calculated for all markers and ranged from 0·083 to 0·911 with a mean of 0·687 (Table 3). The most informative markers in this data set were pPGPseq2G4, pPGPseq2E6 and PM183. The least informative markers were pPGSseq15E11 and pPGSseq12B6.
Table 3. Number of alleles, size range and PIC score obtained with SSR primers for the entire data set and the accessions in the mini core
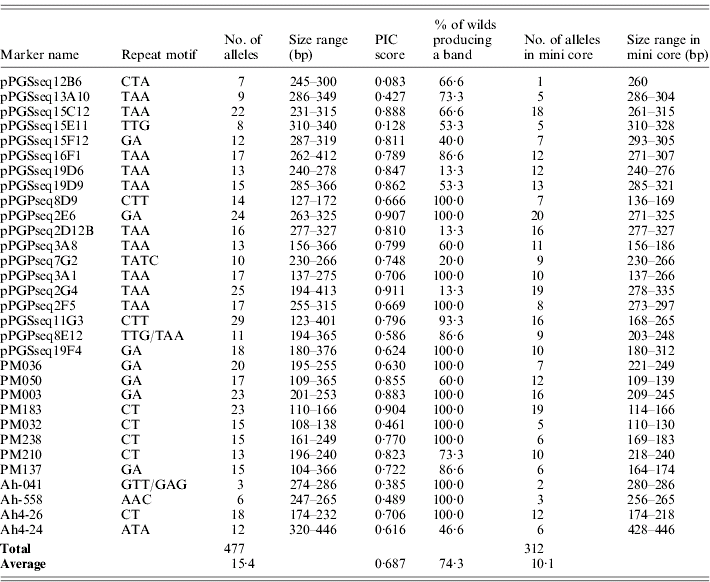
The markers used in this study were originally designed for cultivated peanut (Arachis hypogaea L.) and not for the accessions in this study that are wild relatives, which are classified in nine separate species. On average, 74·3% of the wild accessions produced a PCR product when using these markers. Several of these markers, including pPGSseq19D6, pPGPseq2D12B and pPGPseq2G4, did not produce a PCR product in most of the wild relatives (Table 3) and thus had a low rate of success. However, 13 of the markers transferred and produced a band in all the wild relative accessions in this study. This suggests that these markers may be beneficial in future studies assaying genetic diversity of wild species. Sequencing would need to be preformed to ensure that when transferring these primers to a different species the repeat motif is conserved, since repeat motifs do not always transfer across genus and sometimes species borders (Noor et al., Reference Noor, Kliman and Machado2001; Chen et al., Reference Chen, Cho and McCouch2002; Rossetto et al., Reference Rossetto, McNally and Henry2002).
(ii) Phylogenetic analysis of the peanut mini core
The data from 31 SSR markers were utilized to construct a neighbour-joining tree showing the relationships among the peanut mini core accessions (Fig. 1). The authors are unaware of any reports showing the intraspecific relationships of accessions in the mini core. This was accomplished by calculating a distance matrix based on the proportion of shared alleles for all pairwise combinations. Bootstrapping was performed with 100 replicates and all values greater than 50% were placed on the branches. High bootstrap support was obtained between many of the accessions that clustered closely together; however, low bootstrap support was obtained between the clades. Perhaps with the addition of more SSR markers the bootstrap support may increase; however, the low bootstrap support could also be due to the narrow genetic base of cultivated peanut. Genetic variation in the mini core was obtained using these SSR markers; however, accessions #2 and #3 had identical banding patterns for the 31 markers used in this study, suggesting that these two accessions are genetically similar.
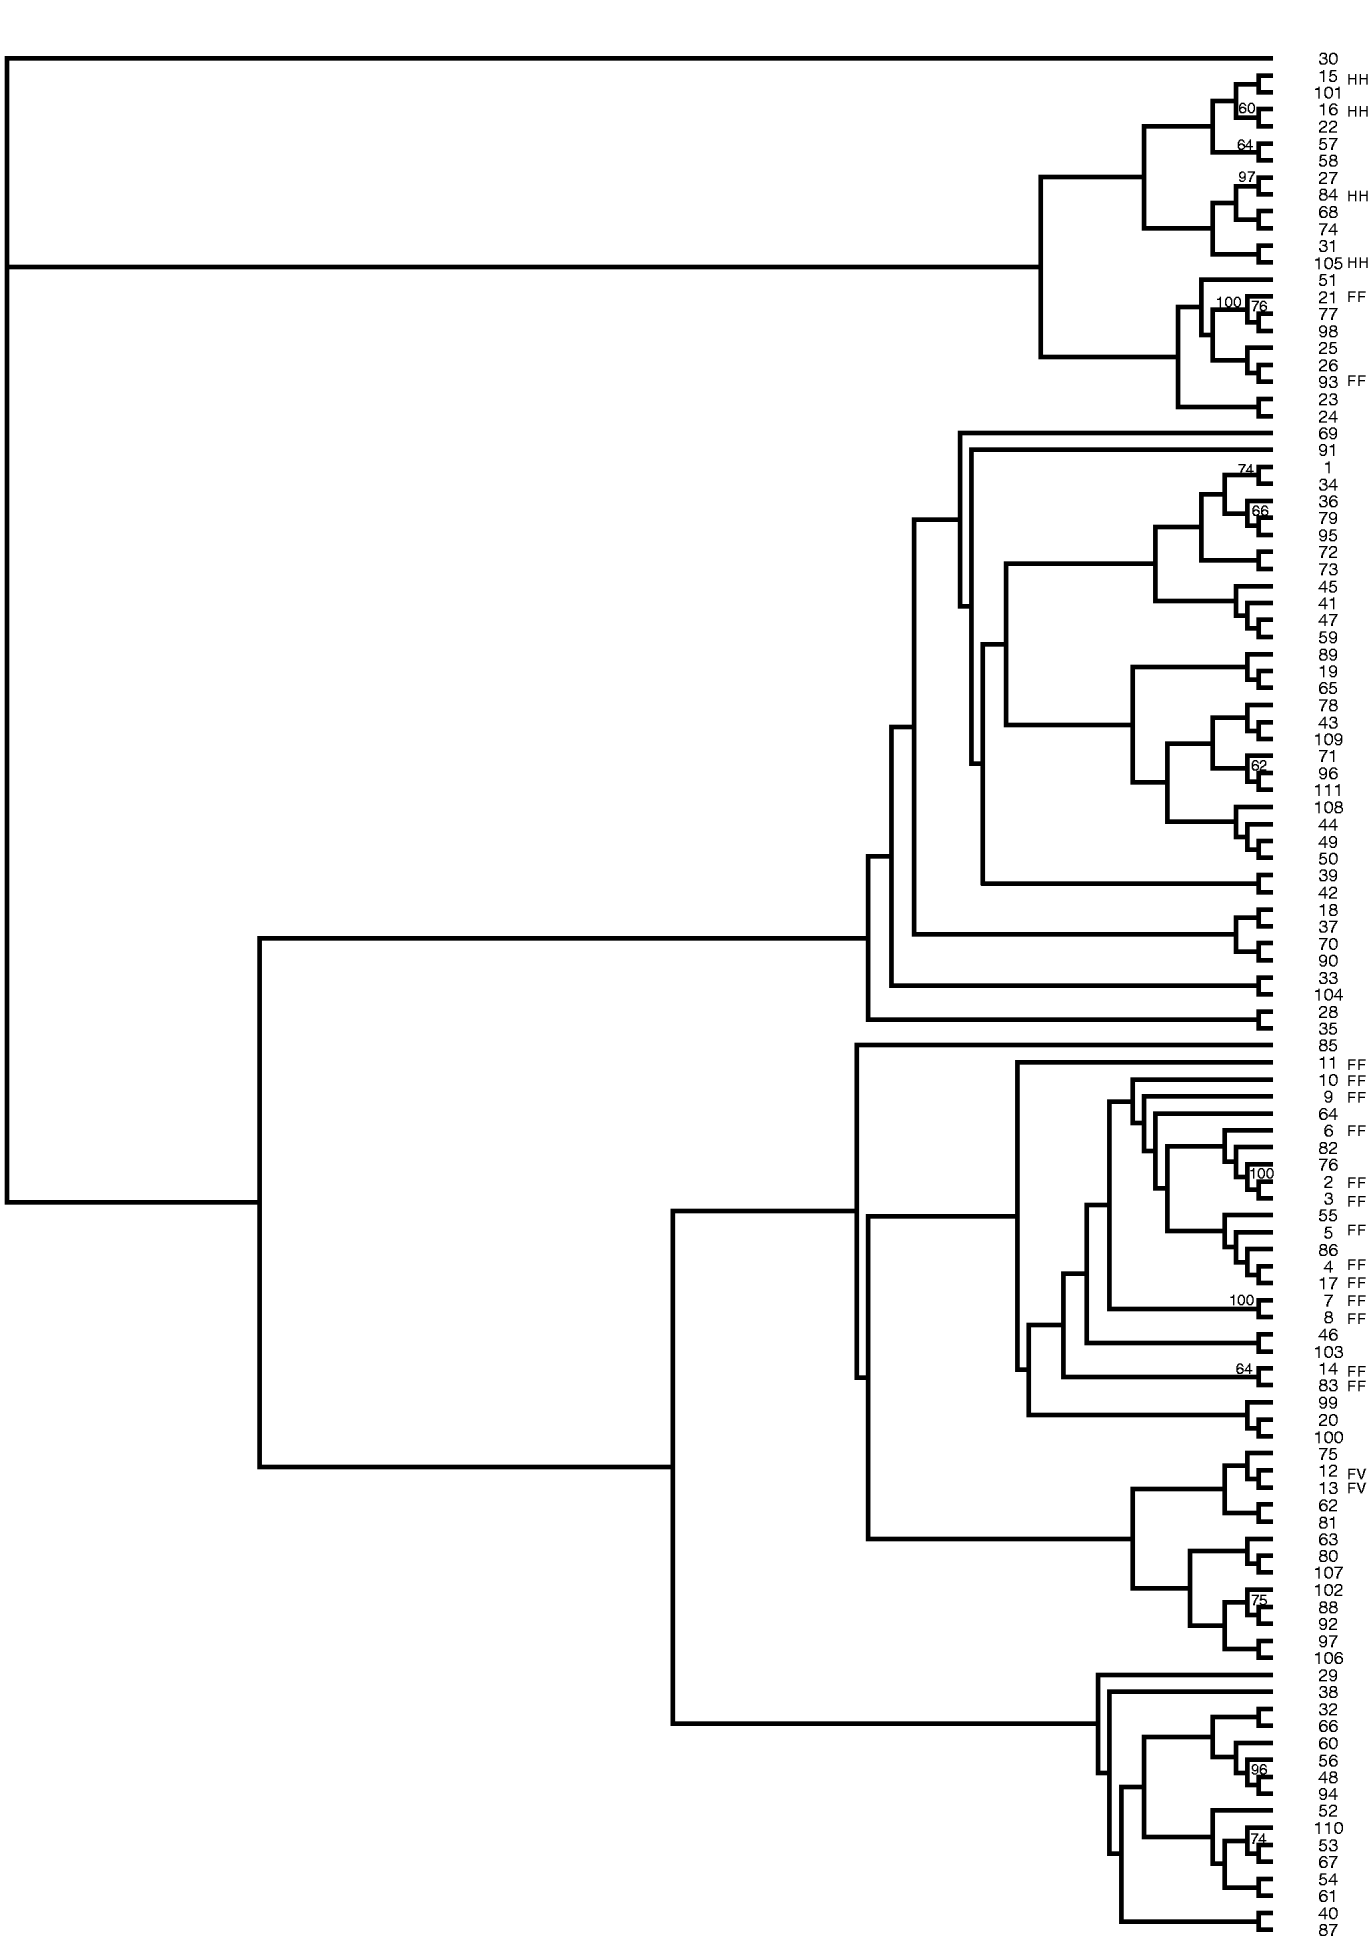
Fig. 1. Neighbour-joining tree of peanut mini core (Arachis hypogaea) generated from SSR data. Bootstrap values greater than 50% are placed on the branches. FF, fastigiata fastigiata; FV, fastigiata vulgaris; HH, hypogaea hypogaea.
Two main clades were produced in this tree. The majority of all the accessions classified as botanical varieties clustered together. This work supports the current taxonomy. Two accessions (#12 and #13) classified as Arachis hypogaea fastigiata vulgaris clustered with one another. All the accessions classified as Arachis hypogaea hypogaea hypogaea clustered together. Lastly, all but two accessions (#21 and #93) of Arachis hypogaea fastigiata fastigiata grouped together. PI 497639 (#21) is currently listed on GRIN (http://www.ars-grin.gov/npgs/) as Arachis hypogaea fastigiata fastigiata but the descriptor data lists this accession as having no flowers on the main axis, a spreading and bunch growth habit, rough pod reticulation, deep strangulation of pods and a pod shape of hirsuta. These morphological observations suggest that #21 may be Arachis hypogaea hypogaea hirsuta and not Arachis hypogaea fastigiata fastigiata. Additionally, #93 PI 476025, which is currently classified as Arachis hypogaea fastigiata fastigiata, has flowers on the main axis, dark green leaves, rough pod reticulation, deep strangulation of pods and was collected in Peru, which would suggest that this accession should be classified in subspecies fastigiata due to the flowers on the main axis but may be var. peruviana or var. aequatoriana rather than var. fastigiata. Both these accessions are now being grown out by the peanut curator to re-examine the descriptor data in detail and determine whether they are possibly misclassified.
(iii) Phylogenetic analysis of botanical varieties and wild relatives
To better understand the interspecific and the intraspecific relationships between the peanut botanical varieties and wild relatives in this data set, a neighbour-joining tree was constructed using the data from the 31 SSR markers with the 35 accessions classified as botanical varieties and the 14 wild relatives (Table 1). The proportion of shared alleles was used to calculate genetic distance between accessions and bootstrapping was performed with 100 replications. All bootstrap values greater than 50% were placed on the tree (Fig. 2). Two main clades were produced consisting of the botanical varieties and the other clade consisted of wild relatives. The clade with the botanical varieties split into two subgroups. The relationships between botanical varieties in this tree were similar to the relationships obtained among botanical varieties in the mini core tree.
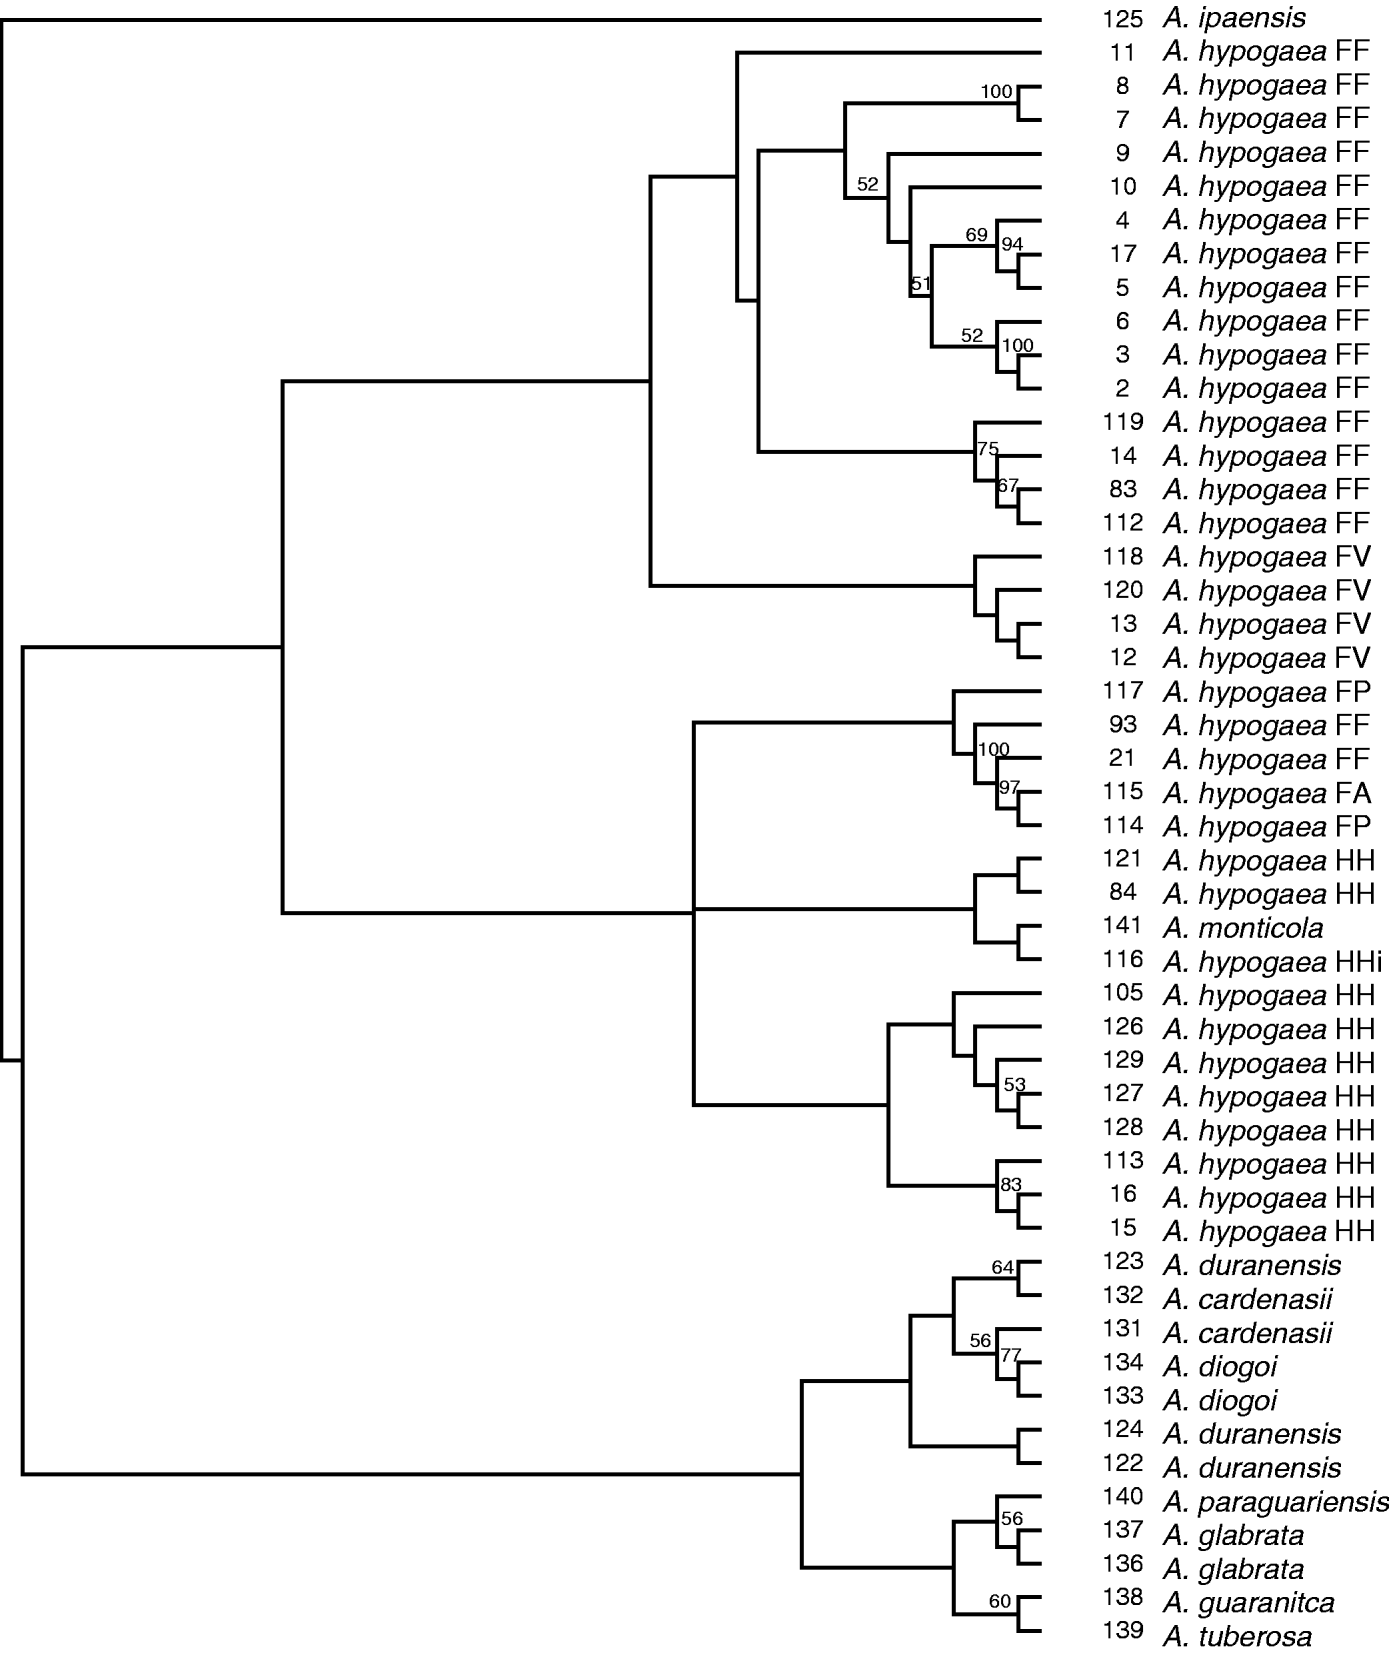
Fig. 2. Neighbour-joining tree of botanical varieties and wild relatives. Bootstrapping was performed with 100 replicates and values greater than 50% were placed on the branches. FF, fastigiata fastigiata; FV, fastigiata vulgaris; FP, fastigiata peruviana; FA, fastigiata aequatoriana; HH, hypogaea hypogaea; Hhi, hypogaea hirsuta.
The first subgroup consisted of all varieties classified as A. hypogaea fastigiata fastigiata except #21 and #93, which appear to be misclassified based on observed morphological data listed on GRIN (discussed previously). Additionally, this subgroup also clustered all four accessions of botanical variety A. hypogaea fastigiata vulgaris together. The relationship in this tree suggests that A. hypogaea fastigiata fastigiata and A. hypogaea fastigiata vulgaris are similar to one another. The second subgroup consisted of all varieties classified as A. hypogaea hypogaea hypogaea, A. hypogaea hypogaea hirsuta, A. hypogaea fastigiata peruviana and A. hypogaea fastigiata aequatoriana. In previous papers, there has been some debate as to the placement of A. hypogaea fastigiata peruviana. Some studies have shown that this variety was more similar to subspecies hypogaea whereas other studies found it more similar to subspecies fastigiata, in which it is currently classified (He & Prakash, Reference He and Prakash2001; Raina et al., Reference Raina, Rani, Kojima, Ogihara, Singh and Devarumath2001; Moretzsohn Mde et al., Reference Moretzsohn Mde, Hopkins, Mitchell, Kresovich, Valls and Ferreira2004). Our study suggests peruviana is more similar to subspecies hypogaea than fastigiata.
The other clade consisted of all the wild relatives except A. monticola. This clade can be divided into two subgroups. The first subgroup consisted of all wild relatives with the A genome (A. duranensis, A. cardenasii and A. diogoi). The second subgroup consists of A. paraguariensis, A. glabrata, A. guaranitca and A. tuberosa. A. monticola did not cluster with the wilds but grouped within the clade consisting of all the botanical varieties, suggesting that it is more closely related to cultivated peanut than the wild relatives. The botanical varieties were removed from this data set and a tree was constructed with just the wild accessions, which produced a tree with the same phylogenetic relationships among the wilds as Fig. 2 except that A. monticola clustered with A. ipaensis as opposed to clustering with cultivated peanut (data not shown).
(iv) Classifying peanuts into subspecies and botanical varieties
Since only 21 of 111 (18·9%) samples in the mini core are classified in botanical varieties, one of the goals of this work was to determine whether the SSR markers would allow us to putatively classify these accessions into subspecies and botanical varieties based on molecular data and GRIN observation data. The data from 31 SSR markers from the botanical varieties and the wilds were used to construct multiple phylogenetic trees by adding a few samples from the mini core of unknown subspecies and botanical varieties to see whether they would cluster with a particular group such as fastigiata fastigiata, fastigiata vulgaris or hypogaea hypogaea. Based on molecular data alone, 11 accessions grouped with fastigiata fastigiata, 24 with fastigiata vulgaris, 43 with hypogaea hypogaea and 13 were questionable (data not shown). The morphological data that are available on GRIN seems to be consistent with the putative subspecies classification based on SSR markers of 40 accessions. Many of these accessions did not have enough morphological data to determine whether this tentative classification may be correct, and they will need to be grown in the field and evaluated further to confirm the putative classification.
(v) Further classifying cultivated and wild peanuts by SSR allele sequencing
To determine whether the simple sequence repeat motif was included in the alleles produced from wild relatives and to examine how these alleles were evolving (stepwise manner or infinite allele model), a few alleles from marker Ah041 were chosen for sequencing. All the wild accessions except A. monticola produced a single band with marker Ah041 and were sequenced (Fig. 3). Three different-sized alleles were chosen for sequencing. The sequence produced from a cultivated peanut (#113) was used to perform a BLAST search (www.ncbi.nlm.nih.gov/BLAST/). The BLAST results showed that the cultivated peanut sequence had high homology to accession DQ099247.1, with 94% identity and an E value of 6e−36. This accession was produced from an Arachis hypogaea clone microsatellite sequence that was used to develop marker Ah041. There were no other sequences in the database from any other organisms that had high homology to the sequenced cultivated peanut microsatellite allele.
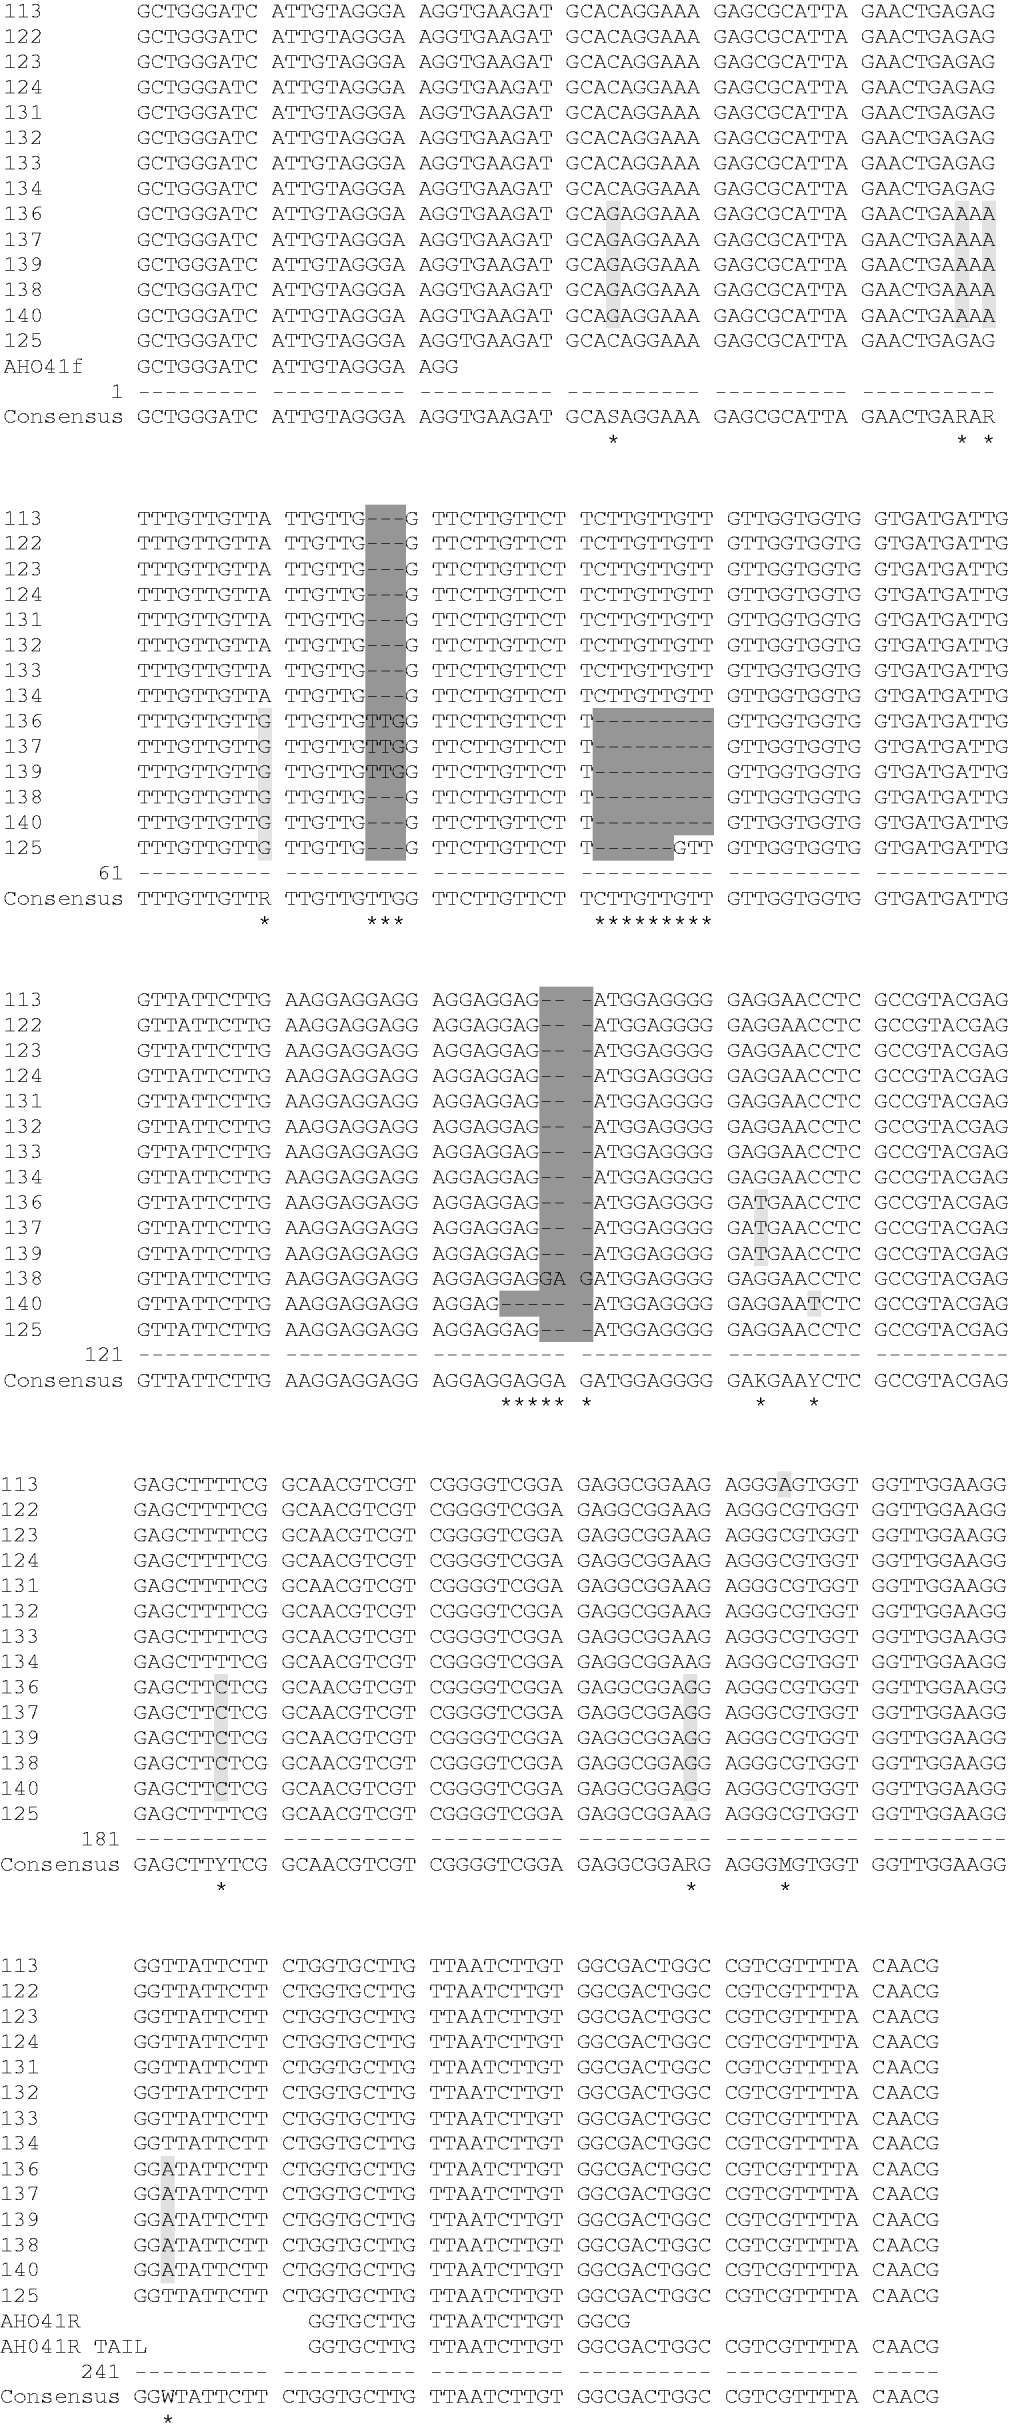
Fig. 3. Sequence alignment of Ah041 microsatellite alleles generated from cultivated and wild peanuts produced by using AlignIR version 2.0.
Several single nucleotide polymorphisms (SNPs) were observed between the alleles sequenced (Fig. 3). In general, the SNPs occurred between A. glabrata, A. guaranitca, A. tuberosa and A. paraguariensis compared with A. hypogaea hypogaea hypogaea, A. duranensis, A. ipaensis, A. cardenasii and A. diogoi. There are six SNPs that separate these species that are considered AA (A. duranensis, A. diogoi, A. cardenasii), BB (A. ipaensis) and AABB (cultivated peanut) genomes from the remaining wild species (A. glabrata, A. guaranitca, A. tuberosa and A. paraguariensis) included in this study. Four of these six SNPs were transitions while the remaining two were transversions. Another SNP (G/T transversion) set apart the two A. glabrata accessions and one A. tuberosa accession from all the other accessions sequenced. Lastly, a SNP (A/C) detected in A. hypogaea hypogaea hypogaea was not seen in any of the other wild accessions sequenced. It is possible that further testing of additional accessions from each of the wild species would allow these SNPs to be used to design new markers to distinguish between wild peanut species.
In all the alleles sequenced the primer attachment sites were conserved with no point mutations or gaps observed when compared with the primer sequences. Additionally, the repeat motif (GTT/GAG) was conserved in all wild accessions sequenced, suggesting that this SSR marker would be suitable to evaluate diversity among various wild accessions. The variation among alleles differed by increments of the repeat motif and insertion/deletions (indels) occurring in regions near the simple sequence repeat. This would suggest that changes in allele size in peanuts are not always due to changes in the length of the repeat motif and thus a stepwise mutation model would not be appropriate for analysing peanut SSR data. Therefore, an infinite allele model or a genetic distance measure that assumes all alleles are equally related, such as the proportion of shared alleles (Bowcock et al., Reference Bowcock, Ruiz-Linares, Tomfohrde, Minch, Kidd and Cavalli-Sforza1994), might be appropriate to analyse a SSR data set in peanut.
(vi) Peanut diversity
In this study, the diversity and phylogenetic relationships of the peanut mini core, botanical varieties and some wild accessions were assessed with 31 previously published SSR markers using the M13-tailed method. The mini core was not as genetically diverse as the entire population, having fewer SSR alleles (312 produced in the mini core and 477 in the total population). This difference in alleles produced is probably due to the inclusion of wild peanuts in this data set that are generally thought to be more genetically diverse than cultivated peanut. However, even though the mini core was less diverse than the entire population, many of the accessions in the mini core were able to be distinguished from one another by using a fairly large number of markers. These SSR markers has helped identify a few accessions (#21, #93) in the mini core that appear to be misclassified based on morphological and molecular data which are currently being evaluated. Clarifying the proper classification of these accessions will help in the curation of the peanut germplasm collection. These markers have also shown that accessions classified as botanical varieties are very similar to each other genetically and phylogenetically, lending further support to their current taxonomy. Using the molecular data and descriptor data from evaluating the morphology of these accessions it is possible that this study will permit more accessions in the mini core to be classified into botanical varieties. Furthermore, sequencing some alleles in wild accessions from marker Ah041 has demonstrated that the simple sequence repeat motif was conserved when transferring across species borders and with further testing this sequence data may allow SNP markers to be produced that help distinguish accessions classified as wild species. Overall, these SSR data have allowed the examination of the diversity and phylogenetic relationships among accessions in the mini core and provided data that will be helpful in the overall collection and utilization in breeding management of this germplasm collection.
Disclaimer: Mention of commercial products in this article does not imply a recommendation or endorsement by the US Department of Agriculture. Trade names are listed solely for the purpose of providing specific information on the means by which data was collected.
We are grateful to Drs Peggy Ozias-Akins and Baozhu Guo for comments and suggestions they made to improve this manuscript. The authors would like to thank colleagues at USDA-ARS PGRCU for reviewing this manuscript. We would also like to thank Ms Regina Estes and Ms Phiffie Vankus for their help in germination and harvesting of the peanut tissue.


