1 Introduction
In fusion devices like tokamaks, radio frequency (RF) electromagnetic waves are generated by antennae near the wall of the device. The launched waves propagate through a turbulent edge plasma region before coupling power to the core plasma for heating and for generating non-inductive currents. The tenuous plasma in the edge is composed of blobs and filamentary structures (see Krasheninnikov Reference Krasheninnikov2001; Grulke et al. Reference Grulke, Terry, LaBombard and Zweben2006; Myra et al. Reference Myra, D’ Ippolito, Stotler, Zweben, LeBlanc, Menard, Maqueda and Boedo2006a ; Myra, Russell & D’ Ippolito Reference Myra, Russell and D’ Ippolito2006b ; Zweben et al. Reference Zweben, Boedo, Grulke, Hidalgo, LaBombard, Maqueda, Scarin and Terry2007; Pigarov, Krasheninnikov & Rognlien Reference Pigarov, Krasheninnikov and Rognlien2012), drift waves and rippling modes (see Ritz et al. Reference Ritz, Bengtson, Levinson and Powers1984), as well as random fluctuations. Various theoretical and computational studies have shown that the propagation characteristics of the RF waves are modified due to their interaction with blobs and filaments (see Ram & Hizanidis Reference Ram and Hizanidis2016; Ioannidis et al. Reference Ioannidis, Ram, Hizanidis and Tigelis2017). The theoretical studies have provided physical insight into the scattering process by constructing analytical solutions to the full-wave equations. However, they are limited in their scope as the composition of the edge plasma is assumed to be either a single spherical blob (see Ram, Hizanidis & Kominis Reference Ram, Hizanidis and Kominis2013) or a single cylindrical filament (see Ram & Hizanidis Reference Ram and Hizanidis2016). However, the edge plasma is a more intricate mixture of blobs and filaments of different shapes and sizes as well as waves like magnetohydrodynamic (MHD) instabilities. For complicated representations of the edge plasma density, one has to use resort to fully computational resources.
There are two approximations that are made in all these studies. First, that the edge plasma is cold so that all thermal effects are ignored. Consequently, only the cold plasma RF waves can propagate in the edge region. Second, that the edge plasma is stationary. This is based on the fact that all time scales associated with the RF waves are much shorter than those associated with the edge turbulence. The time scales for edge turbulence are in the MHD realm – frequencies in the kHz range and fluctuation speeds in the ion-acoustic range. On the other hand, the RF time scales are in the kinetic regime – frequencies ranging from 10s of MHz to 100s of GHz and group speeds near the speed of light. The full-wave studies for RF propagation use the complete complement of Maxwell’s equations in which the plasma permittivity is an anisotropic tensor which is a function of the local density in the edge region. The ambient magnetic field is assumed to be uniform and at arbitrary direction.
Lacking detailed measurements of the plasma density in the edge region, one has to model the effective permittivity based on some assumptions. One possible scheme is based on the generalization of the Maxwell–Garnet homogenization technique (see MacKay & Lakhtakia Reference MacKay and Lakhtakia2015; Bairaktaris et al. Reference Bairaktaris, Papagiannis, Tsironis, Kokkorakis, Hizanidis, Chellais, Alberti, Furno and Ram2017), which assumes some distribution of filamentary structures of random sizes and densities. But there are many different representations of density fluctuations which have been implemented in various studies. In addition, given some representation of the fluctuations, one can use either approximate methods or full-wave methods to determine their effect on RF waves. The approximate methods are generally based on the eikonal Wentzel–Kramers–Brillouin (WKB) solution of Maxwell’s equations.
A WKB ray tracing approach was used to study changes in the wave vectors of the RF waves due to a random distribution of blobs (see Hizanidis et al. Reference Hizanidis, Ram, Kominis and Tsironis2010). In Sysoeva et al. (Reference Sysoeva, da Silva, Gusakov, Heuraux and Popov2015), two analytical models for the ordinary mode propagation through a turbulent edge plasma layer were developed based on the eikonal perturbation method and the weak turbulence theory approach. In Snicker et al. (Reference Snicker, Poli, Maj, Guidi, Kohn, Weber, Conway, Henderson and Saibene2018), RF scattering from turbulent density fluctuations was studied by a Monte Carlo solver (WKBeam) for the kinetic wave equation by use of the integral form of the scattering operator within the Born approximation. There have been several studies using full-wave computational tools. The effect of multiple filamentary structures was studied numerically by solving the full-wave equation within the COMSOL framework (see Ioannidis et al. Reference Ioannidis, Ram, Hizanidis and Tigelis2017). In Kohn et al. (Reference Kohn, Guidi, Holtzhauer, Maj, Snicker and Weber2018), scattering of RF beams from edge density fluctuations was investigated using the WKBeam code and the full-wave code IPF-FDMC, which is the standard two-dimensional finite difference time domain (FDTD) code for isotropic media.
While these previous studies have considered the effect of blobs and filaments, and random fluctuations on RF waves, we are interested in the effect of periodic density interfaces (plasma gratings) on RF waves. This is primarily driven by experimental observations which indicate the presence of drift waves and rippling modes in the edge region (see Ritz et al. Reference Ritz, Bengtson, Levinson and Powers1984). The density interface is at the edge separating the vacuum region in which the antenna structure is located and the turbulent plasma in the edge region and scrape-off layer. The periodic density interface could also be due to the presence of a MHD instability. In order to have a detailed understanding of the effect of such an interface on the scattering of a RF wave, we have developed the full-wave code ScaRF. ScaRF is based on the finite difference frequency domain method (FDFD) (see Smith Reference Smith1996). FDFD solves Maxwell’s equations in the frequency domain. It is a full-wave method and thus describes reflection, refraction and diffraction effects. ScaRF is this work is used not only for the RF scattering analysis of a density interface approximated by a single mode periodic interface (plasma grating), but more generally by an arbitrary profile periodic interface generated as a superposition of spatial harmonics with random weights. In addition the permittivity of the turbulent region is approximated by the aforementioned homogenized anisotropic permittivity tensor. Both permittivities (incidence and turbulent regions) are approximated by the cold plasma ones. To handle these problems, ScaRF uses FDFD formulated for anisotropic media (see Rumpf et al. Reference Rumpf, Garcia, Berry and Barton2014), in conjunction with the total field scattered field (TFSF) method (see Papadopoulos & Glytsis Reference Papadopoulos and Glytsis2014; Rumpf et al. Reference Rumpf, Garcia, Berry and Barton2014), for inserting the RF excitation into the computational grid, the perfect matching layer (PML) absorbing boundary condition (see Oskooi & Johnson Reference Oskooi and Johnson2011), for absorption of irrelevant boundary reflected waves, and Floquet–Bloch–periodic boundary conditions (FBPBC) for the definition of the periodic interface. ScaRF is a three-dimensional code, and thus can model cases of arbitrary magnetic field orientation. In addition it considers general density fluctuations and is not restricted to periodic interfaces. We are not aware of the existence of a similar finite difference (FD) full-wave code for RF-plasma scattering. Other FD codes for plasma scattering are usually time domain codes (FDTD). The advantage of FDFD is that it handles numerical dispersion, anisotropy, incident field definition and periodic boundary conditions more straightforward than FDTD (see Glytsis, Papadopoulos & Koutserimpas Reference Glytsis, Papadopoulos and Koutserimpas2018), in which anisotropy and periodicity could lead in some cases to inaccurate results and instability (see Taflove & Hagness Reference Taflove and Hagness2005). Thus FDFD is ideal for the class of problems ScaRF is designed to solve. It is important to understand that the rippling modes or modulated interfaces exist in the edge region in conjunction with random fluctuations, blobs and filaments. While ScaRF can take any representation of the edge plasma density into account, we are primarily motivated by understanding the effect of density ripples on RF waves. Our study complements previous studies which have dealt with blobs, filaments and random fluctuations. In the future, ScaRF will be used for studying the effect of various representations of the edge density on the propagation of RF waves.
The structure of the paper is organized as follows. In § 2 the geometry of the plasma structure (plasma grating) is presented and the relation of the coordinate system for the microwave diffraction analysis with the magnetic field and plasma coordinate systems in the torus is explained. Next the anisotropic permittivity tensors for cold plasma in the interface regions are derived (see Stix Reference Stix1992). A detailed summary of the FDFD formulation follows. In § 3, the dispersion relation in anisotropic medium is presented which is used to define the modes of the incident plane wave used in the FDFD method in conjunction with the TFSF technique. In § 4 the FDFD numerical results are shown for a sinusoidal plasma grating of various amplitudes and periods, for O and X modes of the incident RF wave and for various interface region contrasts. Finally, the random periodic (containing multiple spatial frequencies) plasma grating is analysed for O and X incident modes. Finally in § 5, the main results and conclusions of this work are summarized.
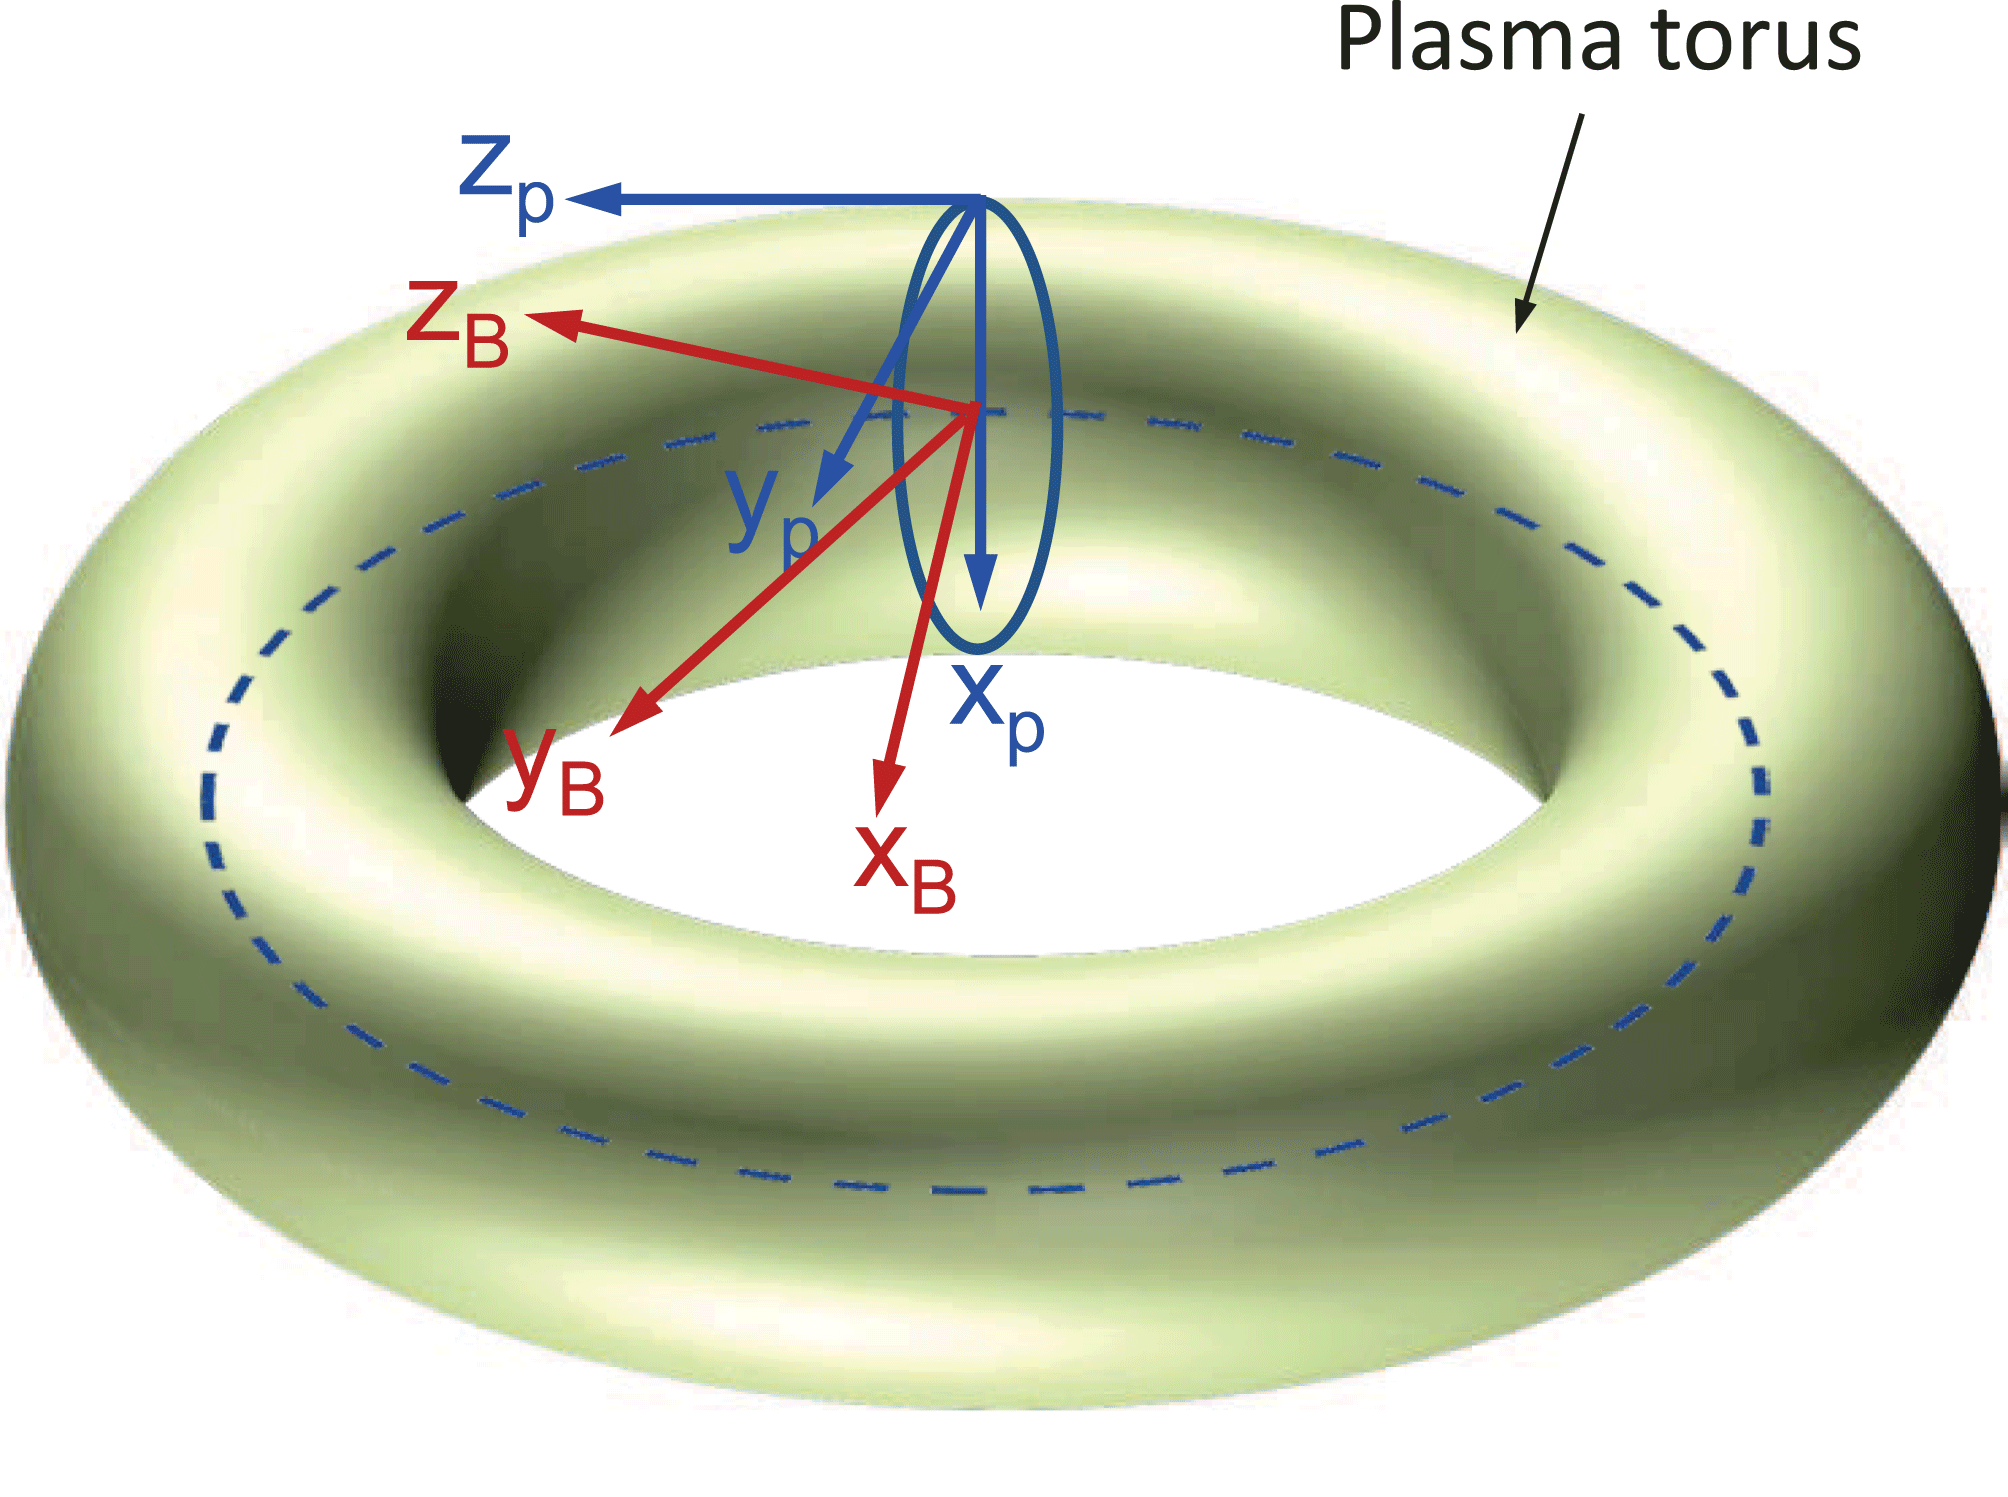
Figure 1. A tokamak plasma torus is shown with the corresponding coordinate systems of interest. The coordinate system
![]() $(x_{B},y_{B},z_{B})$
corresponds to the magnetic flux density,
$(x_{B},y_{B},z_{B})$
corresponds to the magnetic flux density,
![]() $\boldsymbol{B}$
, coordinate system while
$\boldsymbol{B}$
, coordinate system while
![]() $(x_{p},y_{p},z_{p})$
corresponds to the plasma coordinate system. The
$(x_{p},y_{p},z_{p})$
corresponds to the plasma coordinate system. The
![]() $z_{p}$
-component of the magnetic flux density corresponds to the toroidal magnetic flux density component,
$z_{p}$
-component of the magnetic flux density corresponds to the toroidal magnetic flux density component,
![]() $B_{tor}$
, while the
$B_{tor}$
, while the
![]() $x_{p}y_{p}$
-component corresponds to the poloidal magnetic flux density component,
$x_{p}y_{p}$
-component corresponds to the poloidal magnetic flux density component,
![]() $B_{pol}$
.
$B_{pol}$
.
2 Geometrical configurations and the FDFD method
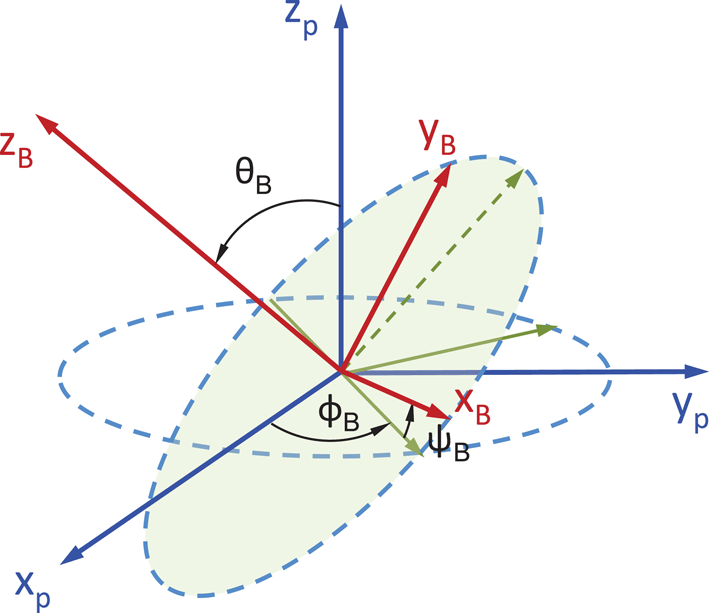
The coordinate system used in the FDFD method for the RF diffraction analysis is based on the simplistic toroidal plasma configuration shown in figure 1, where two different coordinate systems are shown relative to the toroidal plasma configuration. The coordinate system
![]() $(x_{B},y_{B},z_{B})$
corresponds to the magnetic field density coordinate system where the
$(x_{B},y_{B},z_{B})$
corresponds to the magnetic field density coordinate system where the
![]() $z_{B}$
direction corresponds to the direction of the magnetic field (this is the toroidal direction). The
$z_{B}$
direction corresponds to the direction of the magnetic field (this is the toroidal direction). The
![]() $(x_{p},y_{p},z_{p})$
coordinate system corresponds to the plasma coordinate system. Since the toroidal magnetic flux density can have a poloidal component the two coordinate systems could be related via the Euler rotation angles, as represented in figure 2. The Euler angles that connect the two coordinate systems are denoted by
$(x_{p},y_{p},z_{p})$
coordinate system corresponds to the plasma coordinate system. Since the toroidal magnetic flux density can have a poloidal component the two coordinate systems could be related via the Euler rotation angles, as represented in figure 2. The Euler angles that connect the two coordinate systems are denoted by
![]() $\unicode[STIX]{x1D719}_{B}$
,
$\unicode[STIX]{x1D719}_{B}$
,
![]() $\unicode[STIX]{x1D703}_{B}$
and
$\unicode[STIX]{x1D703}_{B}$
and
![]() $\unicode[STIX]{x1D713}_{B}$
and all are measured counter-clockwise, as shown in figure 2. It is straightforward to show that the unit vectors of the two coordinate systems are related by:
$\unicode[STIX]{x1D713}_{B}$
and all are measured counter-clockwise, as shown in figure 2. It is straightforward to show that the unit vectors of the two coordinate systems are related by:
 $$\begin{eqnarray}\displaystyle \left[\begin{array}{@{}c@{}}\hat{\boldsymbol{x}}_{B}\\ \hat{\boldsymbol{y}}_{B}\\ \hat{\boldsymbol{z}}_{B}\end{array}\right]=\left[\begin{array}{@{}ccc@{}}\unicode[STIX]{x1D62E}_{11} & \unicode[STIX]{x1D62E}_{12} & \unicode[STIX]{x1D62E}_{13}\\ \unicode[STIX]{x1D62E}_{21} & \unicode[STIX]{x1D62E}_{22} & \unicode[STIX]{x1D62E}_{23}\\ \unicode[STIX]{x1D62E}_{31} & \unicode[STIX]{x1D62E}_{32} & \unicode[STIX]{x1D62E}_{33}\end{array}\right]\left[\begin{array}{@{}c@{}}\hat{\boldsymbol{x}}_{p}\\ \hat{\boldsymbol{y}}_{p}\\ \hat{\boldsymbol{z}}_{p}\end{array}\right]=\tilde{\unicode[STIX]{x1D648}}\left[\begin{array}{@{}c@{}}\hat{\boldsymbol{x}}_{p}\\ \hat{\boldsymbol{y}}_{p}\\ \hat{\boldsymbol{z}}_{p}\end{array}\right], & & \displaystyle\end{eqnarray}$$
where
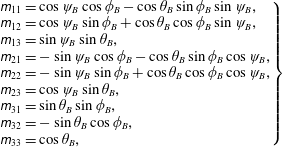 $$\begin{eqnarray}\displaystyle \left.\begin{array}{@{}l@{}}\unicode[STIX]{x1D62E}_{11}=\cos \unicode[STIX]{x1D713}_{B}\cos \unicode[STIX]{x1D719}_{B}-\cos \unicode[STIX]{x1D703}_{B}\sin \unicode[STIX]{x1D719}_{B}\sin \unicode[STIX]{x1D713}_{B},\\ \unicode[STIX]{x1D62E}_{12}=\cos \unicode[STIX]{x1D713}_{B}\sin \unicode[STIX]{x1D719}_{B}+\cos \unicode[STIX]{x1D703}_{B}\cos \unicode[STIX]{x1D719}_{B}\sin \unicode[STIX]{x1D713}_{B},\\ \unicode[STIX]{x1D62E}_{13}=\sin \unicode[STIX]{x1D713}_{B}\sin \unicode[STIX]{x1D703}_{B},\\ \unicode[STIX]{x1D62E}_{21}=-\sin \unicode[STIX]{x1D713}_{B}\cos \unicode[STIX]{x1D719}_{B}-\cos \unicode[STIX]{x1D703}_{B}\sin \unicode[STIX]{x1D719}_{B}\cos \unicode[STIX]{x1D713}_{B},\\ \unicode[STIX]{x1D62E}_{22}=-\sin \unicode[STIX]{x1D713}_{B}\sin \unicode[STIX]{x1D719}_{B}+\cos \unicode[STIX]{x1D703}_{B}\cos \unicode[STIX]{x1D719}_{B}\cos \unicode[STIX]{x1D713}_{B},\\ \unicode[STIX]{x1D62E}_{23}=\cos \unicode[STIX]{x1D713}_{B}\sin \unicode[STIX]{x1D703}_{B},\\ \unicode[STIX]{x1D62E}_{31}=\sin \unicode[STIX]{x1D703}_{B}\sin \unicode[STIX]{x1D719}_{B},\\ \unicode[STIX]{x1D62E}_{32}=-\sin \unicode[STIX]{x1D703}_{B}\cos \unicode[STIX]{x1D719}_{B},\\ \unicode[STIX]{x1D62E}_{33}=\cos \unicode[STIX]{x1D703}_{B},\end{array}\right\} & & \displaystyle\end{eqnarray}$$
and the hatted variables correspond to the unit vectors in the corresponding coordinate system. According to Stix (see Stix Reference Stix1992) the relative permittivity of the cold plasma is given by the following equation in the
![]() $(x_{B},y_{B},z_{B})$
coordinate system:
$(x_{B},y_{B},z_{B})$
coordinate system:
 $$\begin{eqnarray}\displaystyle \tilde{\unicode[STIX]{x1D73A}}_{B}=\left[\begin{array}{@{}ccc@{}}\unicode[STIX]{x1D61A} & -\text{i}\unicode[STIX]{x1D60B} & 0\\ +\text{i}\unicode[STIX]{x1D60B} & \unicode[STIX]{x1D61A} & 0\\ 0 & 0 & \unicode[STIX]{x1D617}\end{array}\right], & & \displaystyle\end{eqnarray}$$
where the needed parameters are defined below:
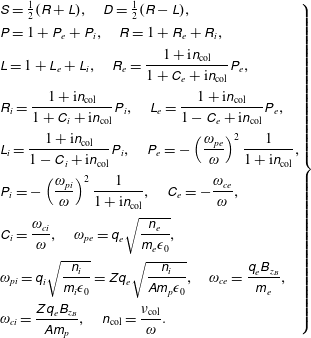 $$\begin{eqnarray}\displaystyle \left.\begin{array}{@{}l@{}}\unicode[STIX]{x1D61A}={\textstyle \frac{1}{2}}(\unicode[STIX]{x1D619}+\unicode[STIX]{x1D613}),\quad \unicode[STIX]{x1D60B}={\textstyle \frac{1}{2}}(\unicode[STIX]{x1D619}-\unicode[STIX]{x1D613}),\\[5.0pt] \unicode[STIX]{x1D617}=1+\unicode[STIX]{x1D617}_{e}+\unicode[STIX]{x1D617}_{i},\quad \unicode[STIX]{x1D619}=1+\unicode[STIX]{x1D619}_{e}+\unicode[STIX]{x1D619}_{i},\\[5.0pt] \unicode[STIX]{x1D613}=1+\unicode[STIX]{x1D613}_{e}+\unicode[STIX]{x1D613}_{i},\quad \unicode[STIX]{x1D619}_{e}={\displaystyle \frac{1+\text{i}\unicode[STIX]{x1D62F}_{\text{col}}}{1+\unicode[STIX]{x1D60A}_{e}+\text{i}\unicode[STIX]{x1D62F}_{\text{col}}}}\unicode[STIX]{x1D617}_{e},\\[12.0pt] \unicode[STIX]{x1D619}_{i}={\displaystyle \frac{1+\text{i}\unicode[STIX]{x1D62F}_{\text{col}}}{1+\unicode[STIX]{x1D60A}_{i}+\text{i}\unicode[STIX]{x1D62F}_{\text{col}}}}\unicode[STIX]{x1D617}_{i},\quad \unicode[STIX]{x1D613}_{e}={\displaystyle \frac{1+\text{i}\unicode[STIX]{x1D62F}_{\text{col}}}{1-\unicode[STIX]{x1D60A}_{e}+\text{i}\unicode[STIX]{x1D62F}_{\text{col}}}}\unicode[STIX]{x1D617}_{e},\\[12.0pt] \unicode[STIX]{x1D613}_{i}={\displaystyle \frac{1+\text{i}\unicode[STIX]{x1D62F}_{\text{col}}}{1-\unicode[STIX]{x1D60A}_{i}+\text{i}\unicode[STIX]{x1D62F}_{\text{col}}}}\unicode[STIX]{x1D617}_{i},\quad \unicode[STIX]{x1D617}_{e}=-\left({\displaystyle \frac{\unicode[STIX]{x1D714}_{pe}}{\unicode[STIX]{x1D714}}}\right)^{2}{\displaystyle \frac{1}{1+\text{i}\unicode[STIX]{x1D62F}_{\text{col}}}},\\[12.0pt] \unicode[STIX]{x1D617}_{i}=-\left({\displaystyle \frac{\unicode[STIX]{x1D714}_{pi}}{\unicode[STIX]{x1D714}}}\right)^{2}{\displaystyle \frac{1}{1+\text{i}\unicode[STIX]{x1D62F}_{\text{col}}}},\quad \unicode[STIX]{x1D60A}_{e}=-{\displaystyle \frac{\unicode[STIX]{x1D714}_{ce}}{\unicode[STIX]{x1D714}}},\\[12.0pt] \unicode[STIX]{x1D60A}_{i}={\displaystyle \frac{\unicode[STIX]{x1D714}_{ci}}{\unicode[STIX]{x1D714}}},\quad \unicode[STIX]{x1D714}_{pe}=\unicode[STIX]{x1D632}_{e}\sqrt{{\displaystyle \frac{\unicode[STIX]{x1D62F}_{e}}{\unicode[STIX]{x1D62E}_{e}\unicode[STIX]{x1D716}_{0}}}},\\[12.0pt] \unicode[STIX]{x1D714}_{pi}=\unicode[STIX]{x1D632}_{i}\sqrt{{\displaystyle \frac{\unicode[STIX]{x1D62F}_{i}}{\unicode[STIX]{x1D62E}_{i}\unicode[STIX]{x1D716}_{0}}}}=\unicode[STIX]{x1D621}\unicode[STIX]{x1D632}_{e}\sqrt{{\displaystyle \frac{\unicode[STIX]{x1D62F}_{i}}{\unicode[STIX]{x1D608}\unicode[STIX]{x1D62E}_{p}\unicode[STIX]{x1D716}_{0}}}},\quad \unicode[STIX]{x1D714}_{ce}={\displaystyle \frac{\unicode[STIX]{x1D632}_{e}\unicode[STIX]{x1D609}_{z_{B}}}{\unicode[STIX]{x1D62E}_{e}}},\\[12.0pt] \unicode[STIX]{x1D714}_{ci}={\displaystyle \frac{\unicode[STIX]{x1D621}\unicode[STIX]{x1D632}_{e}\unicode[STIX]{x1D609}_{z_{B}}}{\unicode[STIX]{x1D608}\unicode[STIX]{x1D62E}_{p}}},\quad \unicode[STIX]{x1D62F}_{\text{col}}={\displaystyle \frac{\unicode[STIX]{x1D708}_{\text{col}}}{\unicode[STIX]{x1D714}}}.\end{array}\right\} & & \displaystyle\end{eqnarray}$$
The variables in the above equations are: the magnitude of the electron charge
![]() $q_{e}$
, the electron rest mass
$q_{e}$
, the electron rest mass
![]() $m_{e}$
, the atomic number
$m_{e}$
, the atomic number
![]() $Z$
, the atomic mass number
$Z$
, the atomic mass number
![]() $A$
, the proton rest mass
$A$
, the proton rest mass
![]() $m_{p}$
, the permittivity of free space
$m_{p}$
, the permittivity of free space
![]() $\unicode[STIX]{x1D716}_{0}$
, the frequency of the electromagnetic radiation
$\unicode[STIX]{x1D716}_{0}$
, the frequency of the electromagnetic radiation
![]() $\unicode[STIX]{x1D714}=2\unicode[STIX]{x03C0}f$
(where
$\unicode[STIX]{x1D714}=2\unicode[STIX]{x03C0}f$
(where
![]() $f$
the frequency in Hz), the electron and ion plasma densities
$f$
the frequency in Hz), the electron and ion plasma densities
![]() $n_{e}$
and
$n_{e}$
and
![]() $n_{i}$
, respectively (in
$n_{i}$
, respectively (in
![]() $\text{m}^{-3}$
), and the electron and ion collision rate
$\text{m}^{-3}$
), and the electron and ion collision rate
![]() $\unicode[STIX]{x1D708}_{col}$
. The frequencies
$\unicode[STIX]{x1D708}_{col}$
. The frequencies
![]() $\unicode[STIX]{x1D714}_{pe}$
and
$\unicode[STIX]{x1D714}_{pe}$
and
![]() $\unicode[STIX]{x1D714}_{pi}$
are the electron and ion plasma resonant frequencies and the
$\unicode[STIX]{x1D714}_{pi}$
are the electron and ion plasma resonant frequencies and the
![]() $\unicode[STIX]{x1D714}_{ce}$
and
$\unicode[STIX]{x1D714}_{ce}$
and
![]() $\unicode[STIX]{x1D714}_{ci}$
are the electron and ion cyclotron frequencies respectively. In this work
$\unicode[STIX]{x1D714}_{ci}$
are the electron and ion cyclotron frequencies respectively. In this work
![]() $\unicode[STIX]{x1D714}_{ce}=7.915\times 10^{11}~\text{rad}~\text{s}^{-1}$
and
$\unicode[STIX]{x1D714}_{ce}=7.915\times 10^{11}~\text{rad}~\text{s}^{-1}$
and
![]() $\unicode[STIX]{x1D714}_{ci}=2.155\times 10^{8}~\text{rad}~\text{s}^{-1}$
. Collisional absorption is not included in the current model, but can be incorporated by modifying the relative permittivity tensor in (2.3). The relative permittivity tensor of (2.3) can be expressed in the plasma coordinate system
$\unicode[STIX]{x1D714}_{ci}=2.155\times 10^{8}~\text{rad}~\text{s}^{-1}$
. Collisional absorption is not included in the current model, but can be incorporated by modifying the relative permittivity tensor in (2.3). The relative permittivity tensor of (2.3) can be expressed in the plasma coordinate system
![]() $(x_{p},y_{p},z_{p})$
using the following transformation
$(x_{p},y_{p},z_{p})$
using the following transformation
where
![]() $\tilde{\unicode[STIX]{x1D73A}}_{B}$
is defined in (2.3) and the Euler angles transformation matrix is defined in (2.1). A possible ripple at the torus plasma surface could cause diffraction of the incident microwave radiation. In order to study this effect a periodic ripple at the plasma torus surface is studied. The geometry is shown in figure 3. The ripple can be defined as
$\tilde{\unicode[STIX]{x1D73A}}_{B}$
is defined in (2.3) and the Euler angles transformation matrix is defined in (2.1). A possible ripple at the torus plasma surface could cause diffraction of the incident microwave radiation. In order to study this effect a periodic ripple at the plasma torus surface is studied. The geometry is shown in figure 3. The ripple can be defined as
where
![]() $h(x)$
is the cosinusoidally varying ripple height and
$h(x)$
is the cosinusoidally varying ripple height and
![]() $\unicode[STIX]{x1D6EC}$
the spatial period of the ripple. The microwave diffraction is analysed in the
$\unicode[STIX]{x1D6EC}$
the spatial period of the ripple. The microwave diffraction is analysed in the
![]() $(x,y,z)$
coordinate system that is related to the plasma coordinate system
$(x,y,z)$
coordinate system that is related to the plasma coordinate system
![]() $(x_{p},y_{p},z_{p})$
as follows:
$(x_{p},y_{p},z_{p})$
as follows:
 $$\begin{eqnarray}\displaystyle \left[\begin{array}{@{}c@{}}\hat{\boldsymbol{x}}\\ \hat{\boldsymbol{y}}\\ \hat{\boldsymbol{z}}\end{array}\right]=\left[\begin{array}{@{}ccc@{}}0 & 1 & 0\\ 0 & 0 & 1\\ 1 & 0 & 0\end{array}\right]\left[\begin{array}{@{}c@{}}\hat{\boldsymbol{x}}_{p}\\ \hat{\boldsymbol{y}}_{p}\\ \hat{\boldsymbol{z}}_{p}\end{array}\right]=\tilde{\unicode[STIX]{x1D64C}}\left[\begin{array}{@{}c@{}}\hat{\boldsymbol{x}}_{p}\\ \hat{\boldsymbol{y}}_{p}\\ \hat{\boldsymbol{z}}_{p}\end{array}\right], & & \displaystyle\end{eqnarray}$$
where the hatted variables are the unit vectors along the corresponding axes, respectively. The incident microwave radiation is modelled as a plane wave with an azimuthal angle of incidence
![]() $\unicode[STIX]{x1D719}$
and a polar angle of incidence
$\unicode[STIX]{x1D719}$
and a polar angle of incidence
![]() $\unicode[STIX]{x1D703}$
(as shown in figure 3). The regions above and below the periodic ripple correspond to plasma regions of different plasma densities. Their tensor relative permittivities
$\unicode[STIX]{x1D703}$
(as shown in figure 3). The regions above and below the periodic ripple correspond to plasma regions of different plasma densities. Their tensor relative permittivities
![]() $\tilde{\unicode[STIX]{x1D73A}}_{l,p}$
can be determined by suitable use of (2.5) in the plasma coordinate system. Then the relative permittivities
$\tilde{\unicode[STIX]{x1D73A}}_{l,p}$
can be determined by suitable use of (2.5) in the plasma coordinate system. Then the relative permittivities
![]() $\tilde{\unicode[STIX]{x1D73A}}_{1}$
and
$\tilde{\unicode[STIX]{x1D73A}}_{1}$
and
![]() $\tilde{\unicode[STIX]{x1D73A}}_{2}$
needed for the diffraction analysis in the
$\tilde{\unicode[STIX]{x1D73A}}_{2}$
needed for the diffraction analysis in the
![]() $(x,y,z)$
coordinate system can be found from
$(x,y,z)$
coordinate system can be found from
Next the FDFD method is formulated in the
![]() $(x,y,z)$
coordinate system that will be used in the analysis of the plasma grating of figure 3, with FBPBC in the
$(x,y,z)$
coordinate system that will be used in the analysis of the plasma grating of figure 3, with FBPBC in the
![]() $xy$
plane and PML in
$xy$
plane and PML in
![]() $xy$
planes parallel to the
$xy$
planes parallel to the
![]() $z$
axis. FDFD solves Maxwell’s equations in the frequency domain. It is a rigorous and stable method of known error sources (see Smith Reference Smith1996; Sadiku Reference Sadiku2001; Taflove & Hagness Reference Taflove and Hagness2005) that can model systems of complex geometry and can be applied in parallel for computationally demanding problems. In FDFD finite differences are used to approximate Maxwell’s equations, leading to a large linear algebraic system, whose solution provides the electromagnetic fields in space. In particular after normalizing the magnetic field according to
$z$
axis. FDFD solves Maxwell’s equations in the frequency domain. It is a rigorous and stable method of known error sources (see Smith Reference Smith1996; Sadiku Reference Sadiku2001; Taflove & Hagness Reference Taflove and Hagness2005) that can model systems of complex geometry and can be applied in parallel for computationally demanding problems. In FDFD finite differences are used to approximate Maxwell’s equations, leading to a large linear algebraic system, whose solution provides the electromagnetic fields in space. In particular after normalizing the magnetic field according to
![]() $\tilde{\boldsymbol{H}}\equiv -\text{i}Z_{0}\boldsymbol{H}$
, where
$\tilde{\boldsymbol{H}}\equiv -\text{i}Z_{0}\boldsymbol{H}$
, where
![]() $Z_{0}$
is the free space impedance and
$Z_{0}$
is the free space impedance and
![]() $\text{i}$
is
$\text{i}$
is
![]() $\sqrt{-1}$
, Maxwell’s equations with the wave-absorbing PML layer truncating the computational grid, become:
$\sqrt{-1}$
, Maxwell’s equations with the wave-absorbing PML layer truncating the computational grid, become:
where
![]() $[\tilde{\unicode[STIX]{x1D750}}]\equiv \unicode[STIX]{x1D645}[\unicode[STIX]{x1D750}]\unicode[STIX]{x1D645}^{\text{T}}/\text{det}(\unicode[STIX]{x1D645})$
and
$[\tilde{\unicode[STIX]{x1D750}}]\equiv \unicode[STIX]{x1D645}[\unicode[STIX]{x1D750}]\unicode[STIX]{x1D645}^{\text{T}}/\text{det}(\unicode[STIX]{x1D645})$
and
![]() $[\tilde{\unicode[STIX]{x1D741}}]\equiv \unicode[STIX]{x1D645}[\unicode[STIX]{x1D741}]\unicode[STIX]{x1D645}^{\text{T}}/\text{det}(\unicode[STIX]{x1D645})$
are relative permittivity and permeability tensors, defined so as to implement the PML for anisotropic media, (see Oskooi & Johnson Reference Oskooi and Johnson2011), where
$[\tilde{\unicode[STIX]{x1D741}}]\equiv \unicode[STIX]{x1D645}[\unicode[STIX]{x1D741}]\unicode[STIX]{x1D645}^{\text{T}}/\text{det}(\unicode[STIX]{x1D645})$
are relative permittivity and permeability tensors, defined so as to implement the PML for anisotropic media, (see Oskooi & Johnson Reference Oskooi and Johnson2011), where
![]() $\unicode[STIX]{x1D645}\equiv \text{diag}(\unicode[STIX]{x1D634}_{x}^{-1},\unicode[STIX]{x1D634}_{y}^{-1},\unicode[STIX]{x1D634}_{z}^{-1})$
and
$\unicode[STIX]{x1D645}\equiv \text{diag}(\unicode[STIX]{x1D634}_{x}^{-1},\unicode[STIX]{x1D634}_{y}^{-1},\unicode[STIX]{x1D634}_{z}^{-1})$
and
![]() $\unicode[STIX]{x1D634}_{w}\equiv \unicode[STIX]{x1D705}_{w}+\text{i}(\unicode[STIX]{x1D70E}_{w}/\unicode[STIX]{x1D714})$
,
$\unicode[STIX]{x1D634}_{w}\equiv \unicode[STIX]{x1D705}_{w}+\text{i}(\unicode[STIX]{x1D70E}_{w}/\unicode[STIX]{x1D714})$
,
![]() $w=\{x,y,z\}$
are the PML stretching factors with
$w=\{x,y,z\}$
are the PML stretching factors with
![]() $\unicode[STIX]{x1D705}_{w}\geqslant 1$
the evanescent wave absorption parameter, and
$\unicode[STIX]{x1D705}_{w}\geqslant 1$
the evanescent wave absorption parameter, and
![]() $\unicode[STIX]{x1D70E}_{w}$
the PML conductivity. The parameters of the stretching factors are polynomials (see Oskooi & Johnson Reference Oskooi and Johnson2011) spatially varying along the
$\unicode[STIX]{x1D70E}_{w}$
the PML conductivity. The parameters of the stretching factors are polynomials (see Oskooi & Johnson Reference Oskooi and Johnson2011) spatially varying along the
![]() $w$
direction. It is convenient to simplify Maxwell’s equations (2.9)–(2.10) by normalizing the grid coordinates as
$w$
direction. It is convenient to simplify Maxwell’s equations (2.9)–(2.10) by normalizing the grid coordinates as
![]() $\tilde{w}=k_{0}w$
,
$\tilde{w}=k_{0}w$
,
![]() $w=\{x,y,z\}$
, which leads to:
$w=\{x,y,z\}$
, which leads to:
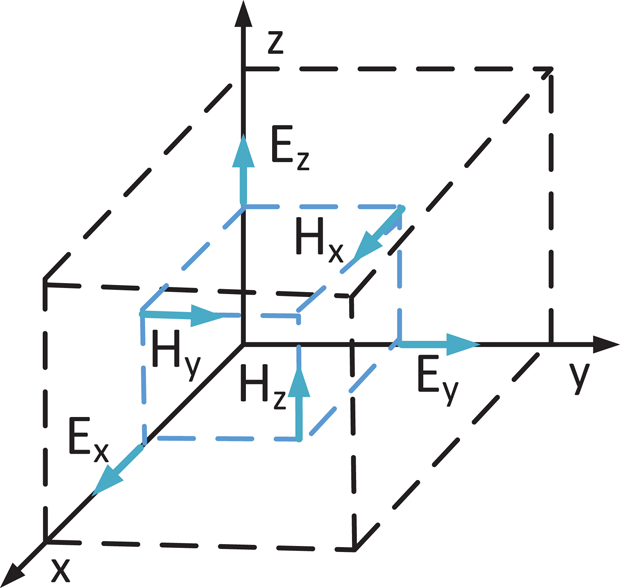
In the FDFD method the discretization of (2.11)–(2.16) is done by approximating spatial derivatives using central differences, assuming that fields are placed on the Yee cell as shown in figure 4, and permittivity and permeability tensors elements
![]() $\tilde{\unicode[STIX]{x1D716}}_{mn}$
,
$\tilde{\unicode[STIX]{x1D716}}_{mn}$
,
![]() $\tilde{\unicode[STIX]{x1D707}}_{mn}$
(
$\tilde{\unicode[STIX]{x1D707}}_{mn}$
(
![]() $m,n=\{x,y,z\}$
) are placed at the same grid point as the
$m,n=\{x,y,z\}$
) are placed at the same grid point as the
![]() $E_{n}$
and
$E_{n}$
and
![]() $\tilde{H}_{n}$
fields respectively. In the resulting finite difference equations each term must exist at the same point on the Yee grid. In order to satisfy this rule the terms containing off-diagonal tensor elements in (2.11)–(2.16) are linearly interpolated to the correct grid points by using interpolation matrices
$\tilde{H}_{n}$
fields respectively. In the resulting finite difference equations each term must exist at the same point on the Yee grid. In order to satisfy this rule the terms containing off-diagonal tensor elements in (2.11)–(2.16) are linearly interpolated to the correct grid points by using interpolation matrices
![]() $\unicode[STIX]{x1D64D}_{w}^{-}$
,
$\unicode[STIX]{x1D64D}_{w}^{-}$
,
![]() $\unicode[STIX]{x1D64D}_{w}^{+}$
, which averages the grids points along the direction
$\unicode[STIX]{x1D64D}_{w}^{+}$
, which averages the grids points along the direction
![]() $w=\{x,y,z\}$
, with the next (
$w=\{x,y,z\}$
, with the next (
![]() $+$
) or previous (
$+$
) or previous (
![]() $-$
) grid points. Eventually the discrete form is (2.11)–(2.12) is:
$-$
) grid points. Eventually the discrete form is (2.11)–(2.12) is:
where
![]() $\unicode[STIX]{x1D63F}_{w}^{e}$
,
$\unicode[STIX]{x1D63F}_{w}^{e}$
,
![]() $\unicode[STIX]{x1D63F}_{w}^{h}$
are derivative matrices, and
$\unicode[STIX]{x1D63F}_{w}^{h}$
are derivative matrices, and
![]() $\boldsymbol{e}_{w}$
,
$\boldsymbol{e}_{w}$
,
![]() $\tilde{\boldsymbol{h}}_{w}$
are vectors containing electric and magnetic field values respectively, at discrete spatial points, in the direction
$\tilde{\boldsymbol{h}}_{w}$
are vectors containing electric and magnetic field values respectively, at discrete spatial points, in the direction
![]() $w=\{x,y,z\}$
and
$w=\{x,y,z\}$
and
![]() $\tilde{\unicode[STIX]{x1D741}^{\prime }}_{mn}$
,
$\tilde{\unicode[STIX]{x1D741}^{\prime }}_{mn}$
,
![]() $\tilde{\unicode[STIX]{x1D750}^{\prime }}_{mn}$
,
$\tilde{\unicode[STIX]{x1D750}^{\prime }}_{mn}$
,
![]() $(m,n=\{x,y,z\})$
are diagonal matrices containing the relevant tensor elements of the grid along their diagonals. Equations (2.17)–(2.22) are simplified by redefining the permittivity and permeability diagonal tensors,
$(m,n=\{x,y,z\})$
are diagonal matrices containing the relevant tensor elements of the grid along their diagonals. Equations (2.17)–(2.22) are simplified by redefining the permittivity and permeability diagonal tensors,
![]() $\tilde{\unicode[STIX]{x1D750}^{\prime }}_{mn}$
,
$\tilde{\unicode[STIX]{x1D750}^{\prime }}_{mn}$
,
![]() $\tilde{\unicode[STIX]{x1D741}^{\prime }}_{mn}$
, so as to include the interpolation matrices according to:
$\tilde{\unicode[STIX]{x1D741}^{\prime }}_{mn}$
, so as to include the interpolation matrices according to:
Then (2.17)–(2.22) are equivalent to the linear system:
 $$\begin{eqnarray}\displaystyle & \displaystyle \unicode[STIX]{x1D63E}^{e}\equiv \left[\begin{array}{@{}ccc@{}}\mathbf{0} & -\unicode[STIX]{x1D63F}_{z}^{e} & \unicode[STIX]{x1D63F}_{y}^{e}\\ \unicode[STIX]{x1D63F}_{z}^{e} & \mathbf{0} & -\unicode[STIX]{x1D63F}_{x}^{e}\\ -\unicode[STIX]{x1D63F}_{y}^{e} & \unicode[STIX]{x1D63F}_{x}^{e} & \mathbf{0}\end{array}\right], & \displaystyle\end{eqnarray}$$
 $$\begin{eqnarray}\displaystyle & \displaystyle \unicode[STIX]{x1D63E}^{h}\equiv \left[\begin{array}{@{}ccc@{}}\mathbf{0} & -\unicode[STIX]{x1D63F}_{z}^{h} & \unicode[STIX]{x1D63F}_{y}^{h}\\ \unicode[STIX]{x1D63F}_{z}^{h} & \mathbf{0} & -\unicode[STIX]{x1D63F}_{x}^{h}\\ -\unicode[STIX]{x1D63F}_{y}^{h} & \unicode[STIX]{x1D63F}_{x}^{h} & \mathbf{0}\end{array}\right], & \displaystyle\end{eqnarray}$$
![]() $\boldsymbol{e}\equiv [\boldsymbol{e}_{x},\boldsymbol{e}_{y},\boldsymbol{e}_{x}]^{\text{T}}$
and
$\boldsymbol{e}\equiv [\boldsymbol{e}_{x},\boldsymbol{e}_{y},\boldsymbol{e}_{x}]^{\text{T}}$
and
![]() $\tilde{\boldsymbol{h}}\equiv [\tilde{\boldsymbol{h}}_{x},\tilde{\boldsymbol{h}}_{y},\tilde{\boldsymbol{h}}_{x}]^{\text{T}}$
. Since the right-hand side of (2.25) is zero no meaningful solution exists. A non-zero right-hand side of (2.25) is generated by introducing the plane wave excitation in the computational grid by use of the total field/scattered field (TFSF) technique. In the TFSF method, a boundary
$\tilde{\boldsymbol{h}}\equiv [\tilde{\boldsymbol{h}}_{x},\tilde{\boldsymbol{h}}_{y},\tilde{\boldsymbol{h}}_{x}]^{\text{T}}$
. Since the right-hand side of (2.25) is zero no meaningful solution exists. A non-zero right-hand side of (2.25) is generated by introducing the plane wave excitation in the computational grid by use of the total field/scattered field (TFSF) technique. In the TFSF method, a boundary
![]() $S$
is defined separating the computational domain into regions where only total fields exist and regions where only scattered fields exits. The TFSF interface for the plasma grating in figure 3 is parallel to the
$S$
is defined separating the computational domain into regions where only total fields exist and regions where only scattered fields exits. The TFSF interface for the plasma grating in figure 3 is parallel to the
![]() $xy$
plane. To apply the TFSF method, the incident source electric (
$xy$
plane. To apply the TFSF method, the incident source electric (
![]() $\boldsymbol{e}_{\text{src}}\equiv [\boldsymbol{e}_{x,\text{src}},\boldsymbol{e}_{y,\text{src}},\boldsymbol{e}_{y,\text{src}}]^{\text{T}}$
) and magnetic (
$\boldsymbol{e}_{\text{src}}\equiv [\boldsymbol{e}_{x,\text{src}},\boldsymbol{e}_{y,\text{src}},\boldsymbol{e}_{y,\text{src}}]^{\text{T}}$
) and magnetic (
![]() $\tilde{\boldsymbol{h}}_{\text{src}}\equiv [\tilde{\boldsymbol{h}}_{x,\text{src}},\tilde{\boldsymbol{h}}_{y,\text{src}},\tilde{\boldsymbol{h}}_{y,\text{src}}]^{\text{T}}$
) fields, propagating in the anisotropic medium, free of scatterers (with only the background present), should be known. This information is available and is given by (3.5)–(3.7), as described in detail in § 3. Then the right-hand side of (2.25),
$\tilde{\boldsymbol{h}}_{\text{src}}\equiv [\tilde{\boldsymbol{h}}_{x,\text{src}},\tilde{\boldsymbol{h}}_{y,\text{src}},\tilde{\boldsymbol{h}}_{y,\text{src}}]^{\text{T}}$
) fields, propagating in the anisotropic medium, free of scatterers (with only the background present), should be known. This information is available and is given by (3.5)–(3.7), as described in detail in § 3. Then the right-hand side of (2.25),
![]() $\boldsymbol{b}$
is given by:
$\boldsymbol{b}$
is given by:
where
![]() $\unicode[STIX]{x1D64C}_{w}^{e}$
or
$\unicode[STIX]{x1D64C}_{w}^{e}$
or
![]() $\unicode[STIX]{x1D64C}_{w}^{h}$
are diagonal matrices operating on the electric or magnetic field source vector, in the direction
$\unicode[STIX]{x1D64C}_{w}^{h}$
are diagonal matrices operating on the electric or magnetic field source vector, in the direction
![]() $w=\{x,y,z\}$
. These
$w=\{x,y,z\}$
. These
![]() $\unicode[STIX]{x1D64C}_{w}^{e}$
,
$\unicode[STIX]{x1D64C}_{w}^{e}$
,
![]() $\unicode[STIX]{x1D64C}_{w}^{h}$
matrices have
$\unicode[STIX]{x1D64C}_{w}^{h}$
matrices have
![]() $1$
or
$1$
or
![]() $0$
in the diagonal if they act on a source field node that belongs to the scattered or to the total field region respectively. Then the electric and magnetic fields are obtained everywhere in the computational domain, from the solution of the linear system
$0$
in the diagonal if they act on a source field node that belongs to the scattered or to the total field region respectively. Then the electric and magnetic fields are obtained everywhere in the computational domain, from the solution of the linear system
![]() $\unicode[STIX]{x1D63C}[\boldsymbol{e},~\tilde{\boldsymbol{h}}]^{\text{T}}=\boldsymbol{b}$
.
$\unicode[STIX]{x1D63C}[\boldsymbol{e},~\tilde{\boldsymbol{h}}]^{\text{T}}=\boldsymbol{b}$
.
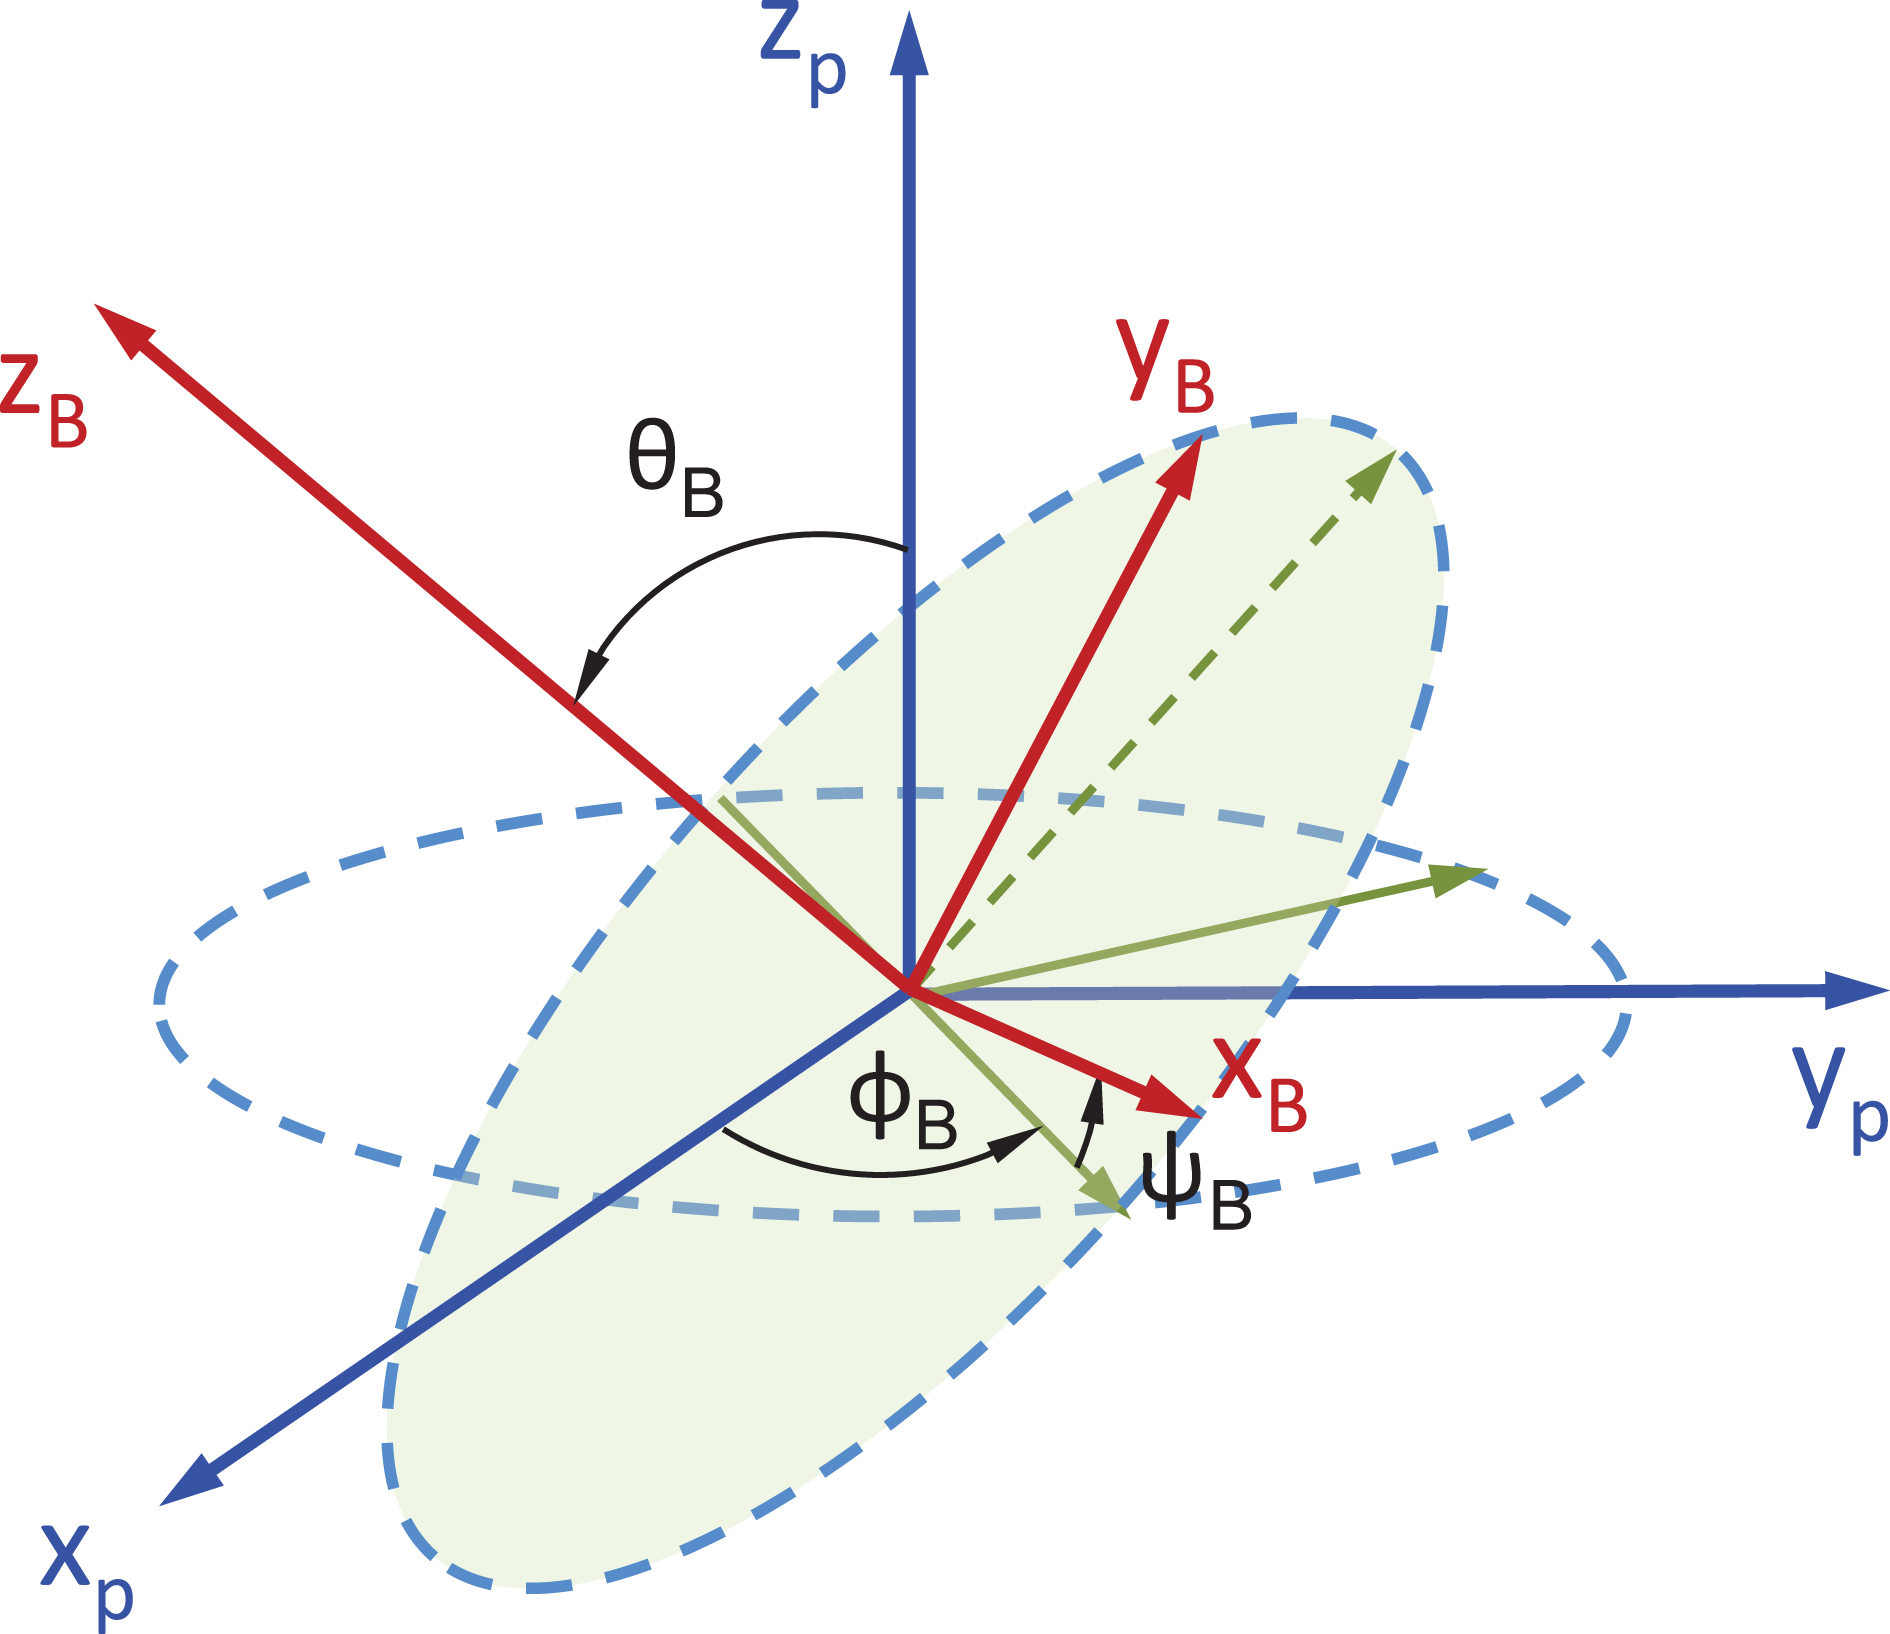
Figure 2. The relation between the
![]() $(x_{B},y_{B},z_{B})$
and the
$(x_{B},y_{B},z_{B})$
and the
![]() $(x_{p},y_{p},z_{p})$
coordinate systems. The angles
$(x_{p},y_{p},z_{p})$
coordinate systems. The angles
![]() $\unicode[STIX]{x1D719}_{B}$
,
$\unicode[STIX]{x1D719}_{B}$
,
![]() $\unicode[STIX]{x1D703}_{B}$
and
$\unicode[STIX]{x1D703}_{B}$
and
![]() $\unicode[STIX]{x1D713}_{B}$
are the Euler angles that connect the two coordinate systems. All the angles are defined with positive as counter-clockwise.
$\unicode[STIX]{x1D713}_{B}$
are the Euler angles that connect the two coordinate systems. All the angles are defined with positive as counter-clockwise.
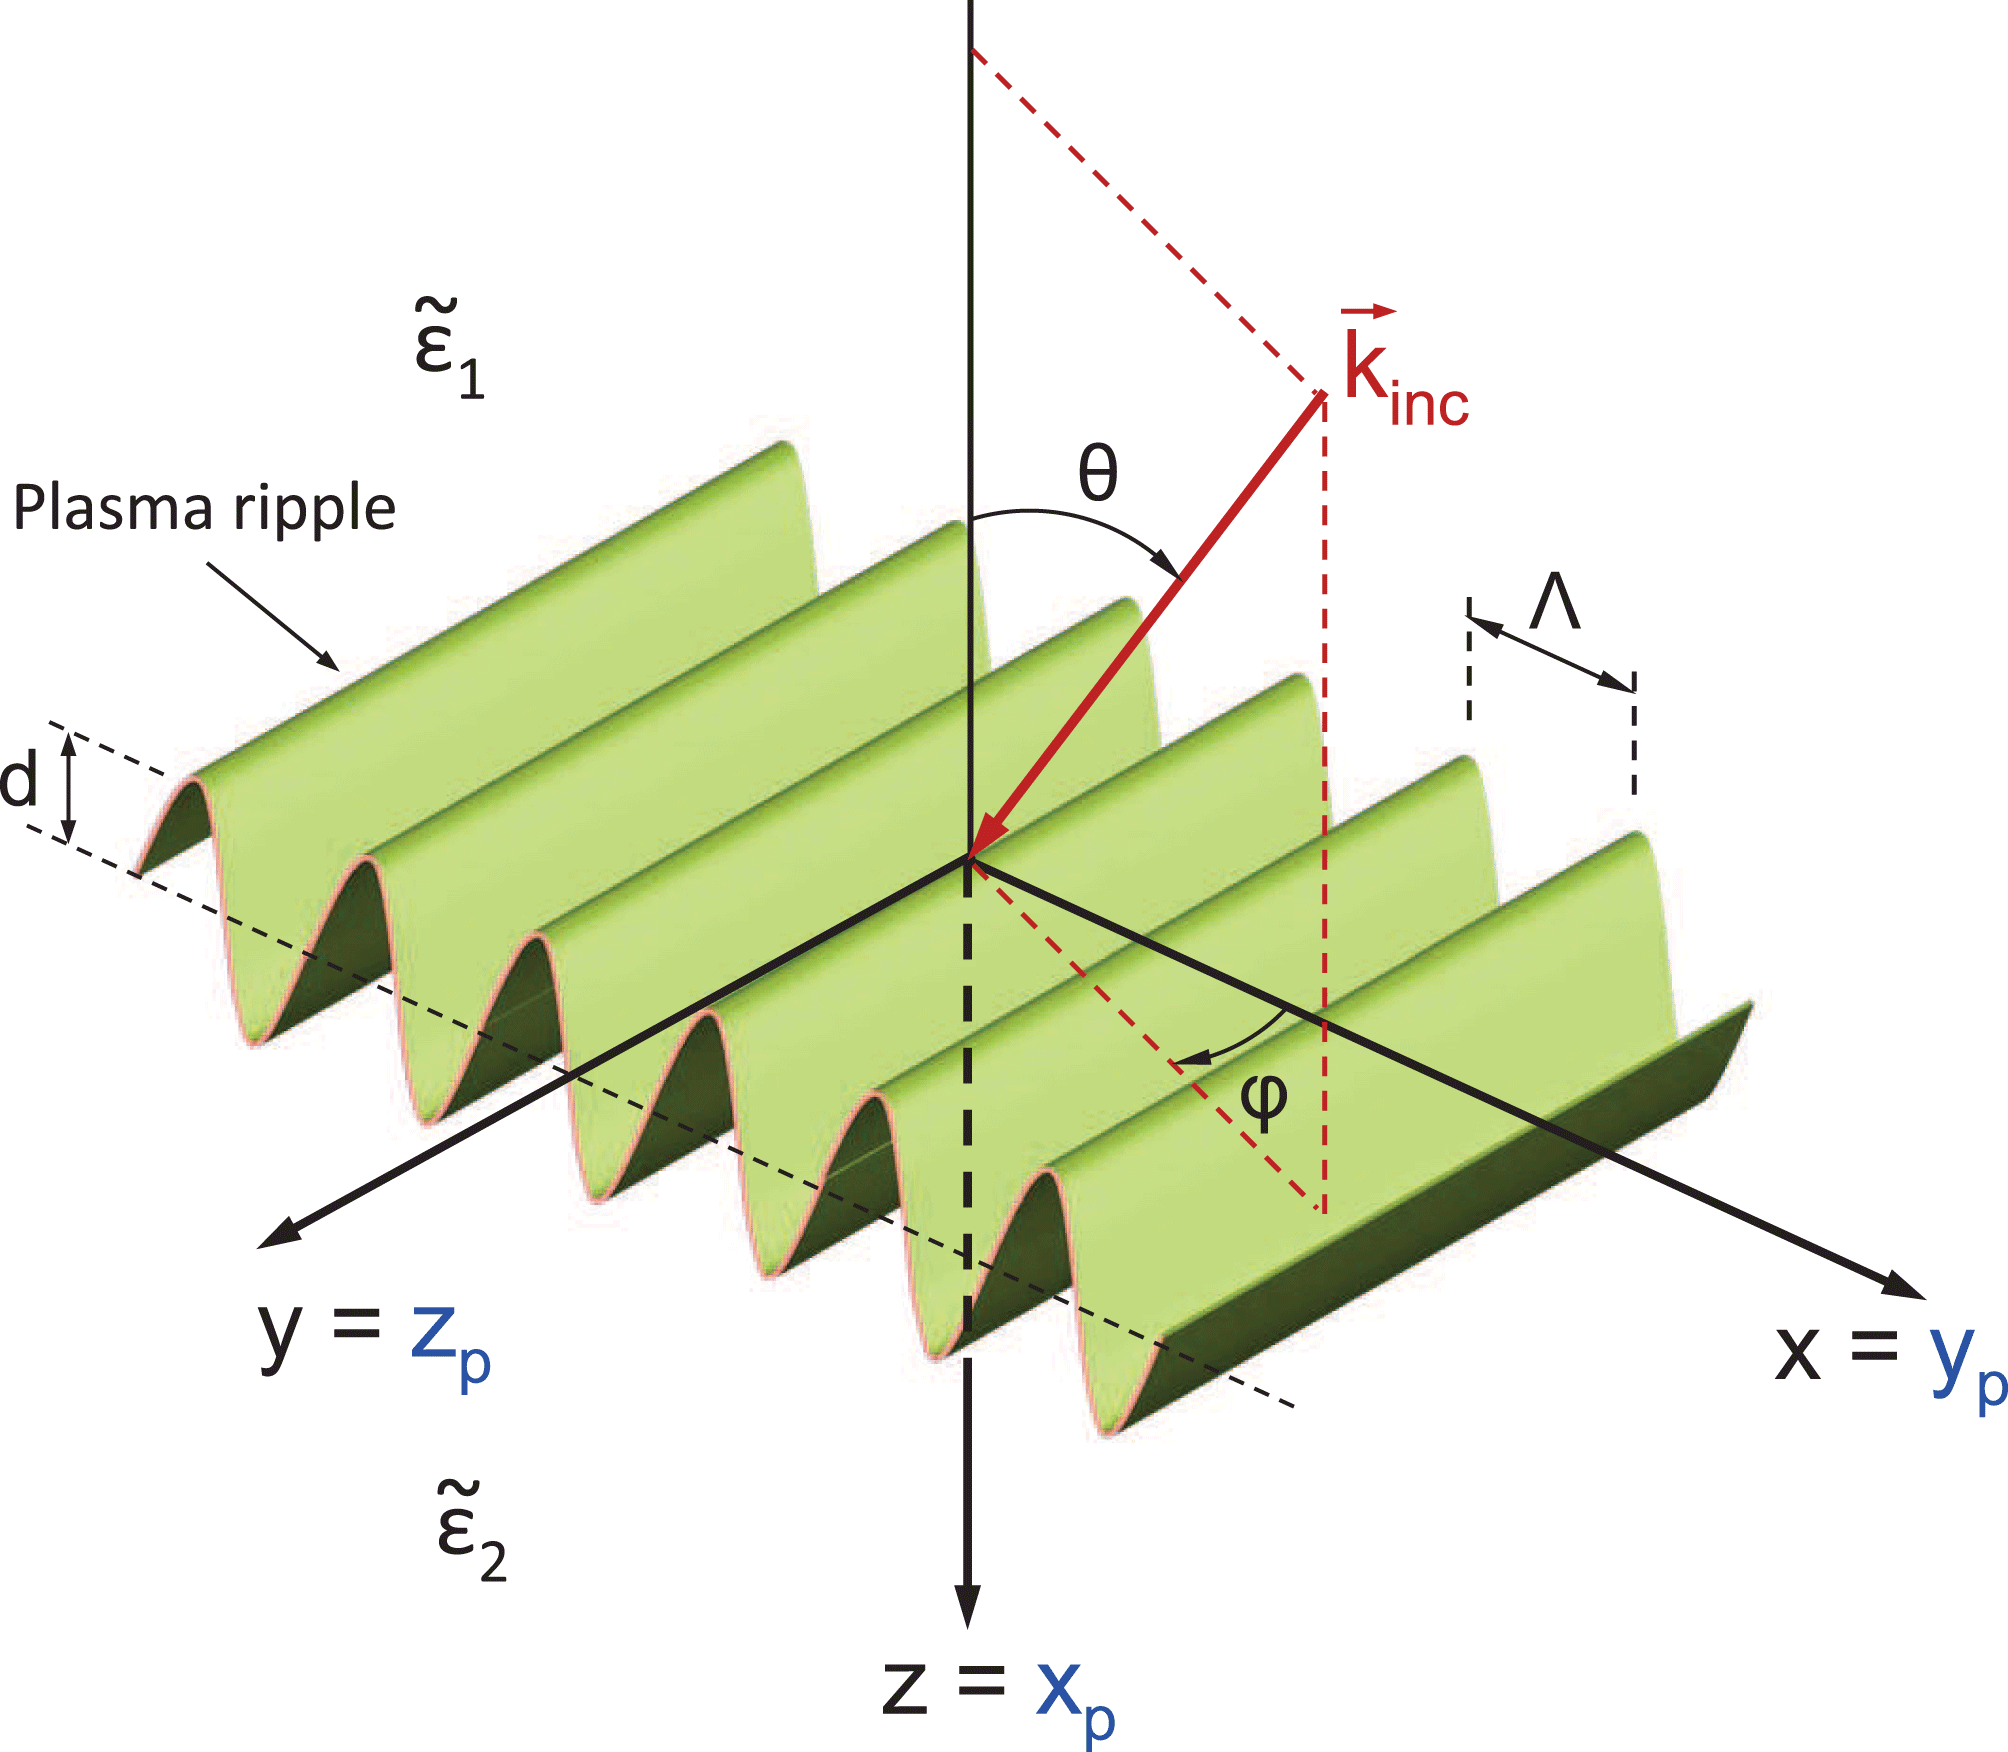
Figure 3. A plasma ripple at the torus boundary is considered as a periodic spatial modulation, i.e. as a plasma grating. The microwave radiation is represented as a plane wave incident from the top towards the bottom region. The incident wavevector is shown as
![]() $\boldsymbol{k}_{\text{inc}}$
and the incident angles are defined as
$\boldsymbol{k}_{\text{inc}}$
and the incident angles are defined as
![]() $\unicode[STIX]{x1D719}$
and
$\unicode[STIX]{x1D719}$
and
![]() $\unicode[STIX]{x1D703}$
. The scattering coordinate system
$\unicode[STIX]{x1D703}$
. The scattering coordinate system
![]() $(x,y,z)$
is related to the plasma coordinate system by
$(x,y,z)$
is related to the plasma coordinate system by
![]() $x=y_{p}$
,
$x=y_{p}$
,
![]() $y=z_{p}$
and
$y=z_{p}$
and
![]() $z=x_{p}$
as shown in the figure. The plasma relative permittivities of the top and of the bottom regions are defined as
$z=x_{p}$
as shown in the figure. The plasma relative permittivities of the top and of the bottom regions are defined as
![]() $\tilde{\unicode[STIX]{x1D73A}}_{1}$
and
$\tilde{\unicode[STIX]{x1D73A}}_{1}$
and
![]() $\tilde{\unicode[STIX]{x1D73A}}_{2}$
respectively. The plasma grating is assumed to have a sinusoidal profile of periodicity
$\tilde{\unicode[STIX]{x1D73A}}_{2}$
respectively. The plasma grating is assumed to have a sinusoidal profile of periodicity
![]() $\unicode[STIX]{x1D6EC}$
along the
$\unicode[STIX]{x1D6EC}$
along the
![]() $x$
direction, and an amplitude spatial variation of
$x$
direction, and an amplitude spatial variation of
![]() $d$
.
$d$
.
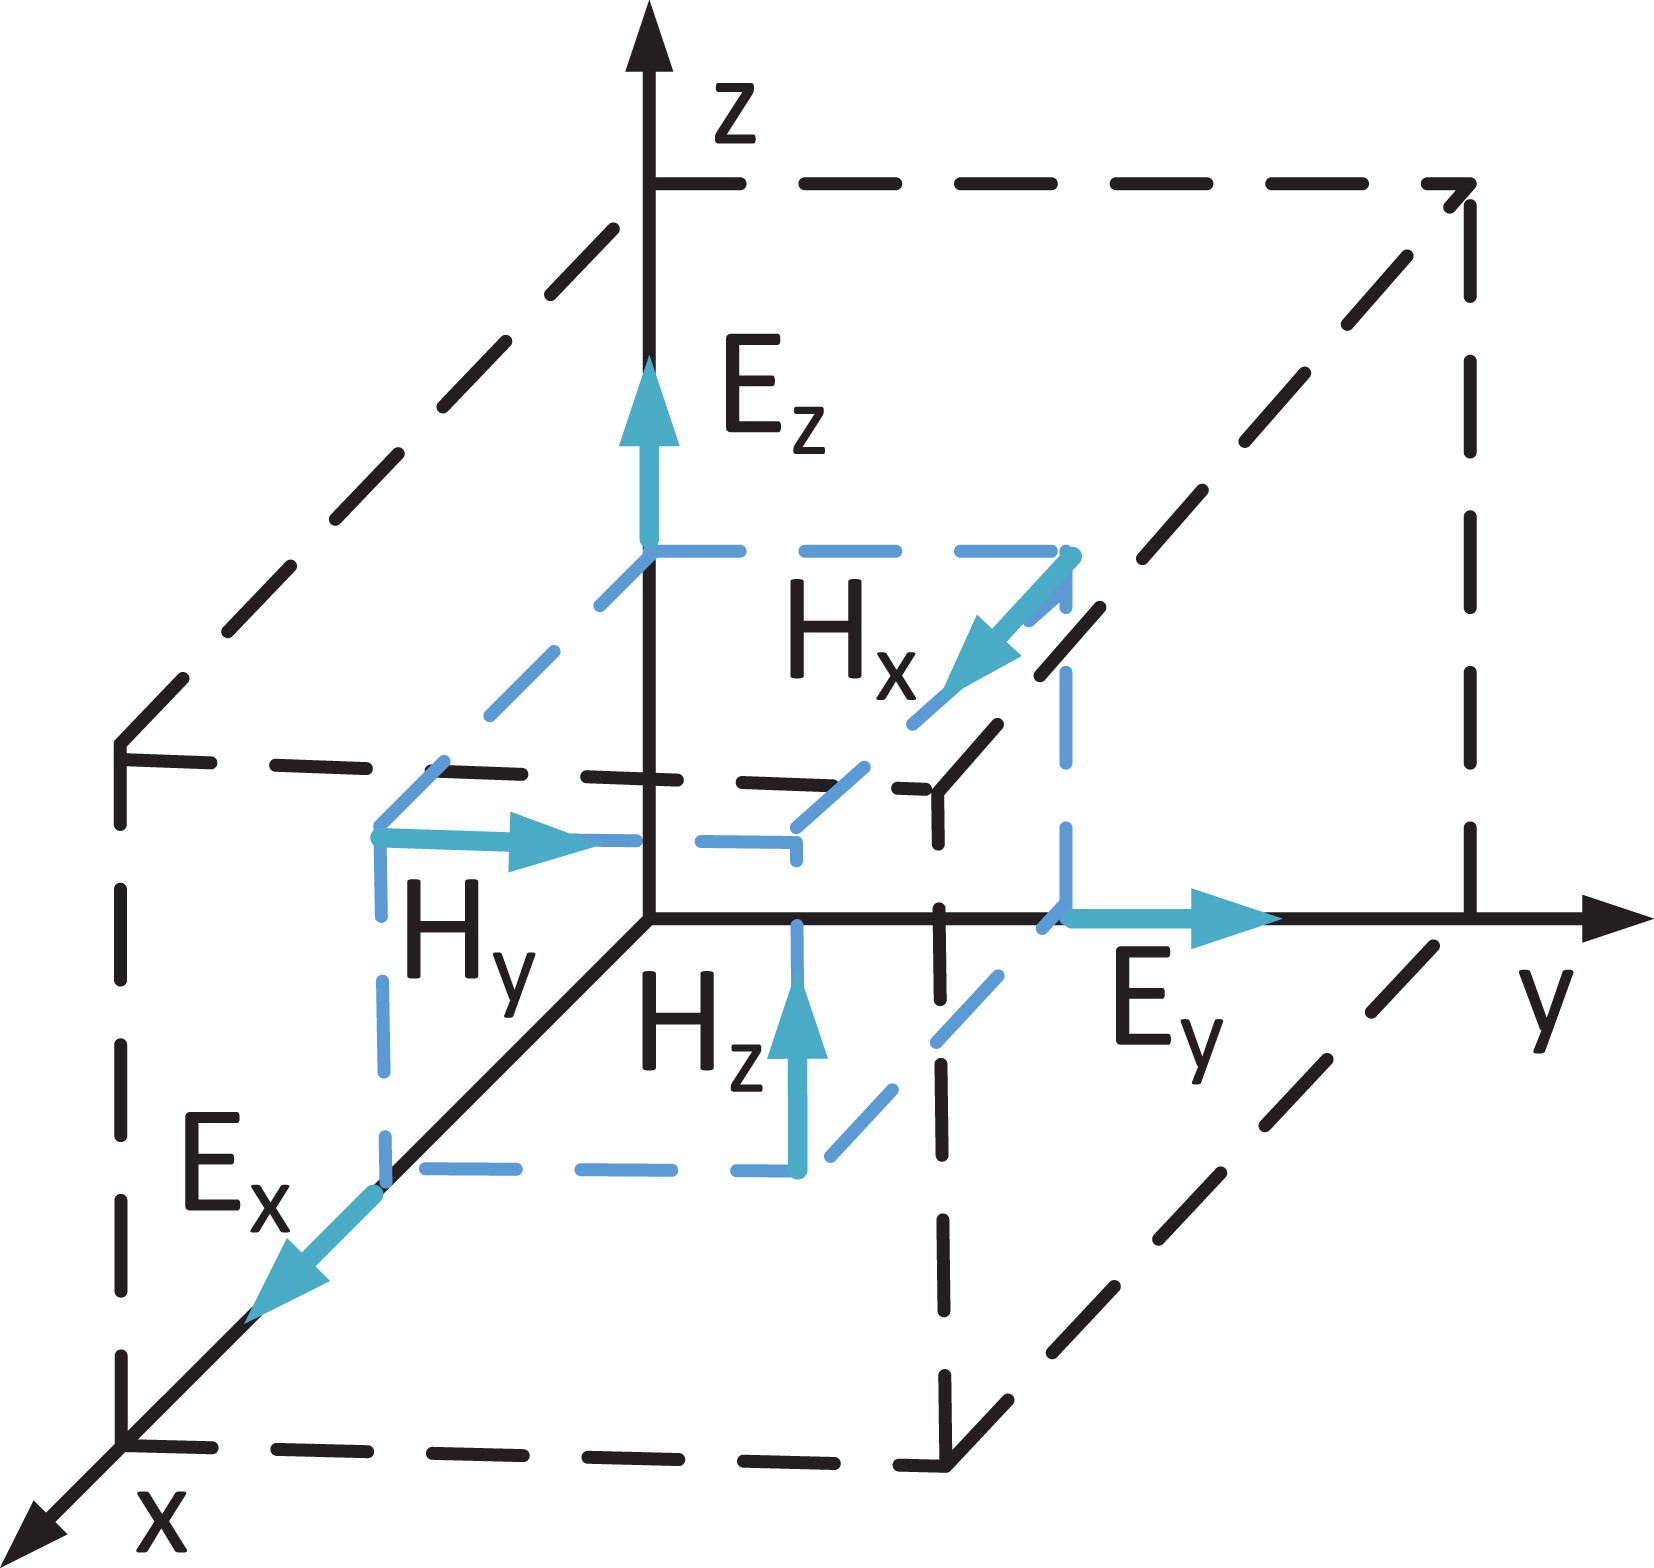
Figure 4. Three-dimensional Yee cell and electric and magnetic fields staggered in space by half a cell. Electric field components are staggered along their direction, while magnetic field components are staggered perpendicular to their direction.
3 Dispersion and polarization of RF waves in plasma
In order to define the excitation plane wave source for the FDFD method, it is necessary to derive the dispersion relation for anisotropic media. There are two possible orthogonal polarizations in the anisotropic region and the incident plane wave is selected as one of them. In particular, with respect to figure 3, an incident plane wave is assumed, with wavevector,
![]() $\boldsymbol{k}_{\text{inc}}=k_{\text{inc}}(-\hat{x}\cos \unicode[STIX]{x1D703}\sin \unicode[STIX]{x1D719}-{\hat{y}}\sin \unicode[STIX]{x1D703}\sin \unicode[STIX]{x1D719}+\hat{z}\cos \unicode[STIX]{x1D703})$
, and
$\boldsymbol{k}_{\text{inc}}=k_{\text{inc}}(-\hat{x}\cos \unicode[STIX]{x1D703}\sin \unicode[STIX]{x1D719}-{\hat{y}}\sin \unicode[STIX]{x1D703}\sin \unicode[STIX]{x1D719}+\hat{z}\cos \unicode[STIX]{x1D703})$
, and
![]() $k_{\text{inc}}=k_{0}n_{1}$
, with
$k_{\text{inc}}=k_{0}n_{1}$
, with
![]() $k_{0}$
the free space wavenumber and
$k_{0}$
the free space wavenumber and
![]() $n_{1}$
the effective index on the wave in the anisotropic medium with relative permittivity tensor
$n_{1}$
the effective index on the wave in the anisotropic medium with relative permittivity tensor
![]() $\tilde{\unicode[STIX]{x1D750}}_{1}$
. Faraday’s and Ampere’s equations for the plane wave solution become:
$\tilde{\unicode[STIX]{x1D750}}_{1}$
. Faraday’s and Ampere’s equations for the plane wave solution become:
Elimination of the field components (
![]() $z$
) vertical to the interface of figure 3, in (3.1), (3.2) leads to a
$z$
) vertical to the interface of figure 3, in (3.1), (3.2) leads to a
![]() $4\times 4$
eigenvalue eigenvector equation for the tangential to the interface field components
$4\times 4$
eigenvalue eigenvector equation for the tangential to the interface field components
![]() $\boldsymbol{v}^{\text{T}}\equiv [\boldsymbol{E}_{x}~\boldsymbol{E}_{y}~\boldsymbol{H}_{x}~\boldsymbol{H}_{y}]$
of the form:
$\boldsymbol{v}^{\text{T}}\equiv [\boldsymbol{E}_{x}~\boldsymbol{E}_{y}~\boldsymbol{H}_{x}~\boldsymbol{H}_{y}]$
of the form:
and the matrix
![]() $\tilde{\unicode[STIX]{x1D648}}$
is:
$\tilde{\unicode[STIX]{x1D648}}$
is:
 $$\begin{eqnarray}\displaystyle \left[\begin{array}{@{}cccc@{}}-{\displaystyle \frac{\unicode[STIX]{x1D716}_{zx}\tilde{\unicode[STIX]{x1D62C}}_{x}}{\unicode[STIX]{x1D716}_{zz}}} & \displaystyle \unicode[STIX]{x1D621}_{0}\displaystyle \left(1-{\displaystyle \frac{\tilde{\unicode[STIX]{x1D62C}}_{x}^{2}}{\unicode[STIX]{x1D716}_{zz}}}\right) & \displaystyle -{\displaystyle \frac{\unicode[STIX]{x1D716}_{zy}\tilde{\unicode[STIX]{x1D62C}}_{x}}{\unicode[STIX]{x1D716}_{zz}}} & \displaystyle {\displaystyle \frac{\tilde{\unicode[STIX]{x1D62C}}_{y}\tilde{\unicode[STIX]{x1D62C}}_{x}\unicode[STIX]{x1D621}_{0}}{\unicode[STIX]{x1D716}_{zz}}}\\ {\displaystyle \frac{1}{\unicode[STIX]{x1D621}_{0}}}\left(-\tilde{\unicode[STIX]{x1D62C}}_{y}^{2}+\unicode[STIX]{x1D716}_{xx}-{\displaystyle \frac{\unicode[STIX]{x1D716}_{xz}\unicode[STIX]{x1D716}_{zx}}{\unicode[STIX]{x1D716}_{zz}}}\right) & \displaystyle -{\displaystyle \frac{\tilde{\unicode[STIX]{x1D62C}}_{x}\unicode[STIX]{x1D716}_{xz}}{\unicode[STIX]{x1D716}_{zz}}} & \displaystyle {\displaystyle \frac{1}{\unicode[STIX]{x1D621}_{0}}}\left(-\tilde{\unicode[STIX]{x1D62C}}_{x}\tilde{\unicode[STIX]{x1D62C}}_{y}+\unicode[STIX]{x1D716}_{xy}-{\displaystyle \frac{\unicode[STIX]{x1D716}_{xz}\unicode[STIX]{x1D716}_{zy}}{\unicode[STIX]{x1D716}_{zz}}}\right) & \displaystyle {\displaystyle \frac{\tilde{\unicode[STIX]{x1D62C}}_{y}\unicode[STIX]{x1D716}_{xz}}{\unicode[STIX]{x1D716}_{zz}}}\\ -{\displaystyle \frac{\unicode[STIX]{x1D716}_{zx}\tilde{\unicode[STIX]{x1D62C}}_{y}}{\unicode[STIX]{x1D716}_{zz}}} & \displaystyle -{\displaystyle \frac{\tilde{\unicode[STIX]{x1D62C}}_{y}\unicode[STIX]{x1D621}_{0}}{\unicode[STIX]{x1D716}_{zz}}} & \displaystyle -{\displaystyle \frac{\unicode[STIX]{x1D716}_{zy}}{\unicode[STIX]{x1D716}_{zz}}}\tilde{\unicode[STIX]{x1D62C}}_{y} & \displaystyle \unicode[STIX]{x1D621}_{0}\displaystyle \left({\displaystyle \frac{\tilde{\unicode[STIX]{x1D62C}}_{y}^{2}}{\unicode[STIX]{x1D716}_{zz}}}-1\right)\\ {\displaystyle \frac{1}{\unicode[STIX]{x1D621}_{0}}}\left(-\tilde{\unicode[STIX]{x1D62C}}_{x}\tilde{\unicode[STIX]{x1D62C}}_{y}-\unicode[STIX]{x1D716}_{yx}-{\displaystyle \frac{\unicode[STIX]{x1D716}_{yz}\unicode[STIX]{x1D716}_{zx}}{\unicode[STIX]{x1D716}_{zz}}}\right) & \displaystyle {\displaystyle \frac{\unicode[STIX]{x1D716}_{yz}\tilde{\unicode[STIX]{x1D62C}}_{x}}{\unicode[STIX]{x1D716}_{zz}}} & \displaystyle {\displaystyle \frac{1}{\unicode[STIX]{x1D621}_{0}}}\left(-\tilde{\unicode[STIX]{x1D62C}}_{x}^{2}-\unicode[STIX]{x1D716}_{yy}-{\displaystyle \frac{\unicode[STIX]{x1D716}_{yz}\unicode[STIX]{x1D716}_{zy}}{\unicode[STIX]{x1D716}_{zz}}}\right) & \displaystyle -{\displaystyle \frac{\unicode[STIX]{x1D716}_{yz}\tilde{\unicode[STIX]{x1D62C}}_{y}}{\unicode[STIX]{x1D716}_{zz}}}\end{array}\right]. & & \displaystyle \nonumber\\ \displaystyle & & \displaystyle\end{eqnarray}$$
In general there are four solutions to (3.3), two forward (
![]() $+z$
) and two backward (
$+z$
) and two backward (
![]() $-z$
), which can be propagating or evanescent. In order to classify them, Poynting’s vector is used. In particular
$-z$
), which can be propagating or evanescent. In order to classify them, Poynting’s vector is used. In particular
![]() $P_{z}\equiv \text{Re}\{S_{z}\}$
is calculated, where
$P_{z}\equiv \text{Re}\{S_{z}\}$
is calculated, where
![]() $\boldsymbol{S}$
is the Poynting vector. If
$\boldsymbol{S}$
is the Poynting vector. If
![]() $P_{z}>0$
or
$P_{z}>0$
or
![]() $P_{z}<0$
the solution is a forward or backward wave respectively, and if
$P_{z}<0$
the solution is a forward or backward wave respectively, and if
![]() $P_{z}=0$
the wave should be evanescent. Since
$P_{z}=0$
the wave should be evanescent. Since
![]() $\text{e}^{-\text{i}k_{z}z}$
is the
$\text{e}^{-\text{i}k_{z}z}$
is the
![]() $z$
-dependence and
$z$
-dependence and
![]() $k_{z}\equiv k_{zr}+\text{i}k_{zi}$
, it holds that
$k_{z}\equiv k_{zr}+\text{i}k_{zi}$
, it holds that
![]() $k_{zi}<0$
or
$k_{zi}<0$
or
![]() $k_{zi}>0$
for forward or backward evanescent wave respectively. The general solution of (3.3) is written as:
$k_{zi}>0$
for forward or backward evanescent wave respectively. The general solution of (3.3) is written as:
 $$\begin{eqnarray}\displaystyle \unicode[STIX]{x1D66B}=[\boldsymbol{v}_{1+}~\boldsymbol{v}_{2+}~\boldsymbol{v}_{1-}~\boldsymbol{v}_{2-}]\left[\begin{array}{@{}c@{}}A_{1+}\text{e}^{-\text{i}k_{1+}z}\\ A_{2+}\text{e}^{-\text{i}k_{2+}z}\\ A_{1-}\text{e}^{-\text{i}k_{1-}z}\\ A_{2-}\text{e}^{-\text{i}k_{2-}z}\end{array}\right]\text{e}^{-\text{i}\boldsymbol{k}_{t}\cdot \boldsymbol{r}_{t}}, & & \displaystyle\end{eqnarray}$$
where
![]() $\boldsymbol{v}_{1+}$
,
$\boldsymbol{v}_{1+}$
,
![]() $\boldsymbol{v}_{2+}$
,
$\boldsymbol{v}_{2+}$
,
![]() $\boldsymbol{v}_{1-}$
,
$\boldsymbol{v}_{1-}$
,
![]() $\boldsymbol{v}_{2-}$
are the eigenpolarizations (eigenvectors of (3.3)) that correspond to the two forward and backward waves with
$\boldsymbol{v}_{2-}$
are the eigenpolarizations (eigenvectors of (3.3)) that correspond to the two forward and backward waves with
![]() $k_{z1+}$
,
$k_{z1+}$
,
![]() $k_{z2+}$
,
$k_{z2+}$
,
![]() $k_{z1-}$
,
$k_{z1-}$
,
![]() $k_{z2-}$
the corresponding eigenvalues, with
$k_{z2-}$
the corresponding eigenvalues, with
![]() $A_{1+}$
,
$A_{1+}$
,
![]() $A_{2+}$
,
$A_{2+}$
,
![]() $A_{1-}$
,
$A_{1-}$
,
![]() $A_{1-}$
the corresponding amplitudes, with
$A_{1-}$
the corresponding amplitudes, with
![]() $\text{e}^{-\boldsymbol{k}_{t}\cdot \boldsymbol{r}_{t}}$
the transverse field dependence. The other two field components,
$\text{e}^{-\boldsymbol{k}_{t}\cdot \boldsymbol{r}_{t}}$
the transverse field dependence. The other two field components,
![]() $H_{z}$
,
$H_{z}$
,
![]() $E_{z}$
are specified directly from (3.1) and (3.2) by use of (3.5) as:
$E_{z}$
are specified directly from (3.1) and (3.2) by use of (3.5) as:
where
![]() $i=1,2$
, and
$i=1,2$
, and
![]() $Z_{0}$
the free space impedance.
$Z_{0}$
the free space impedance.
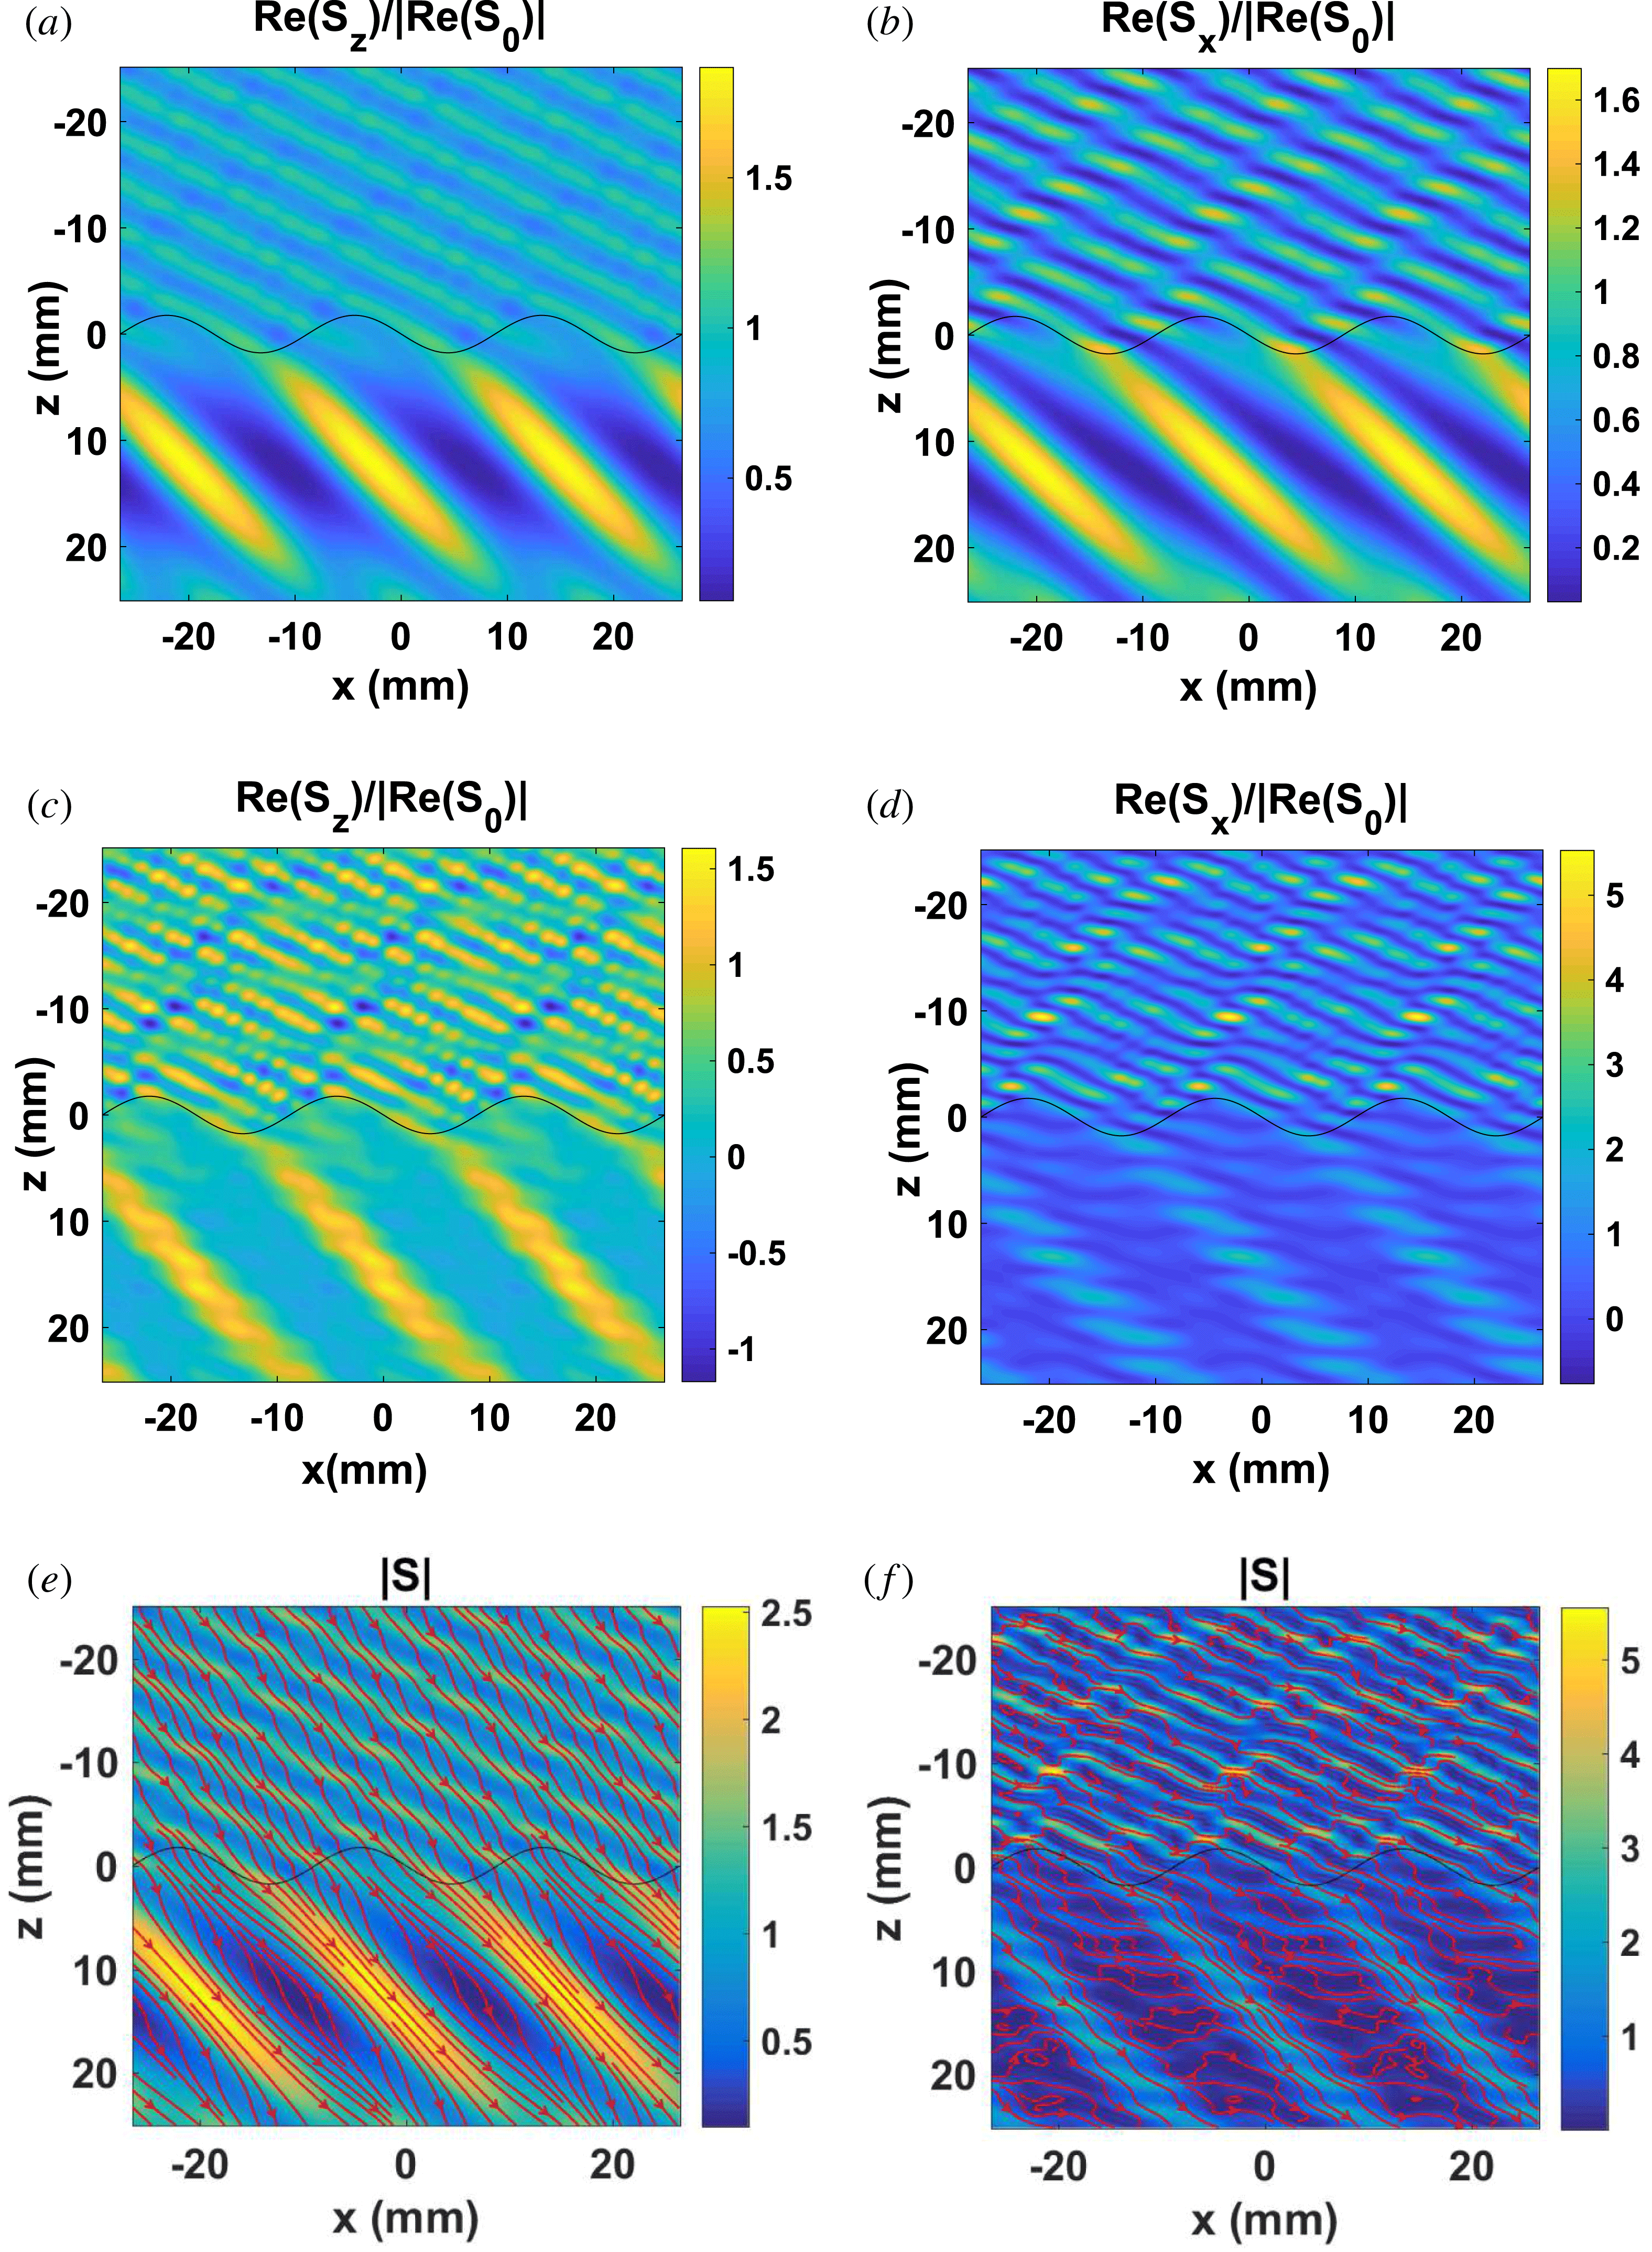
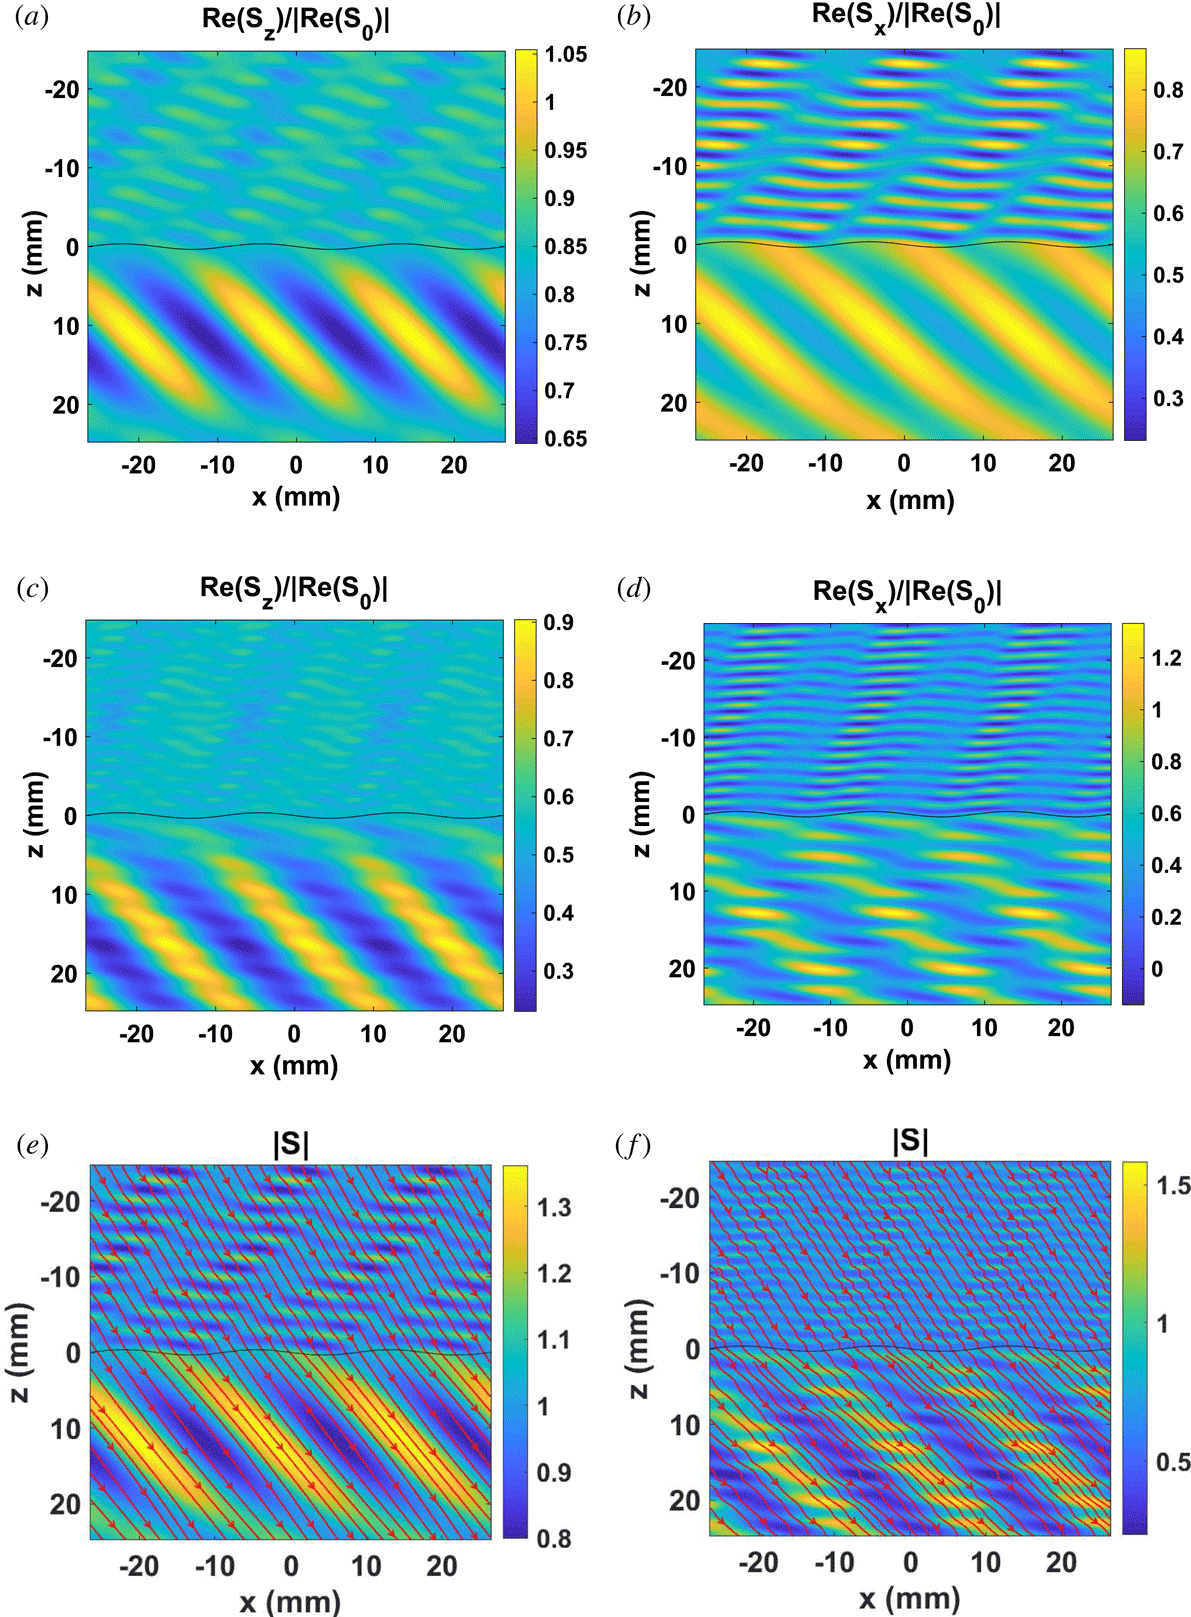
Figure 5. Main simulation where an O-mode or an X-mode plane wave is incident on the interface (figure 3) at angle
![]() $\unicode[STIX]{x1D703}=30^{\circ }$
, at frequency of 170 GHz,
$\unicode[STIX]{x1D703}=30^{\circ }$
, at frequency of 170 GHz,
![]() $\unicode[STIX]{x1D6EC}=10\unicode[STIX]{x1D706}_{1}$
,
$\unicode[STIX]{x1D6EC}=10\unicode[STIX]{x1D706}_{1}$
,
![]() $d=\unicode[STIX]{x1D706}1$
. (a,b) Components of the normalized Poynting vector, O-mode. (c,d) X-mode. (e,f) Normalized Poynting amplitude and Poynting vector flow, for the O and X mode respectively.
$d=\unicode[STIX]{x1D706}1$
. (a,b) Components of the normalized Poynting vector, O-mode. (c,d) X-mode. (e,f) Normalized Poynting amplitude and Poynting vector flow, for the O and X mode respectively.
4 Numerical results
It is emphasized that the purpose of the following numerical results is twofold. On the one hand, it is to highlight the capabilities of the developed FDFD solver, ScaRF, and on the other hand, to show the rigorous analysis of RF scattering by plasma blobs, which is an important problem, with various applications. Usage of the ScaRF solver, for the analysis of additional plasma–blob systems is left for future work.
By use of ScaRF, the electric and magnetic field vectors
![]() $\boldsymbol{e}$
,
$\boldsymbol{e}$
,
![]() $\boldsymbol{h}$
, where
$\boldsymbol{h}$
, where
![]() $\boldsymbol{h}=\text{i}Z_{0}^{-1}\tilde{\boldsymbol{h}}$
, are calculated at every node of the computational domain, and consequently the time-averaged Poynting vector,
$\boldsymbol{h}=\text{i}Z_{0}^{-1}\tilde{\boldsymbol{h}}$
, are calculated at every node of the computational domain, and consequently the time-averaged Poynting vector,
![]() $\boldsymbol{S}$
is calculated as:
$\boldsymbol{S}$
is calculated as:
In the following figures the Poynting vector components are presented in the code’s coordinate system
![]() $x$
,
$x$
,
![]() $y$
,
$y$
,
![]() $z$
. Transformation of the results to the plasma coordinate system
$z$
. Transformation of the results to the plasma coordinate system
![]() $x_{p}$
,
$x_{p}$
,
![]() $y_{p}$
,
$y_{p}$
,
![]() $z_{p}$
is straightforward by use of (2.7). The
$z_{p}$
is straightforward by use of (2.7). The
![]() $y$
component of the Poynting vector is not shown since it is significantly smaller than the
$y$
component of the Poynting vector is not shown since it is significantly smaller than the
![]() $x$
,
$x$
,
![]() $z$
, components. Figure 5 is the main simulation, and subsequent simulations are cases where a single design parameter is varied.
$z$
, components. Figure 5 is the main simulation, and subsequent simulations are cases where a single design parameter is varied.
In figure 5, the normalized Poynting vector (normalized to the incident plane wave Poynting vector), is shown for a common blob configuration, where it is assumed that an O-mode or an X-mode plane wave is incident on the interface, as seen in figure 3, at angle
![]() $\unicode[STIX]{x1D703}=30^{\circ }$
and at frequency of 170 GHz. The periodic interface region has a period
$\unicode[STIX]{x1D703}=30^{\circ }$
and at frequency of 170 GHz. The periodic interface region has a period
![]() $\unicode[STIX]{x1D6EC}=10\unicode[STIX]{x1D706}_{1}$
and amplitude
$\unicode[STIX]{x1D6EC}=10\unicode[STIX]{x1D706}_{1}$
and amplitude
![]() $d=\unicode[STIX]{x1D706}_{1}$
, where
$d=\unicode[STIX]{x1D706}_{1}$
, where
![]() $\unicode[STIX]{x1D706}_{1}$
is the wavelength of the incident wave. The interface region contrast is weak, where the electron density of background and blob is set to
$\unicode[STIX]{x1D706}_{1}$
is the wavelength of the incident wave. The interface region contrast is weak, where the electron density of background and blob is set to
![]() $n_{\text{bg}.}=3\times 10^{20}~\text{m}^{-3}$
,
$n_{\text{bg}.}=3\times 10^{20}~\text{m}^{-3}$
,
![]() $n_{\text{bl}.}=3.2\times 10^{20}~\text{m}^{-3}$
, respectively. The magnetic field is at a
$n_{\text{bl}.}=3.2\times 10^{20}~\text{m}^{-3}$
, respectively. The magnetic field is at a
![]() $6^{\circ }$
inclination, with toroidal component, of 4.5 T and poloidal component of 0.4730 T.
$6^{\circ }$
inclination, with toroidal component, of 4.5 T and poloidal component of 0.4730 T.
It is observed in figure 5(e,f) that the density of the energy flow lines of the normalized Poynting vector increases in regions of high value of the Poynting vector amplitude. In addition these flow lines are spatially varying due to the spatial variation of the periodic interface. In regions where the Poynting amplitude is very small, close to numerical noise level, the pattern of the flow lines changes irregularly (X mode).
Next the normalized Poynting vector is shown when a single design variable (the amplitude, period or interface region contrast) is varied relatively to the ScaRF simulation of figure 5. In particular in figure 6 the amplitude of the modulation is decreased to
![]() $0.2$
wavelength of the incident wave and a different spatial pattern of the Poynting vector is observed compared to figure 5. It is observed that, relative to the main simulation of figure 5, the power flow lines are almost straight due to the flatter periodic interface, that leads to weaker diffraction effects. In figure 7 the period of the modulation is increased to
$0.2$
wavelength of the incident wave and a different spatial pattern of the Poynting vector is observed compared to figure 5. It is observed that, relative to the main simulation of figure 5, the power flow lines are almost straight due to the flatter periodic interface, that leads to weaker diffraction effects. In figure 7 the period of the modulation is increased to
![]() $20$
wavelengths of the incident wave, compared to the modulation period of figure 5. This change in period results in a quite different spatial distribution of the Poynting vector compared to figure 5. In particular increasing the period results in weaker diffraction effects in the sense that there are fewer significant diffracted orders. This can also be seen from the power flow in figure 7(e,f), where the flow lines are smoother compared to figure 5.
$20$
wavelengths of the incident wave, compared to the modulation period of figure 5. This change in period results in a quite different spatial distribution of the Poynting vector compared to figure 5. In particular increasing the period results in weaker diffraction effects in the sense that there are fewer significant diffracted orders. This can also be seen from the power flow in figure 7(e,f), where the flow lines are smoother compared to figure 5.
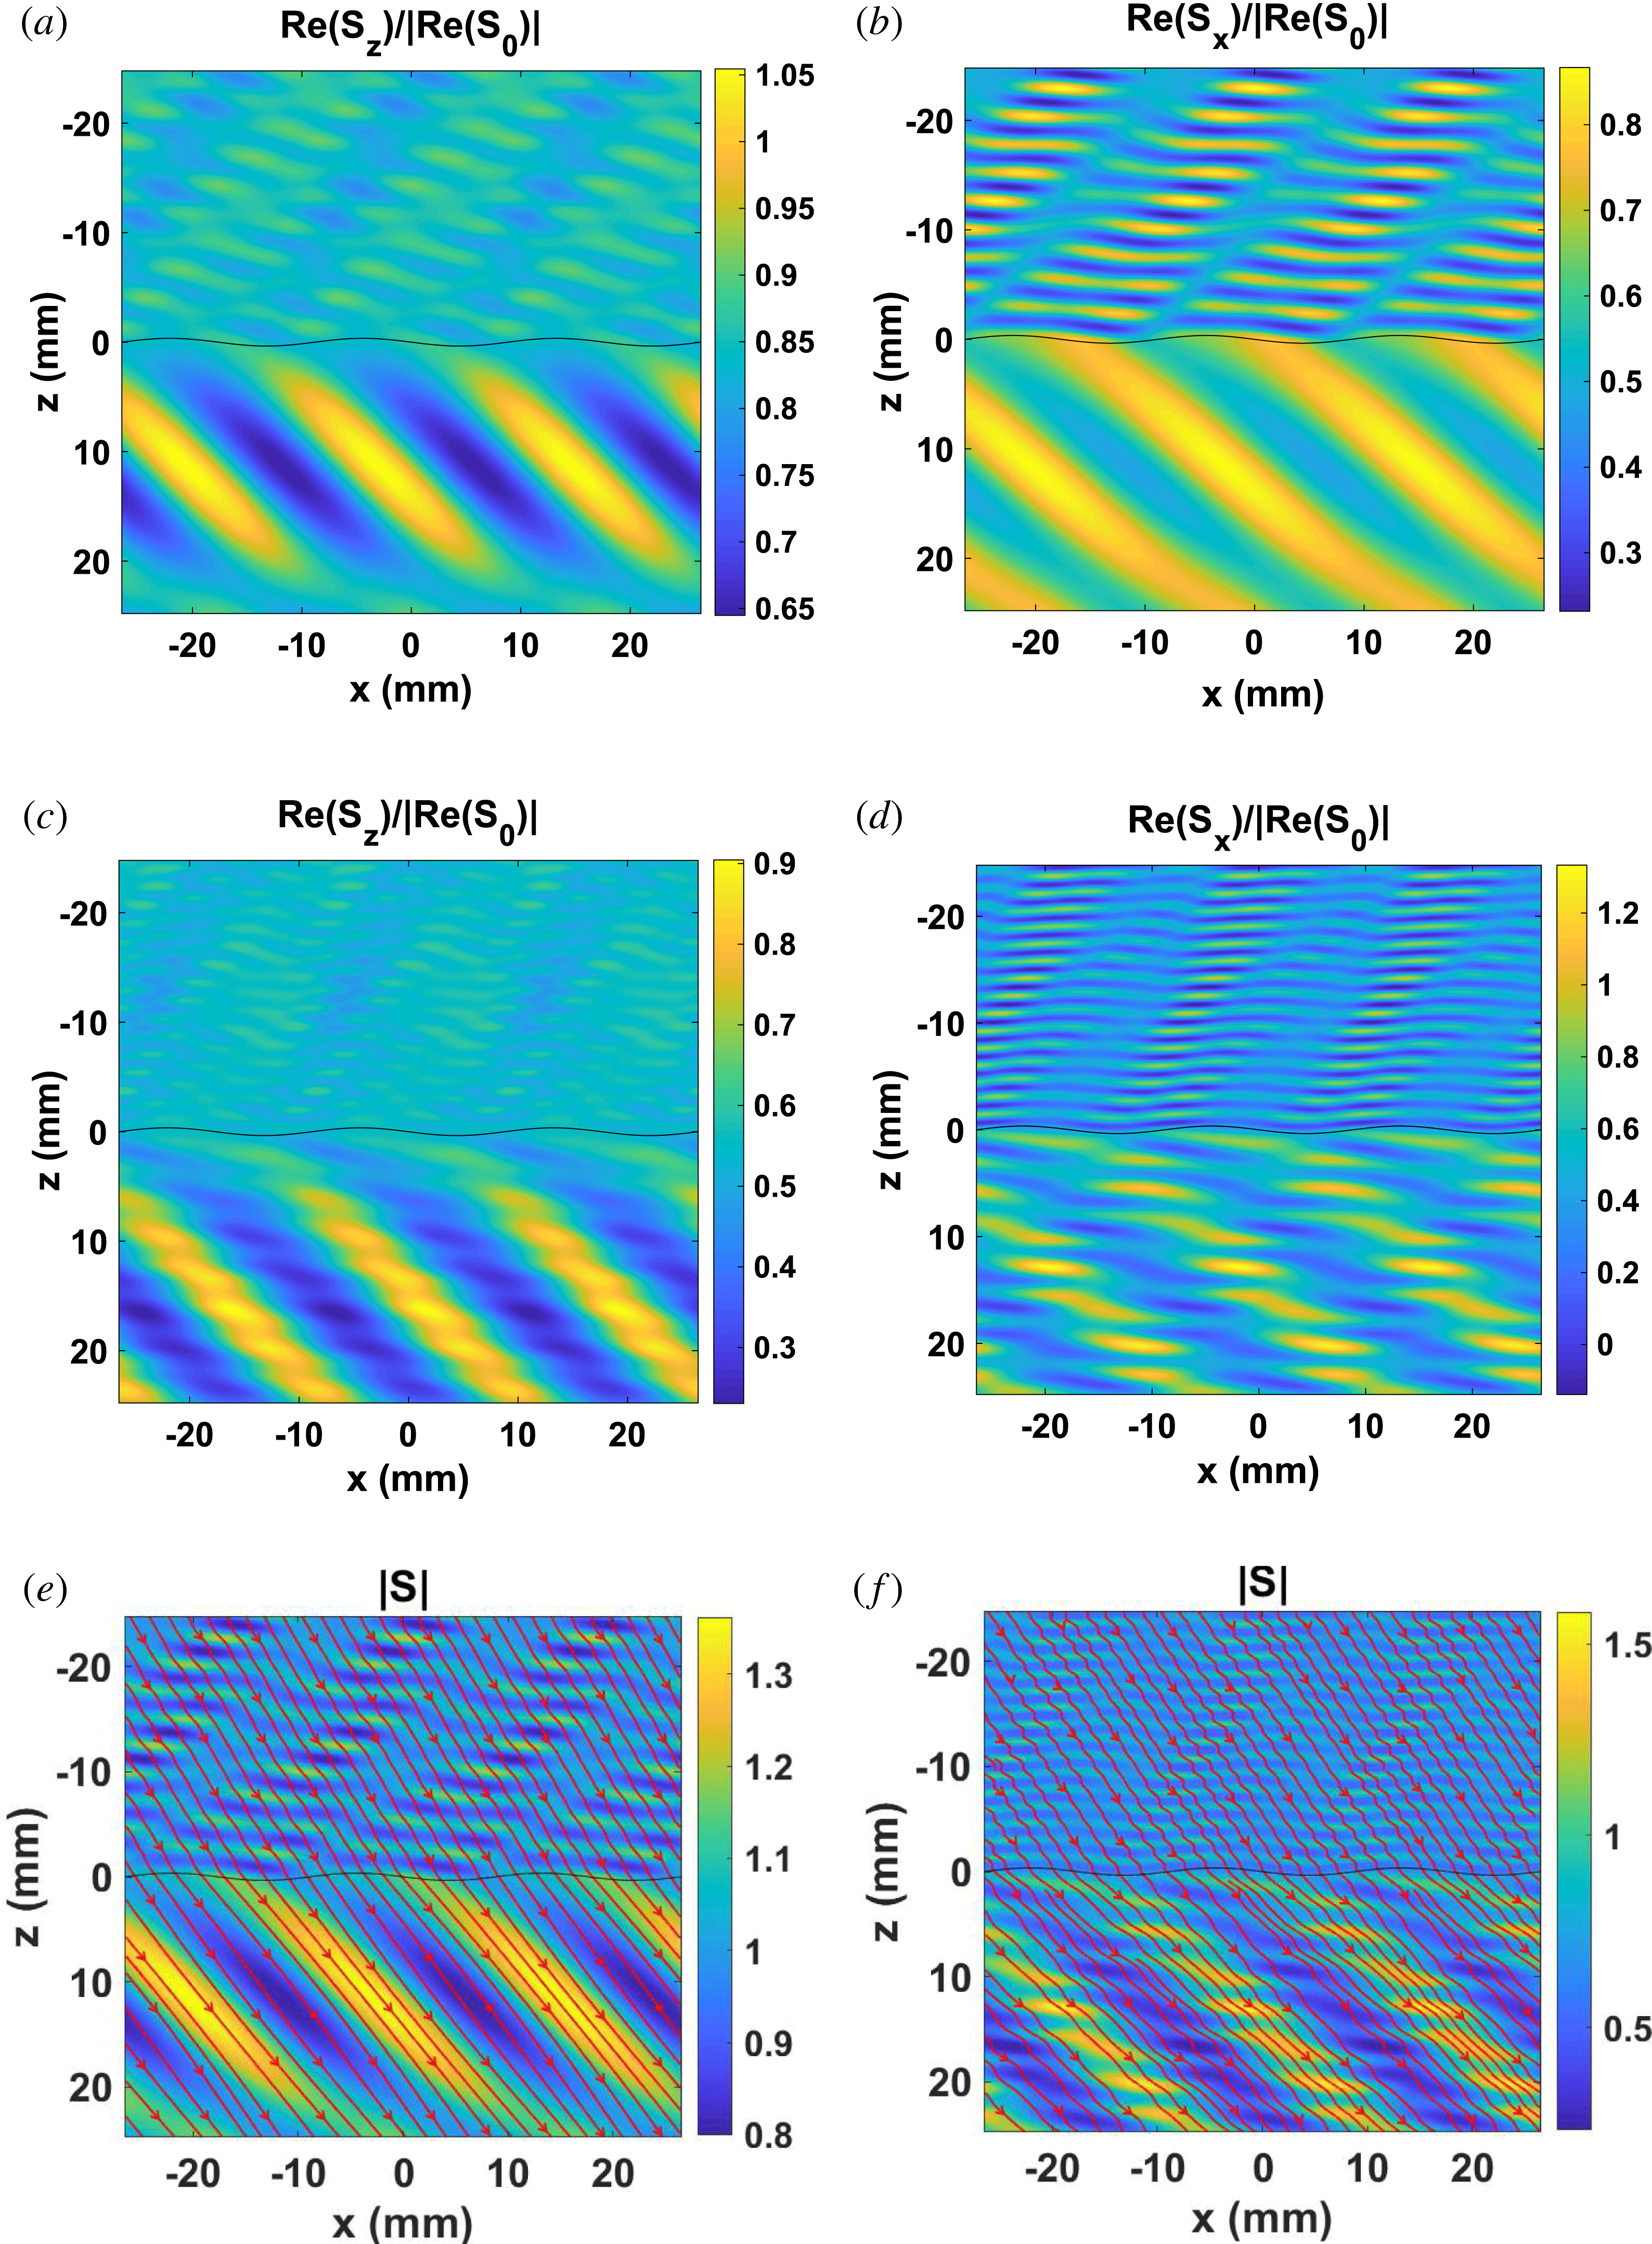
Figure 6. Same parameters as the main simulation of figure 5, except the periodic interface amplitude, which is 20 % of the incident wavelength. (a,b) Components of the normalized Poynting vector, O-mode. (c,d) X-mode. (e,f) Normalized Poynting amplitude and Poynting vector flow, for the O and X mode respectively.
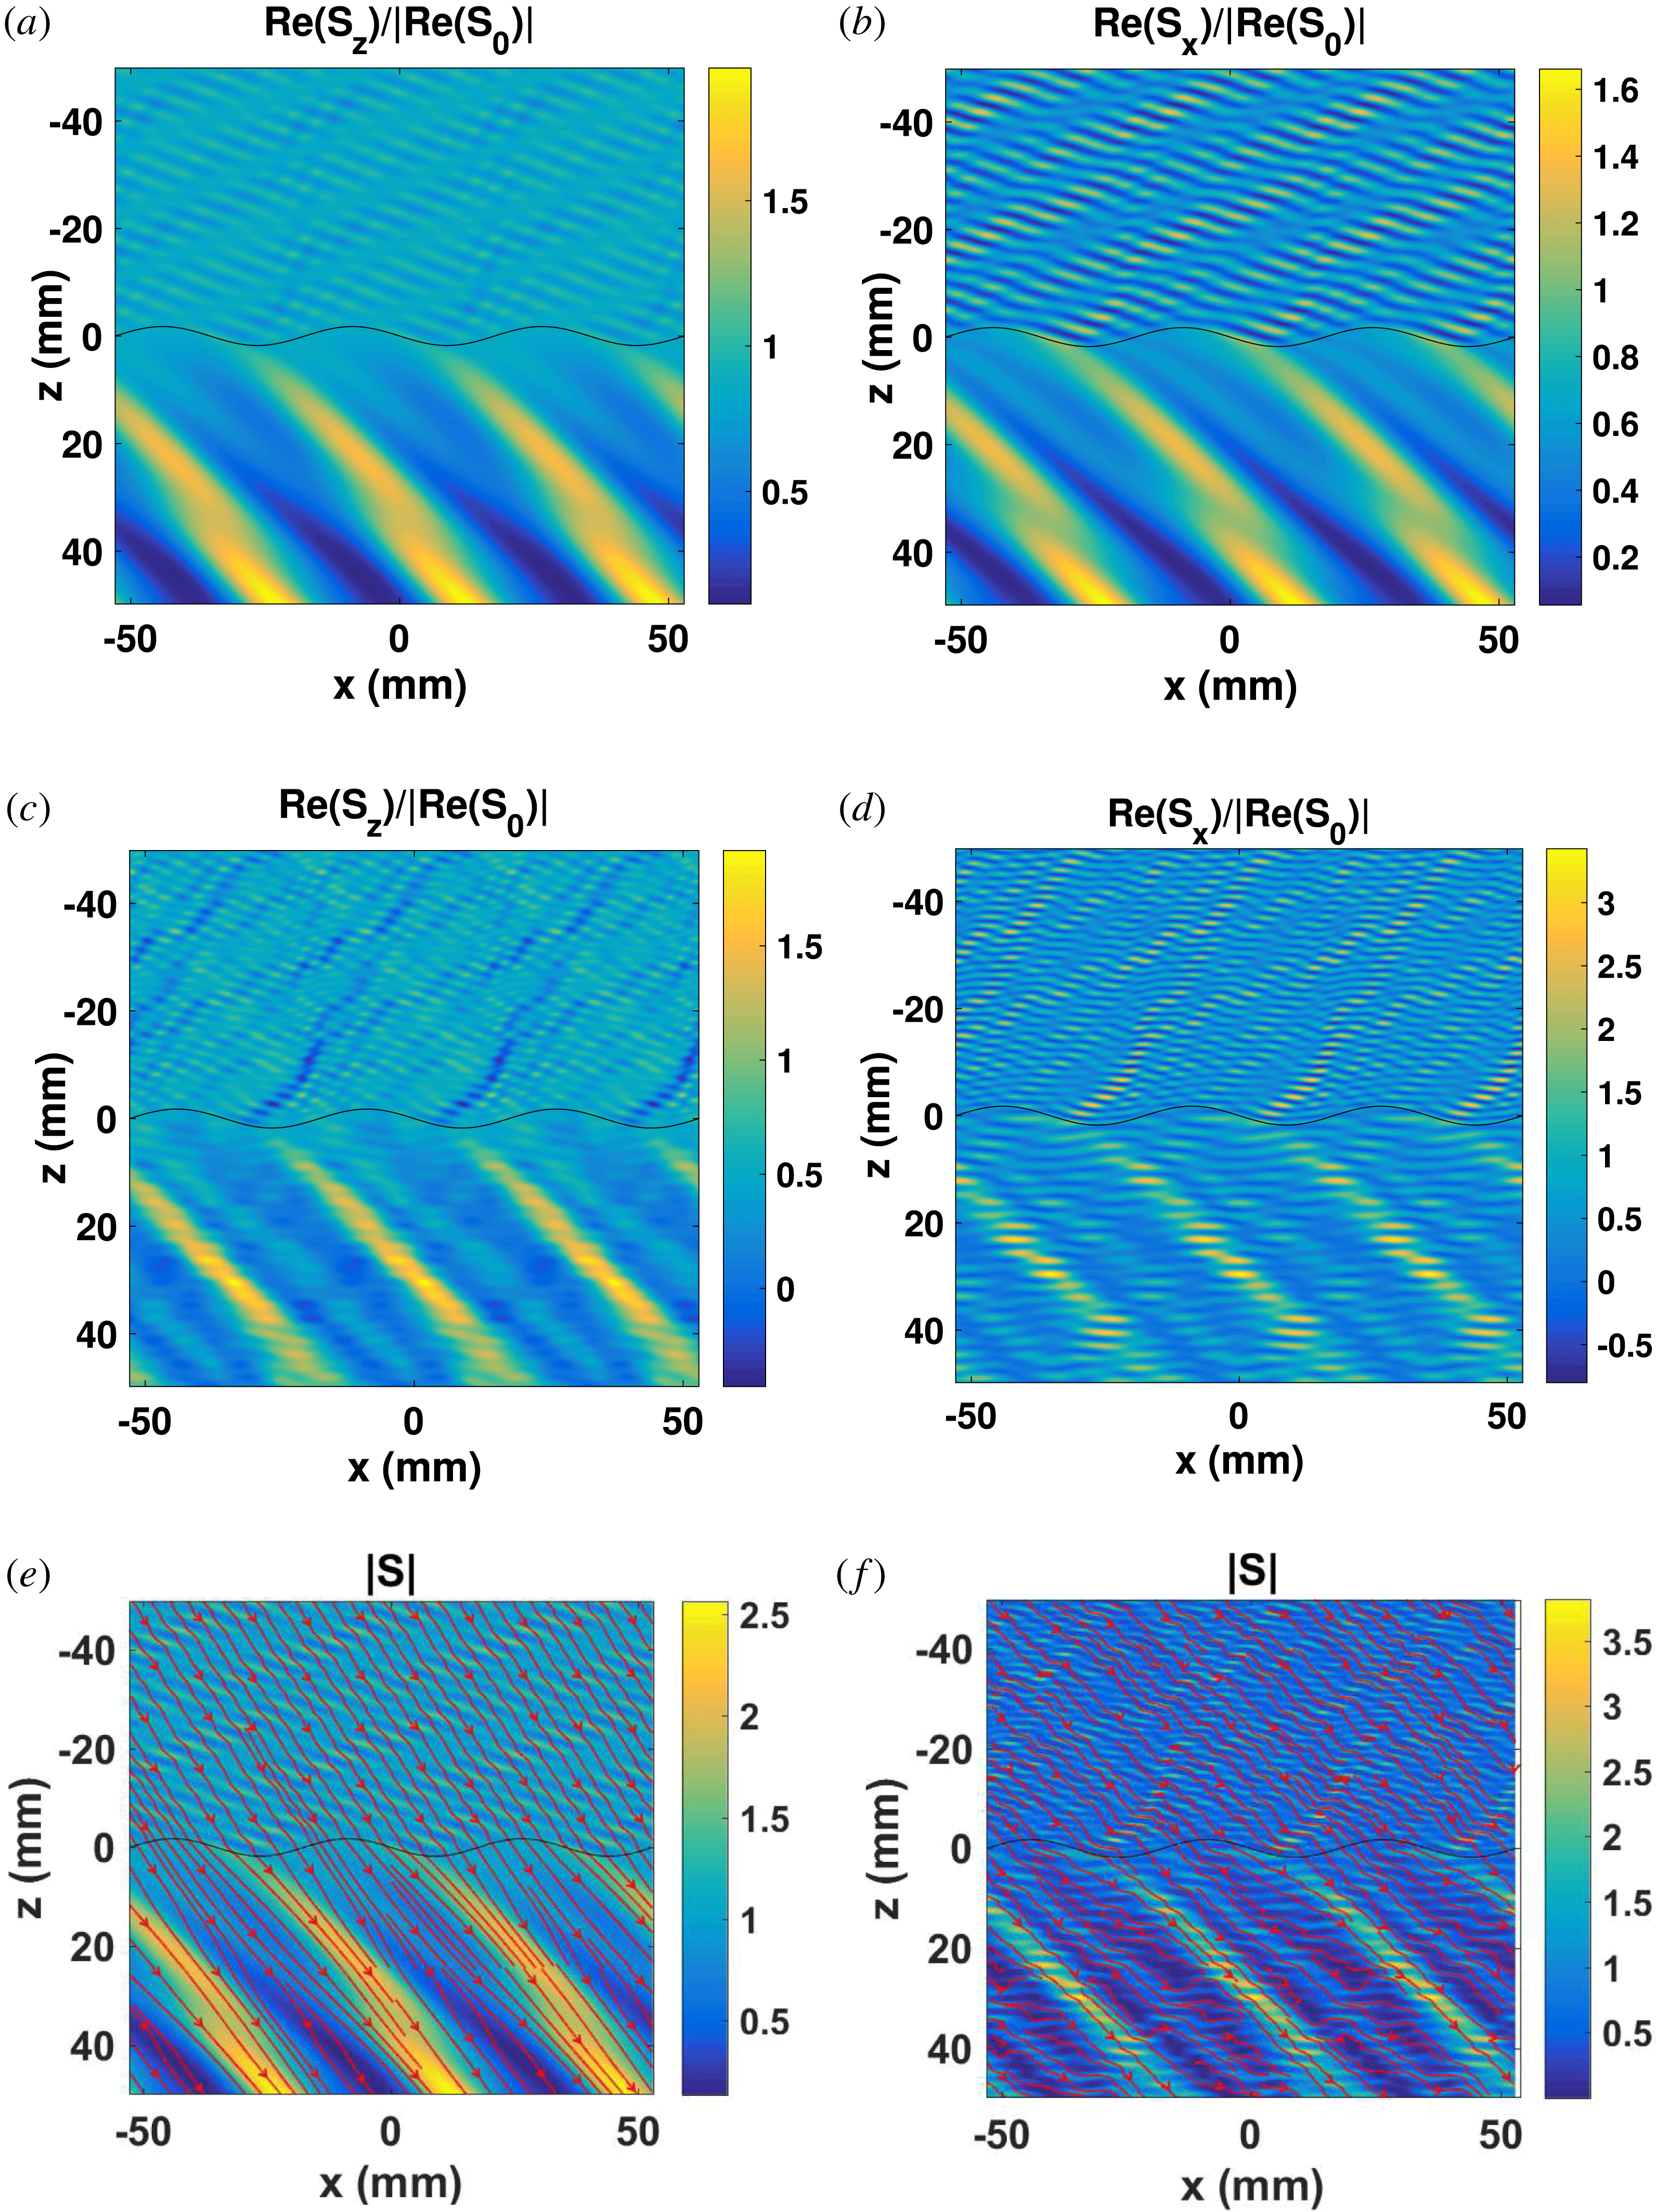
Figure 7. Same parameters as the main simulation of figure 5, except the periodic interface period, which is 20 times the incident wavelength. (a,b) Components of the normalized Poynting vector, O-mode. (c,d) X-mode. (e,f) Normalized Poynting amplitude and Poynting vector flow, for the O and X mode respectively.
With respect to the main simulation (figure 5), in figure 8 the electron density of the blob is increased from
![]() $n_{\text{bl}.}=3.2\times 10^{20}~\text{m}^{-3}$
to
$n_{\text{bl}.}=3.2\times 10^{20}~\text{m}^{-3}$
to
![]() $n_{\text{bl}.}=3.6\times 10^{20}~\text{m}^{-3}$
for the O mode, and from
$n_{\text{bl}.}=3.6\times 10^{20}~\text{m}^{-3}$
for the O mode, and from
![]() $n_{\text{bl}.}=5.5\times 10^{20}~\text{m}^{-3}$
to
$n_{\text{bl}.}=5.5\times 10^{20}~\text{m}^{-3}$
to
![]() $n_{\text{bl}.}=6.3\times 10^{20}~\text{m}^{-3}$
for the X mode. This increased interface region contrast leads to strong reflections of the incoming wave and consequently, as can be seen in figure 8, the Poynting vector amplitude in the blob region is very small since for the chosen blob and electron densities, at 170 GHz, the blob system is in the frequency cutoff. This is also quantitatively shown by calculation of the reflection,
$n_{\text{bl}.}=6.3\times 10^{20}~\text{m}^{-3}$
for the X mode. This increased interface region contrast leads to strong reflections of the incoming wave and consequently, as can be seen in figure 8, the Poynting vector amplitude in the blob region is very small since for the chosen blob and electron densities, at 170 GHz, the blob system is in the frequency cutoff. This is also quantitatively shown by calculation of the reflection,
![]() $r$
, and transmission,
$r$
, and transmission,
![]() $t$
, coefficients. These are the square root of the spatial integral in the
$t$
, coefficients. These are the square root of the spatial integral in the
![]() $y$
-direction of the
$y$
-direction of the
![]() $S_{x}$
vector for the scattered fields divided by the power of the incident wave in the
$S_{x}$
vector for the scattered fields divided by the power of the incident wave in the
![]() $x$
direction. The values of
$x$
direction. The values of
![]() $r$
,
$r$
,
![]() $t$
, are
$t$
, are
![]() $r=1.005$
,
$r=1.005$
,
![]() $t=0.013$
and
$t=0.013$
and
![]() $r=0.98$
,
$r=0.98$
,
![]() $t=1.11\times 10^{-6}$
for the O and X mode respectively. In addition, in figure 8(e,f) the power flow lines are very irregular in the reflection region due to interference of the incident plane wave and the strong reflected power from the interface. This is also supported from the fact that the maximum Poynting amplitude value is higher than any other of the cases considered. The power flow lines are also irregular in the transmission regions, since the Poynting amplitude is very small, close to the numerical noise level.
$t=1.11\times 10^{-6}$
for the O and X mode respectively. In addition, in figure 8(e,f) the power flow lines are very irregular in the reflection region due to interference of the incident plane wave and the strong reflected power from the interface. This is also supported from the fact that the maximum Poynting amplitude value is higher than any other of the cases considered. The power flow lines are also irregular in the transmission regions, since the Poynting amplitude is very small, close to the numerical noise level.
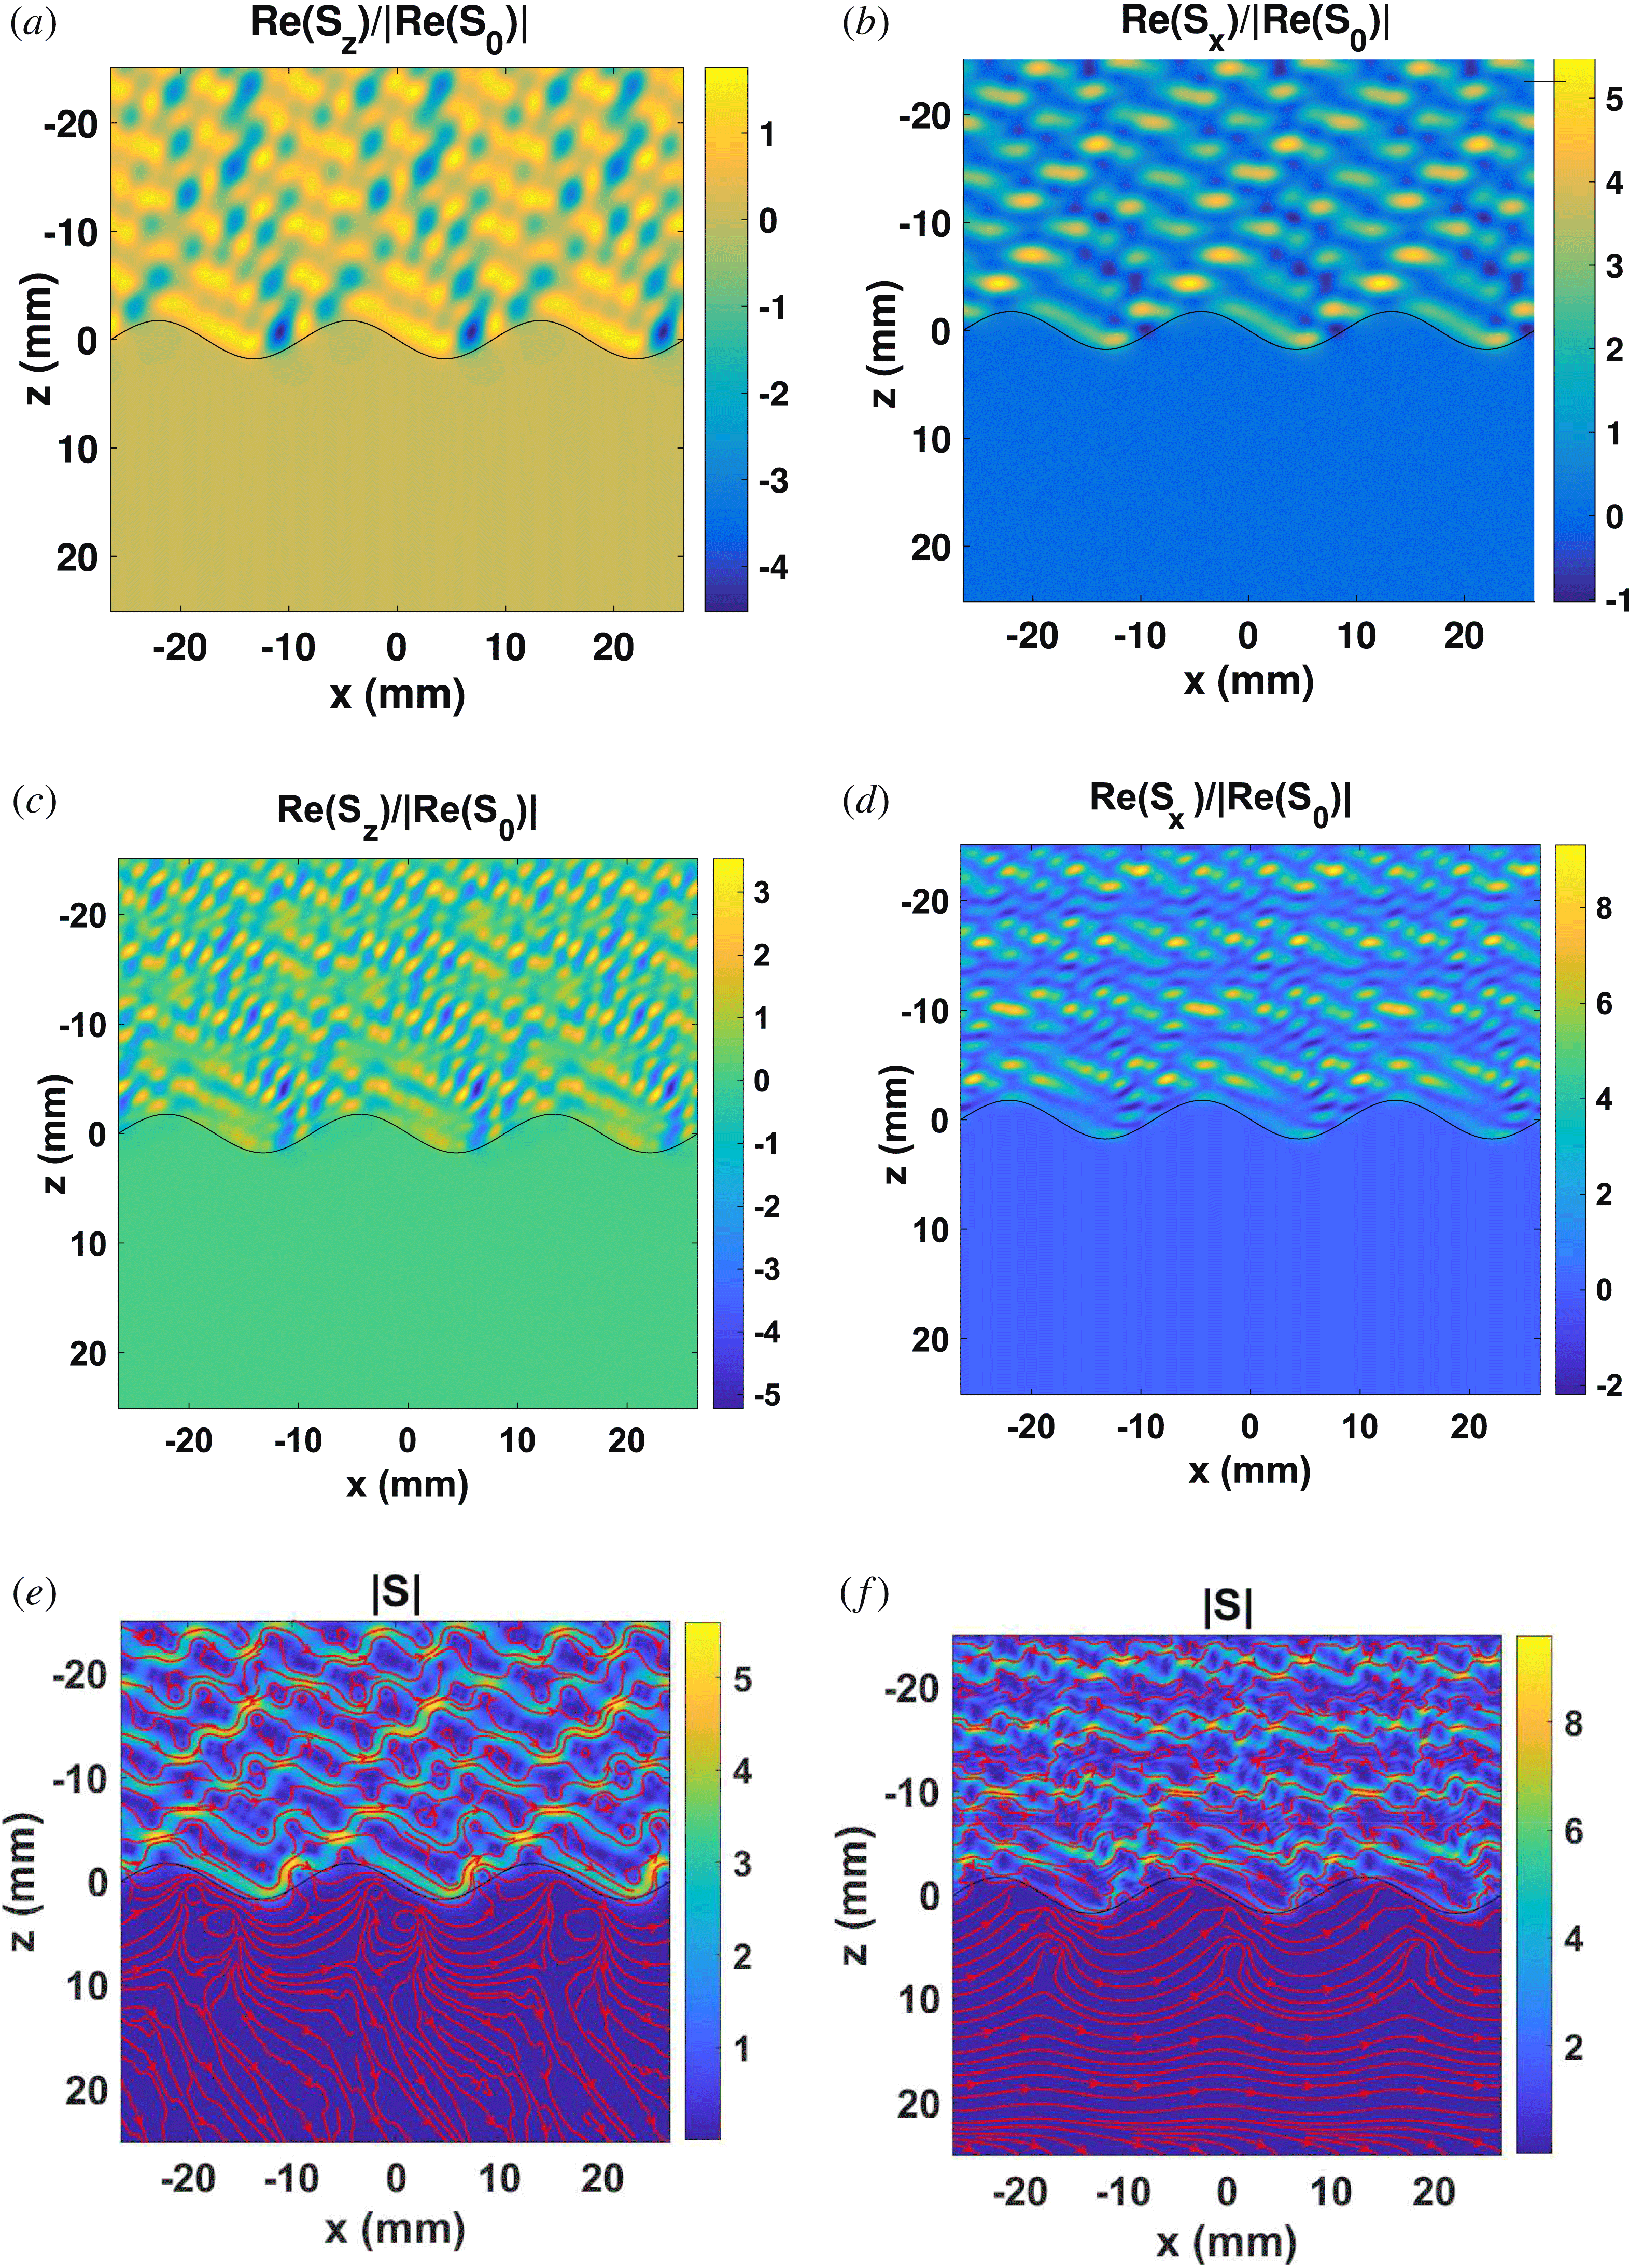
Figure 8. Same parameters as the main simulation of figure 5, except that the electron density of the blob region is stronger:
![]() $n_{\text{bl}.}=3.6\times 10^{20}~\text{m}^{-3}$
,
$n_{\text{bl}.}=3.6\times 10^{20}~\text{m}^{-3}$
,
![]() $n_{\text{bl}.}=5.5\times 10^{20}~\text{m}^{-3}$
for the O and X mode, respectively. (a,b) Components of the normalized Poynting vector, O-mode. (c,d) X-mode. (e,f) Normalized Poynting amplitude and Poynting vector flow, for the O and X mode respectively.
$n_{\text{bl}.}=5.5\times 10^{20}~\text{m}^{-3}$
for the O and X mode, respectively. (a,b) Components of the normalized Poynting vector, O-mode. (c,d) X-mode. (e,f) Normalized Poynting amplitude and Poynting vector flow, for the O and X mode respectively.
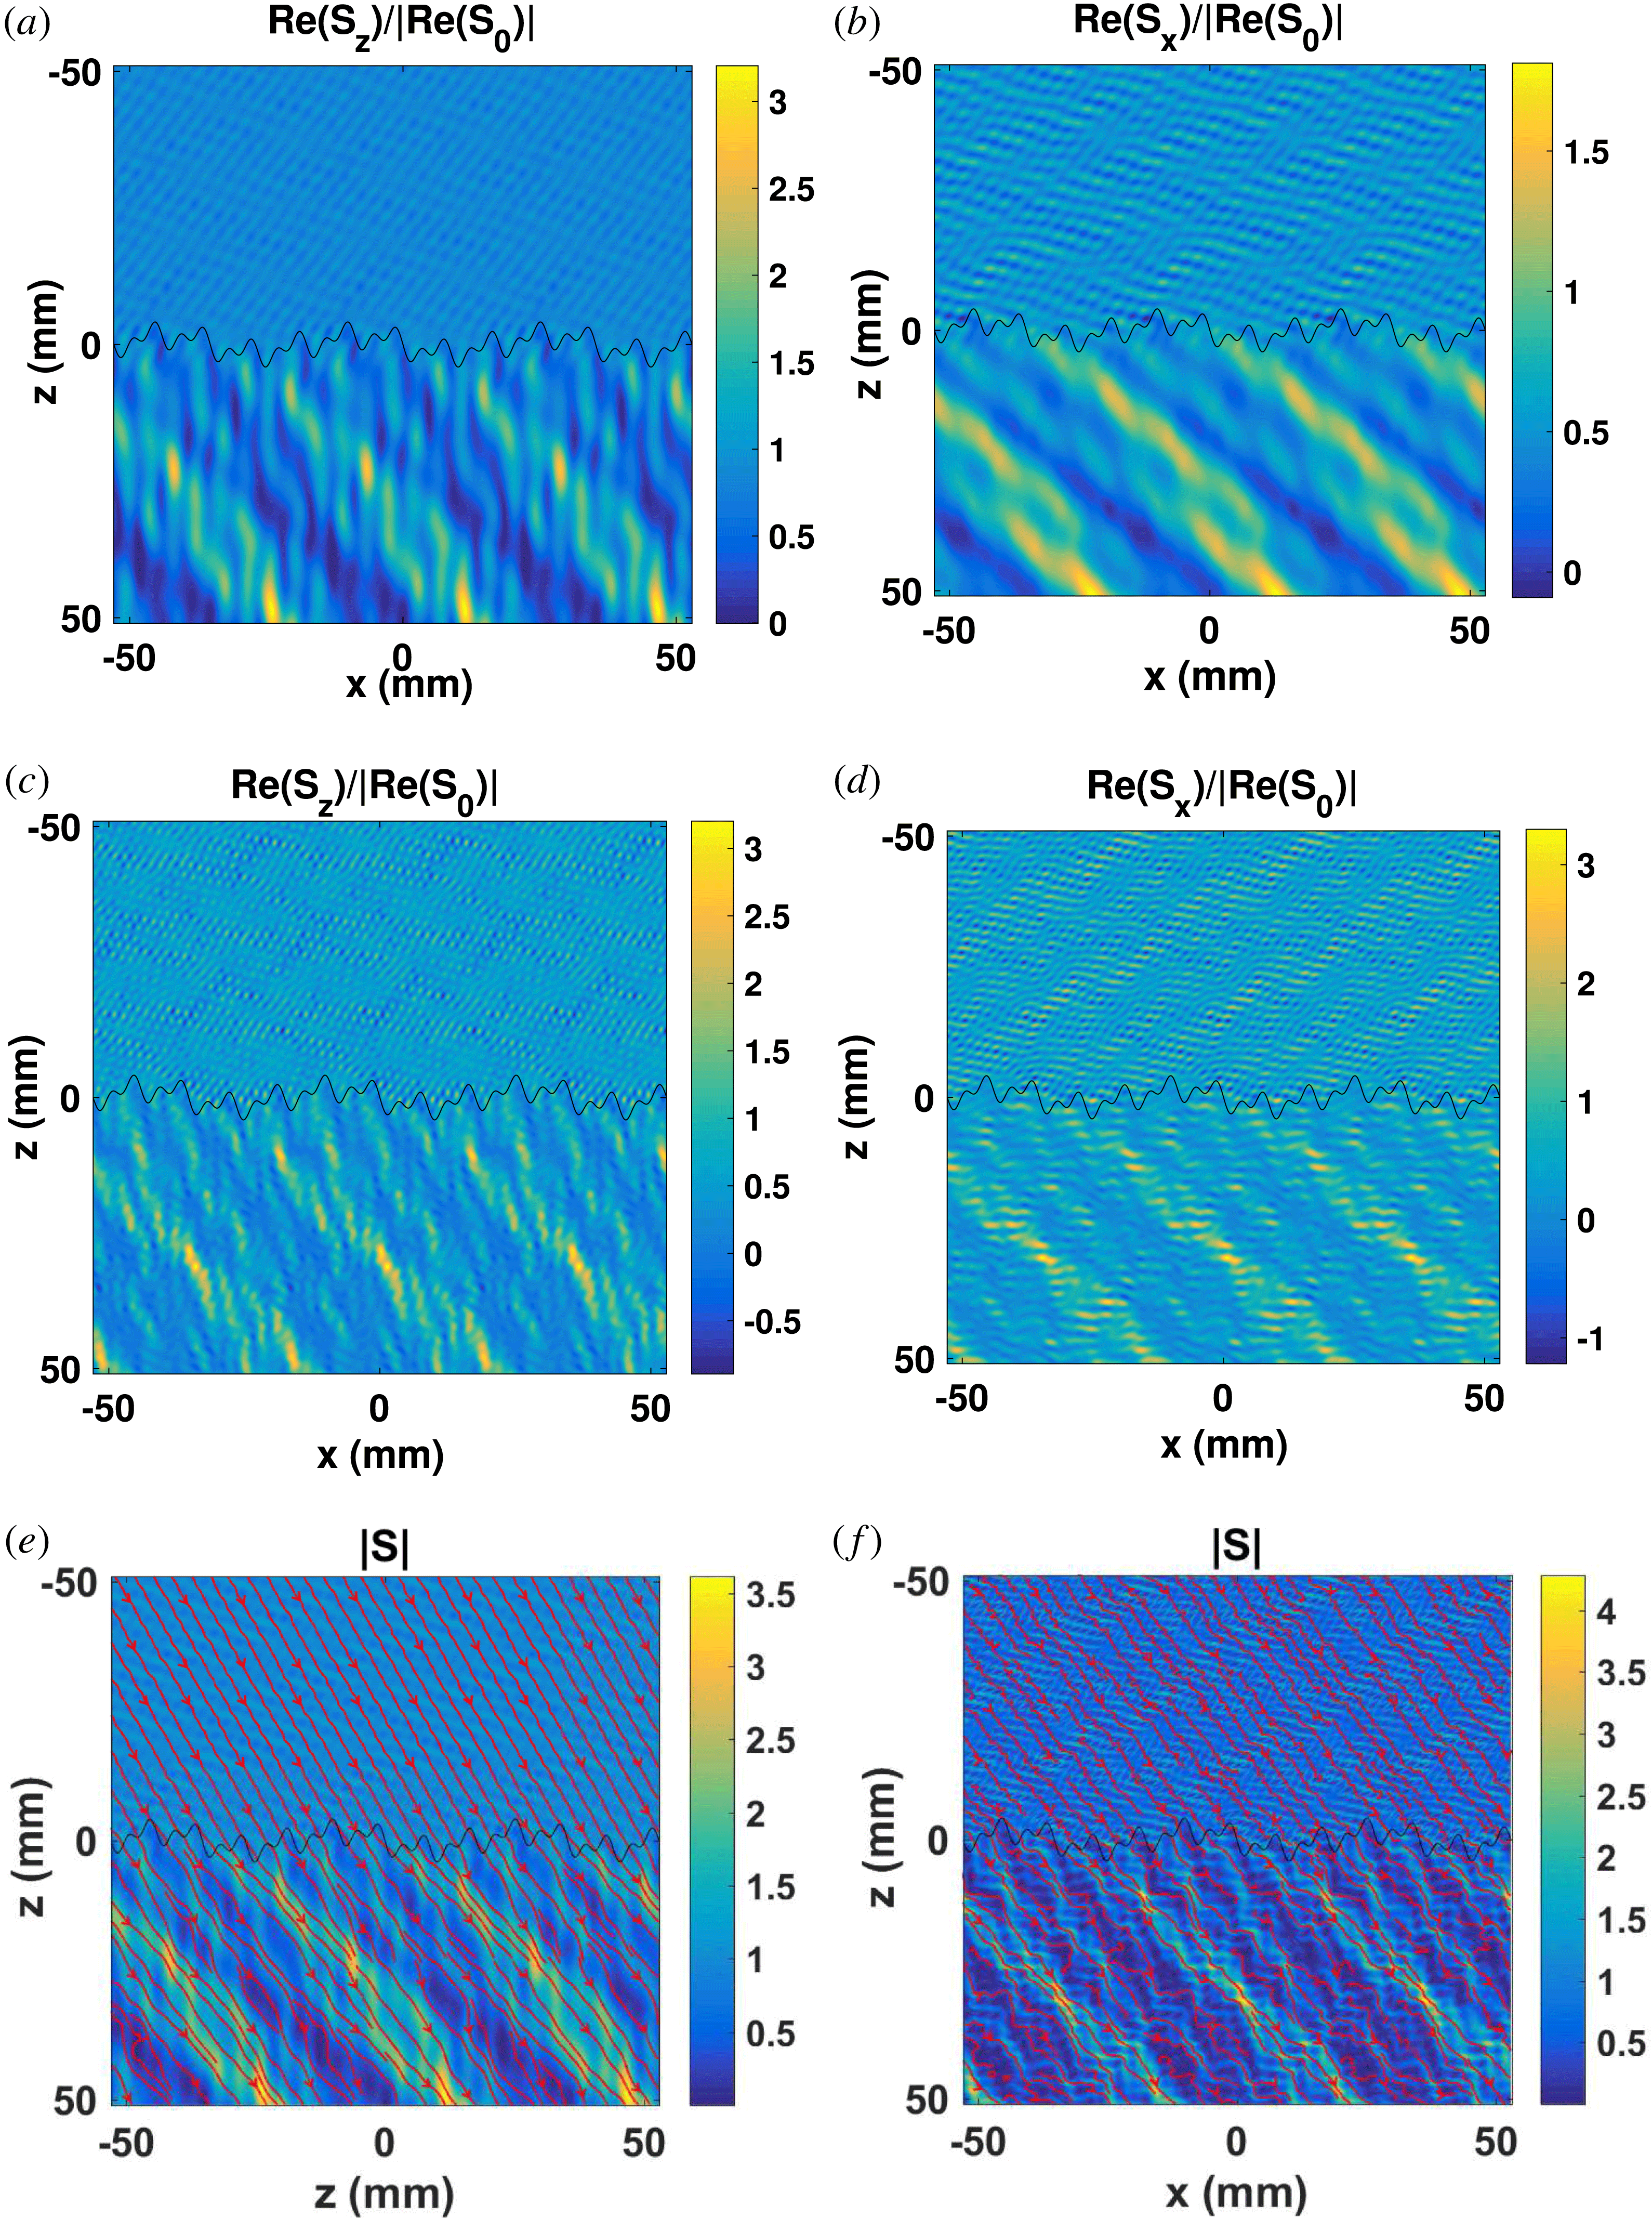
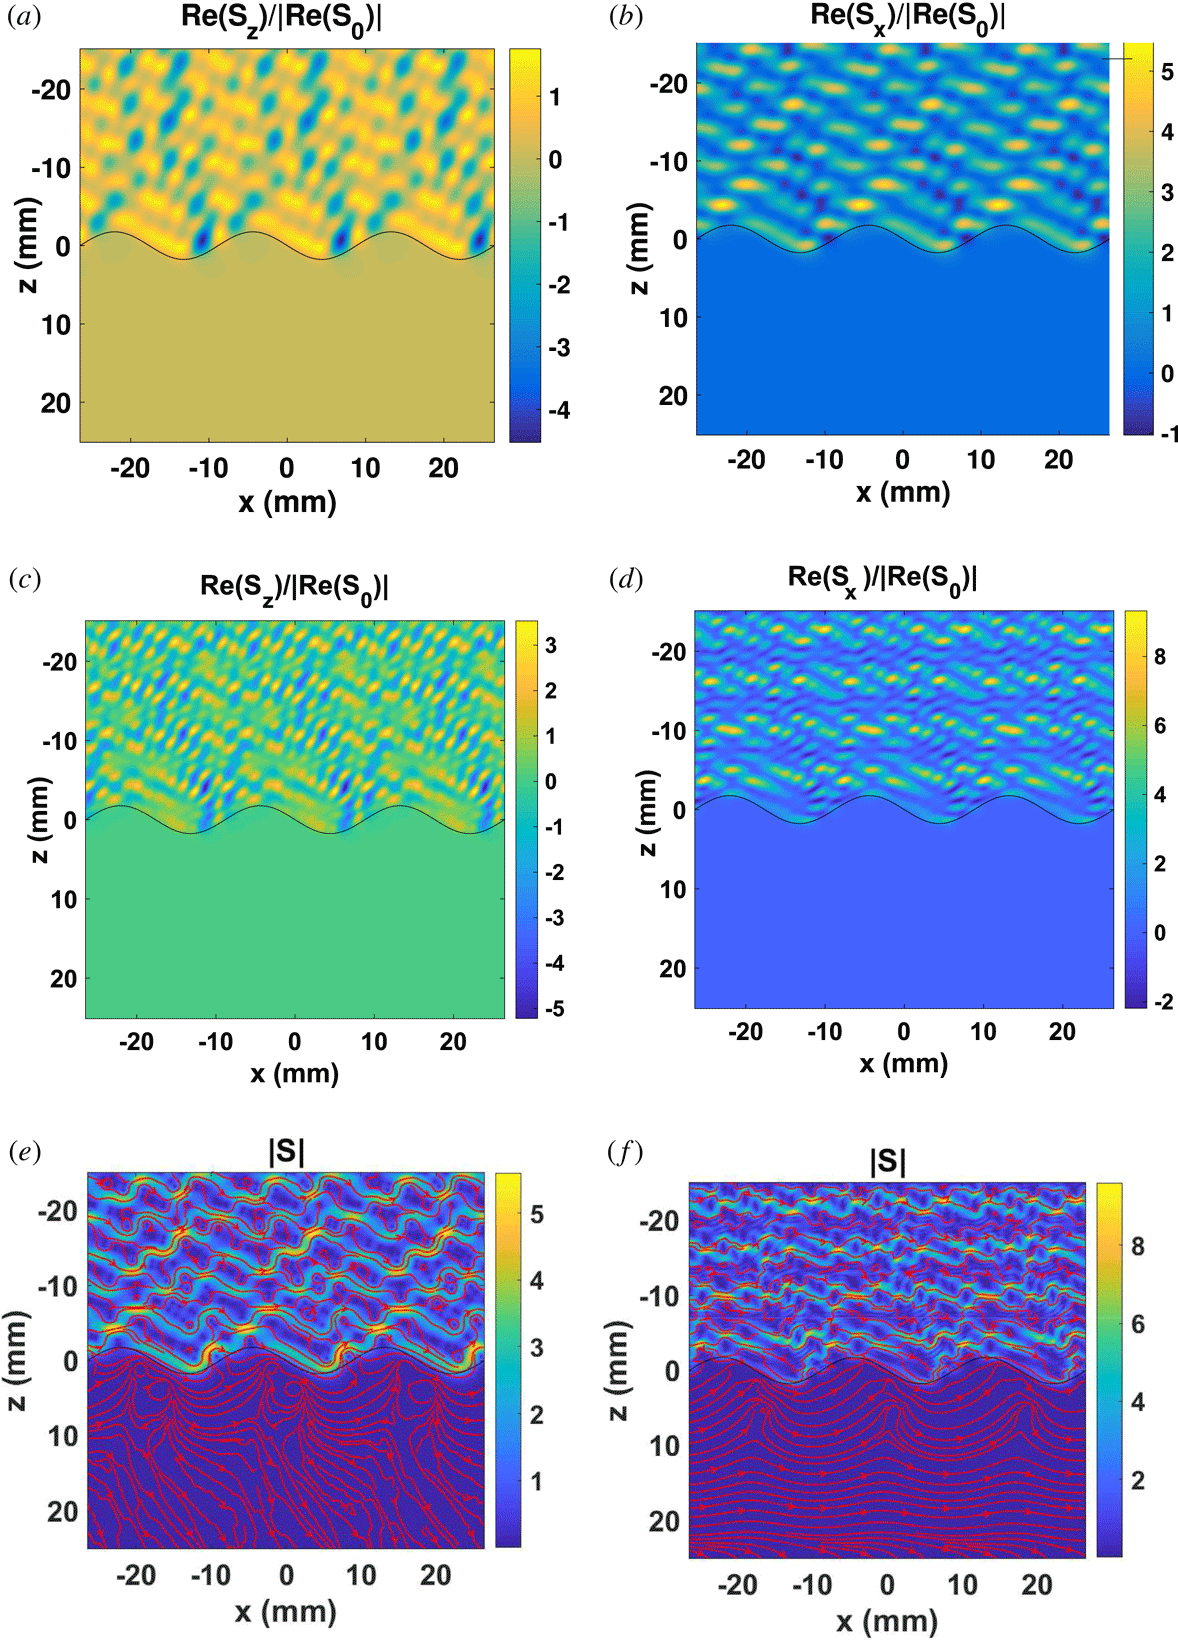
Figure 9. Same parameters as the main simulation of figure 5, except the background blob region is a multimode interface. (a,b) Components of the normalized Poynting vector, O-mode. (c,d) X-mode. (e,f) Normalized Poynting amplitude and Poynting vector flow, for the O and X mode respectively.
Finally in figure 9 the interface region is generated as a superposition of 4 spatial modes (multimode) with periods of 2.5, 5, 10, 20 wavelengths of the incoming wave, and with randomly selected heights, 0.8147, 0.9058, 0.1270, 0.9134 respectively. The blob and background electron densities are the same as in figure 5 (
![]() $n_{\text{bl}.}=3.2\times 10^{20}~\text{m}^{-3}$
,
$n_{\text{bl}.}=3.2\times 10^{20}~\text{m}^{-3}$
,
![]() $n_{\text{bg}.}=3.0\times 10^{20}~\text{m}^{-3}$
). In principle, a periodic plasma grating of any shape can be represented by a superposition of spatial modes (Fourier decomposition). This interface, defined by an appropriate number of modes and weights, could represent a possible realization of an experimentally observed interface region geometry. Similar experimental scenarios have been observed in Ritz et al. (Reference Ritz, Bengtson, Levinson and Powers1984) where, in the Results and Discussion section, it is stated that: ‘Dissipative drift waves and rippling modes, driven by density and temperature gradients, are strong candidates to describe the density and potential fluctuations
$n_{\text{bg}.}=3.0\times 10^{20}~\text{m}^{-3}$
). In principle, a periodic plasma grating of any shape can be represented by a superposition of spatial modes (Fourier decomposition). This interface, defined by an appropriate number of modes and weights, could represent a possible realization of an experimentally observed interface region geometry. Similar experimental scenarios have been observed in Ritz et al. (Reference Ritz, Bengtson, Levinson and Powers1984) where, in the Results and Discussion section, it is stated that: ‘Dissipative drift waves and rippling modes, driven by density and temperature gradients, are strong candidates to describe the density and potential fluctuations
![]() $\ldots$
’. Again the components of spatially varying normalized Poynting vector are shown for O and X modes of the incident wave in figure 9(a)–(d). In figure 9(e,f) at the reflection region, the power flow lines are almost straight lines, since it appears that there is weak reflection due to the weak density contrast and mainly the incident plane wave is present. In the transmission region the power flow lines are irregular due to the complex diffraction effects from the multimode interface.
$\ldots$
’. Again the components of spatially varying normalized Poynting vector are shown for O and X modes of the incident wave in figure 9(a)–(d). In figure 9(e,f) at the reflection region, the power flow lines are almost straight lines, since it appears that there is weak reflection due to the weak density contrast and mainly the incident plane wave is present. In the transmission region the power flow lines are irregular due to the complex diffraction effects from the multimode interface.
5 Conclusions
In this work the FDFD code ScaRF is developed for the analysis of RF wave propagation through a turbulent edge plasma region where dissipative drift waves and rippling modes characterize density fluctuations (see Ritz et al.
Reference Ritz, Bengtson, Levinson and Powers1984). The interfaces between the region of incidence of the RF wave and the turbulent (blob) region are approximated as sinusoidal interfaces or more generally, as arbitrary periodic interfaces. The two regions are anisotropic and the respective permittivities are specified by the cold plasma permittivity tensor (see Stix Reference Stix1992). For the turbulent region a homogenized permittivity tensor is utilized. The FDFD method in ScaRF is formulated for anisotropic media, using Floquet–Bloch–periodic boundary conditions to describe the periodic interface, in conjunction with PMLs to remove irrelevant reflections, and the TFSF interface for the plane wave excitation, which is defined in the background medium and satisfies the anisotropic media dispersion relation. A number of simulations are shown, where the Poynting vector is calculated for O and X mode excitations, and for variations of the period and the amplitude of the modulation, and also of the interface region contrast. Finally, by calculating the Poynting vector of a general periodic interface region, defined as an arbitrary superposition of 4 sinusoidal (with frequency
![]() $\unicode[STIX]{x1D714}_{n}=n\unicode[STIX]{x1D714}_{0}$
,
$\unicode[STIX]{x1D714}_{n}=n\unicode[STIX]{x1D714}_{0}$
,
![]() $n=1,\ldots ,4$
) interfaces, the potential of the method to analyse arbitrary configurations is emphasized. It is noted that there are no limitations in the ScaRF code as to what sort of density fluctuations is prescribed. It can be used for more general representations of the edge fluctuations, periodic or non-periodic. In this work the ScaRF code is applied to a problem which has not been addressed before – namely periodic interfaces.
$n=1,\ldots ,4$
) interfaces, the potential of the method to analyse arbitrary configurations is emphasized. It is noted that there are no limitations in the ScaRF code as to what sort of density fluctuations is prescribed. It can be used for more general representations of the edge fluctuations, periodic or non-periodic. In this work the ScaRF code is applied to a problem which has not been addressed before – namely periodic interfaces.
In the near future, Scarf will be used for more general representations of the plasma edge fluctuations, and in conjunction with the polynomial chaos expansion (PCE) method (see Papadopoulos et al. Reference Papadopoulos, Zygiridis, Glytsis, Kantartzis and Tsiboukis2018), will rigorously analyse the turbulent region–incidence region scattering for random variation of the material and geometric parameters, for periodic or non-periodic structures, and calculate the statistical moments of the Poynting vector.
Acknowledgements
A.K.R. is supported by the US Department of Energy grant numbers DE-FG02-91ER-54109, DE-FG02-99ER-54525-NSTX and DE-FC02-01ER54648. For all other authors, this work has been carried out within the framework of the EUROfusion Consortium and has received funding from the Euratom research and training programme 2014–2018 and 2019–2020 under grant agreement no 633053. The views and opinions expressed herein do not necessarily reflect those of the European Commission.


