Introduction
In high mountain regions the presence of ice in discontinuities can contribute to maintaining the stability of rock slopes. For example, rock falls in such regions often occur in the summer months and have been attributed to the melting of ice in joints (e.g. Reference Bjerrum and JorsbadBjerrum andjorsbad, 1968; Reference Dramis, Govi, Guglielmin and MortaraDramis and others, 1995; Reference Matsuoka and SakaiMatsuoka and Sakai, 1999). Because the strength of ice is a function of temperature, weakening of ice-bonded joints is likely as rock temperatures rise. This paper specifically addresses this issue. In addition, phase change will result in the release of water, causing raised water pressure in rock joints, reduced effective stress and thus a lowering of the factor of safety. Such slopes may therefore be sensitive to changes in the thermal environment (e.g. the impact of climate change). Physical modelling allows the mechanisms associated with the stability of frozen rock slopes to be investigated under highly controlled boundary conditions and provides the opportunity to explore the consequences of changes in thermal regime.
An investigation of the effects of warming on the stability of ˚ice-strengthened" rock slopes is being conducted as part of the European Union (EU) project ˚Permafrost and Climate in Europe" (PAGE). The study is centred on physical modelling using the technique of geotechnical centrifuge testing (e.g. Reference SchofieldSchofield, 1980). Scaled models of suitable prototype slopes are constructed and then permitted to thaw during centrifuge operation in a study that will incorporate an investigation of both rock-wall and deep-seated potential failure mechanisms. The data from the experiments will be used to assess performance prior to failure and to identify trigger mechanisms.
In order to analyze the centrifuge models, to assess the factor of safety against failure at different stages in an experiment, it is required that the shear strength properties of the discontinuities, with and without the presence of ice, are known. Therefore, as a precursor to the programme of centrifuge modelling, an experimental investigation of the strength of ice-filled rock joints was conducted. The factors affecting the interface shear strength between ice and a joint surface of repeatable roughness (i.e. the concrete blocks) were investigated in a series of direct shear-box tests conducted using an apparatus that could be maintained at constant sub-zero temperatures.
Test Procedure
Materials selection
In the programme of centrifuge model tests it is vital that the roughness of rock joints is repeatable between experiments. The required level of consistency in joint roughness between models is considered to be very difficult, if not impossible, to achieve with natural materials. However, it is vital that the material used to represent rock in the experiments has similar engineering proprieties to that encountered in the field. To simulate Granite, one of the more common rock types found in the Alps, high-strength concrete was selected for use in the models. Laboratory compression testing indicated that cast blocks of high-strength concrete have mechanical properties very similar to those commonly measured for Granite: the measured values of Young’s modulus and uniaxial compressive strength were 63.4 GPa and 182.8 MPa, respectively.
Specimen preparation
The concrete was cast in a specially designed mould against a profiled base to achieve a repeatable roughness (Fig. 1). Depending on discontinuity type, in the field there will be a wide range of joint roughness. Since the shear-box tests were conducted to permit interpretation and analysis of generic centrifuge model tests, it was essential that a regular pattern of asperities, which falls within the range of values observed in the field (e.g. Reference Hoek and BrayHoek and Bray, 1981), was selected. In addition, it was necessary that the pattern could be cast repeatedly. The asperities have a regular pattern of height a = 0.55 mm, wavelength S = 5 mm and roughness angle 13 = 20°. The concrete samples were cured under water for 28 days to achieve the required strengths. To prepare an ice/ concrete specimen for shearing, a concrete sample was placed into the base of a watertight steel mould, which was then filled with water and placed in a thermostatically controlled room set to the required specimen temperature.

Fig. 1 (a) Specimen configuration, (b) Roughness properties: asperities height a =0.55mm, wavelength 5 = 5mm and roughness angle (3 =20°. (c) The concrete part of the specimen, (d) Specimen after shearing.
After 24 hours the steel mould was disassembled and the ice/concrete sample placed into the shear box, which was located in the same thermostatically controlled room. Care was taken to prevent melting or other disturbance of the sample. A thin layer of fine sand, cooled to the same temperature as the sample, was placed on top of the ice to distribute the load from the loading cap equally over the top surface of the sample (Fig. Id). The apparatus with the sample was left for a minimum period of 5 hours before testing to achieve thermal equilibrium. The temperature of the ice in the sample was monitored using a thermocouple placed into the water before freezing. The thermocouple was linked to a digital thermometer allowing the temperature to be monitored throughout preparation and testing to an accuracy of ±0.1 °C.
This process adopted for sample preparation did not reproduce exactly field conditions where ice in joints forms under pressure (Reference TharpTharp, 1987) and is anisotropic. However, the purpose of these experiments was to obtain generic data to interpret the processes observed in centrifuge model experiments, and the method of preparation described herein will be closely followed when building model rock slopes.
Testing techniques
The laboratory measurements were conducted following the general procedures of BS 1377 (British Standards Institution, 1990), but using a modified shear-box apparatus as shown in Figure 2. The apparatus consists of a spit box into which a sample is placed. The sample is loaded with a normal force and then subjected to direct shear by moving the lower part of the box horizontally whilst restraining the upper part of the box. For the experiments described herein, the concrete block was placed in the lower part of the box, care being taken to ensure that the interface between the ice and the concrete coincided with the level of the split between the upper and lower sections of the box. Linear voltage displacement transformers (LVDTs) were used to measure displacement in the horizontal (a;) and vertical (y) directions, and a load cell measured shear force. These three monitoring devices were connected, through amplifiers, to a computer that automatically logged time-averaged readings at predetermined intervals. Shearing in all tests was conducted at a rate of 0.6 mm h–1. This rate was chosen to permit a test to be conducted within 1 day. However, it coincides with the sliding speed in experiments to measure the friction of polycrystalline ice sliding on granite at which Reference Barnes, Tabor and WalkerBarnes and others (1971) observed plastic flow and fracture, and the highest values of the coefficient of friction.
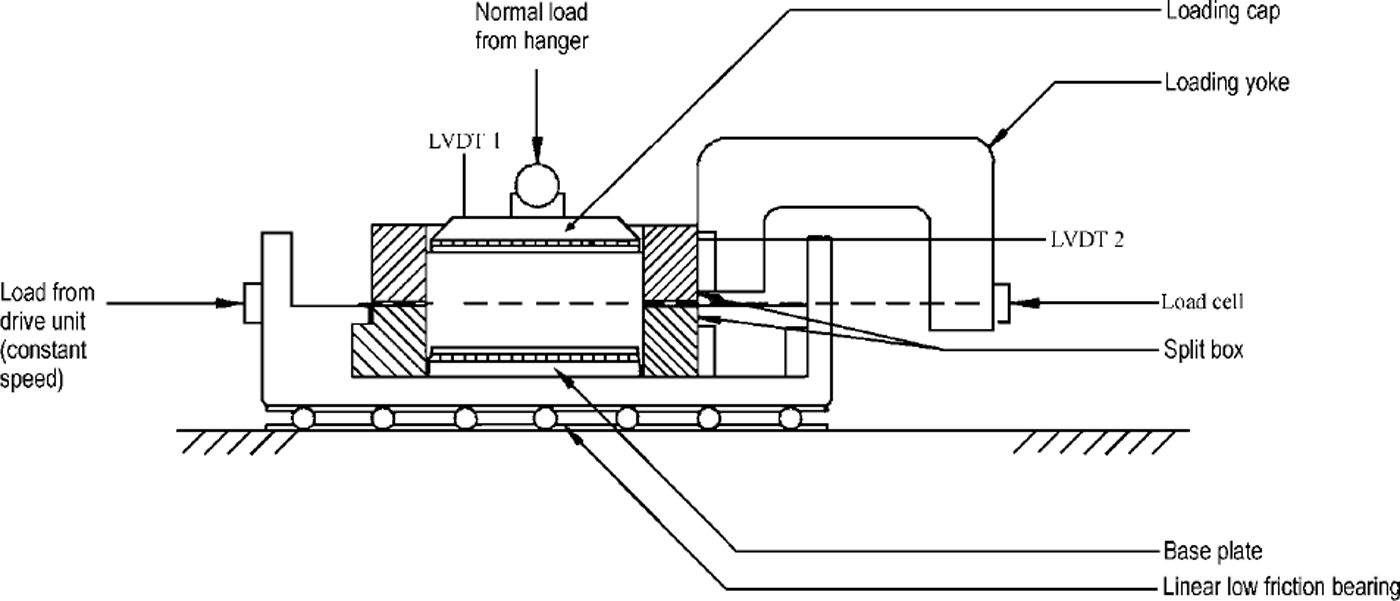
Fig. 2. General arrangement of shear-box apparatus (modified after British Standards Institution, 1990).
Experimental Results
The interface shear strength between ice and the joint surface was investigated at three temperatures, –5°, –2° and –0.5°C. For each temperature, at least three tests were conducted at different values of normal stress, ω7.
An example of the relationships of shear stress, τ, and vertical displacement, Δy, against horizontal displacement, Δx, is displayed in Figure 3. As the shear load was applied to the sample, a shear stress developed at the interface between the concrete and the ice that can be defined as the resistance to shearing between these two materials to the applied force. This resistance increased very rapidly with horizontal displacement until the maximum resistance was reached (Fig. 3a), at which point the sample displayed brittle behaviour. As shearing proceeded in this test, the sample initially dilated, then compressed before dilating again (Fig. 3b). The second dilating phase coincided with a second rise in shear stress at a displacement of approximately 5.5 mm.

Fig. 3. Result of shear test conducted at a temperature of –2°C and a normal stress of 100 k Pa: (a) relationship between shear stress, τ, and horizontal displacement, Δx; (b) relationship between vertical displacement, Δy, and horizontal displacement, Δx.
The cycle of dilation and compression took place over a displacement of approximately 5 mm, which is the wavelength, S, of the asperities. Therefore, the cycle corresponded to the passage of ice over one wavelength. The height of asperities is 0.55 mm, but Figure 3b indicates that the ice lifted by only 0.45 mm as it passed over the peak of the asperities. This implies that there was some accommodation of the ice in the base of the ice layer during shear. Clearly, to conform to the shape of the surface of the concrete, the surface of the ice contained both peaks and troughs. Therefore, the mechanisms associated with ice accommodation were probably a combination of ice pressure melting, viscous deformation and shearing-off of ice peaks (i.e. with dilation, the area of the potential shear surface decreased until the shear stress in the ice reached its failure strength).
The peak shear stress, at a horizontal displacement Δx = 0.6 mm, did not coincide with the maximum vertical displacement, at Δx = 3 mm. This is consistent with the shearing behaviour of natural soils and rock joints. During shear tests on these materials, it is observed that the peak shear stress, τ, occurs when the sample experiences the maximum rate of dilation (i.e. the gradient Δy/Δx is at a maximum). In the light of work conducted during shearing of a specimen subjected to a normal stress, a, this phenomenon may be shown theoretically (Reference TaylorTaylor, 1948):
where μ is the frictional constant at critical state.
As shown in Figure 4, which displays the full series of tests conducted using samples at –5°C, with increase in normal stress from 100 kPa to 1400 kPa there was a gradual change in shearing behaviour. An increase in normal stress resulted in an increase in initial stiffness, increased shear resistance and more ductile post-peak-shear-stress behaviour (Fig. 4a). The volume-change (i.e. vertical displacement) behaviour also varied, displaying a gradual change from dilation to compression (Fig. 4b), although the influence of the asperities, s = 5 mm, was still clear in all plots. These data show that with increased normal load it became more difficult for the sample to dilate, resulting in a greater accommodation by the ice. The increased shear stress with increased normal load resulted from a number of components, i.e. doing work against external load, interface friction and shearing a larger cross-section of ice.
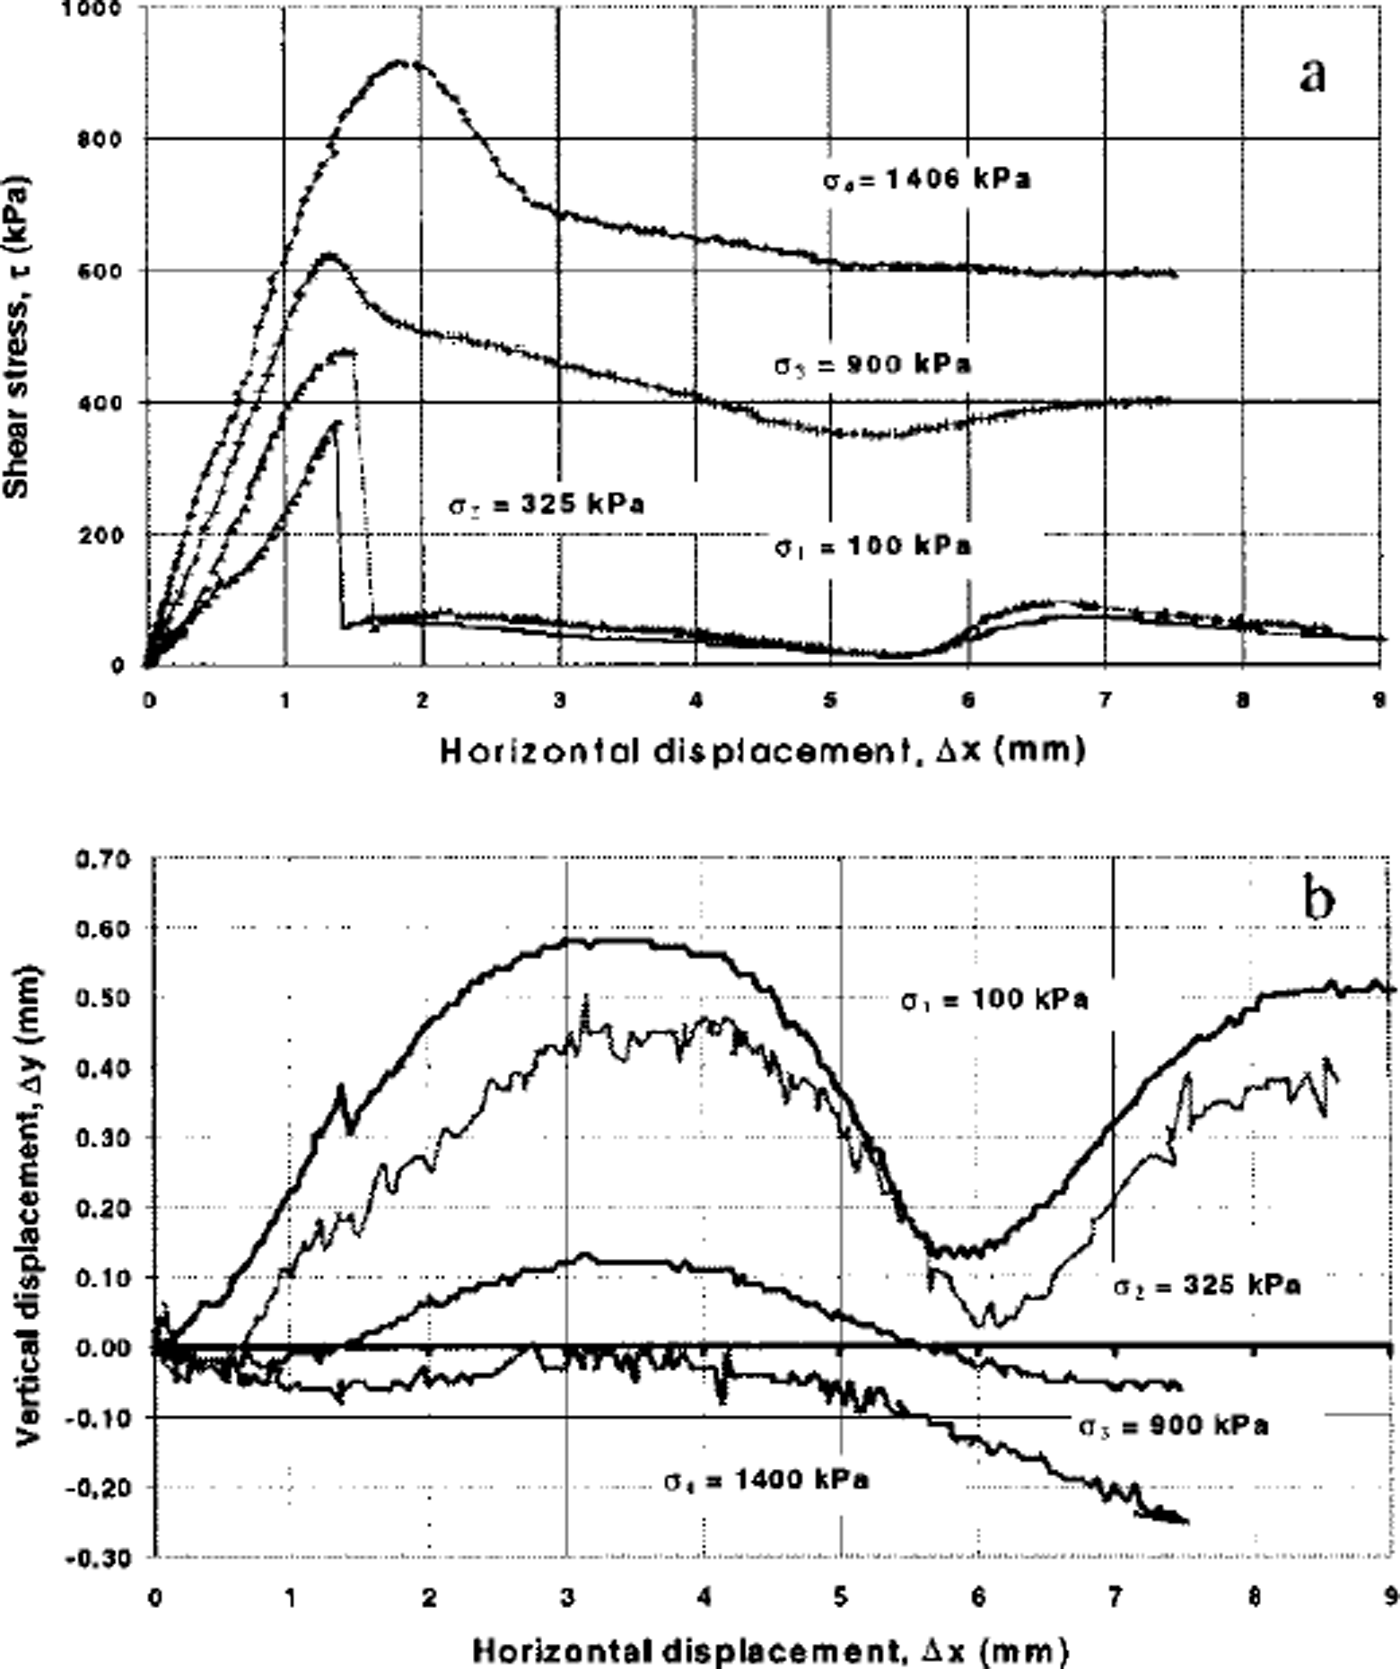
Fig. 4. Results of a series of shear tests at a temperature of-5°C and normal stresses a = 100, 325, 900 and 1400 kPa: (a) relationship–––) between6 shear stress, T and6 horizontal displacement,lciCδfH67lt Δx; (b) relationship between vertical displacement, Δy, and horizontal displacement, Ax.
The dilation measured in the test conducted at a = 100 kPa and –5°C (Fig. 4b) was slightly greater than that shown in Figure 3b, which was sheared at –2°C, indicating reduced ice accommodation, and hence increased ice strength with reduction in temperature (e.g. Reference Fish and ZaretskyFish and Zaretsky, 1997).
To permit comparison between ice-filled and unfrozen joints, the interface shear behaviour of two blocks of concrete was also investigated. The experimental procedure was very similar to that described above, except that the ice was replaced by a second identical concrete block (inverted so the rough surfaces were in contact). The test results, presented in Figure 5, show similar trends to those observed in the ice/concrete tests (Fig. 4) except that at the higher values of normal stresses the concrete/concrete specimens did not display ductile behaviour but a series of peaks in shear stress as shearing proceeded. At the highest normal stress (1438 kPa) the joint compressed. This result indicates erosion of the asperities, and this was confirmed on examination of the shear surface following shear. As with the ice/ concrete specimens, the shear stress behaviour was consistent with that of natural geomaterials during shear.
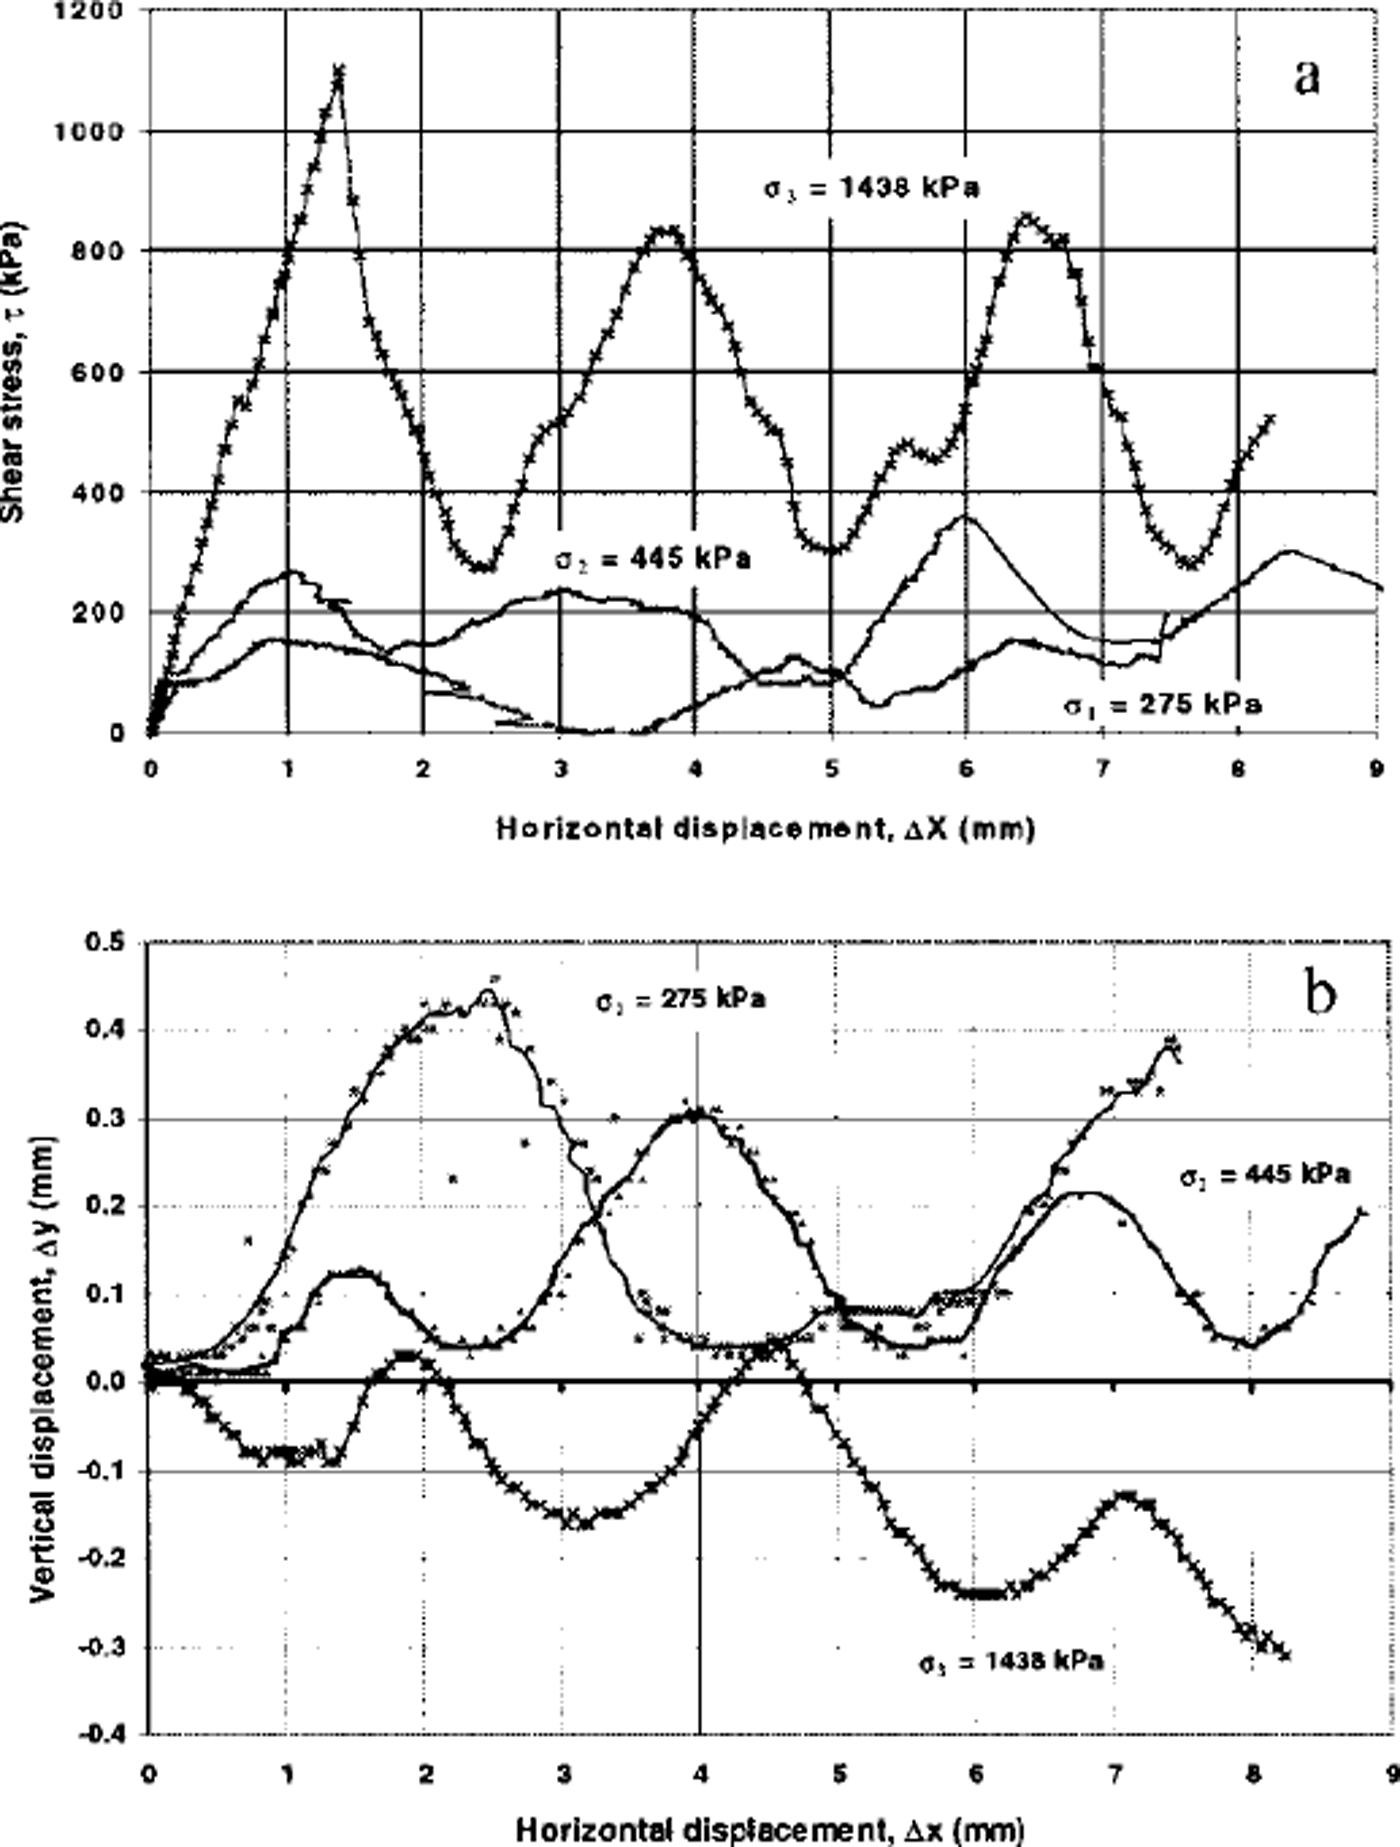
Fig. 5. Results of a series of shear tests for the concrete blocks with no ice: (a) relationship between shear stress, τ, and horzzontal displacement, Δx; (b) relationship between vertical displacement, Δy, and horizontal displacement, Ax.
Discussion
Coulomb lines for three series of ice/concrete shear tests are plotted in Figure 6a. The figure shows clearly that the shear strength of the ice/concrete interface is a function of both normal stress and temperature. The Coulomb lines for the ice/concrete tests may be represented by
where c(T) and δ(T) are temperature-dependent parameters, which represent the intercept of the line with the τmax axis and the gradient of the line, respectively.
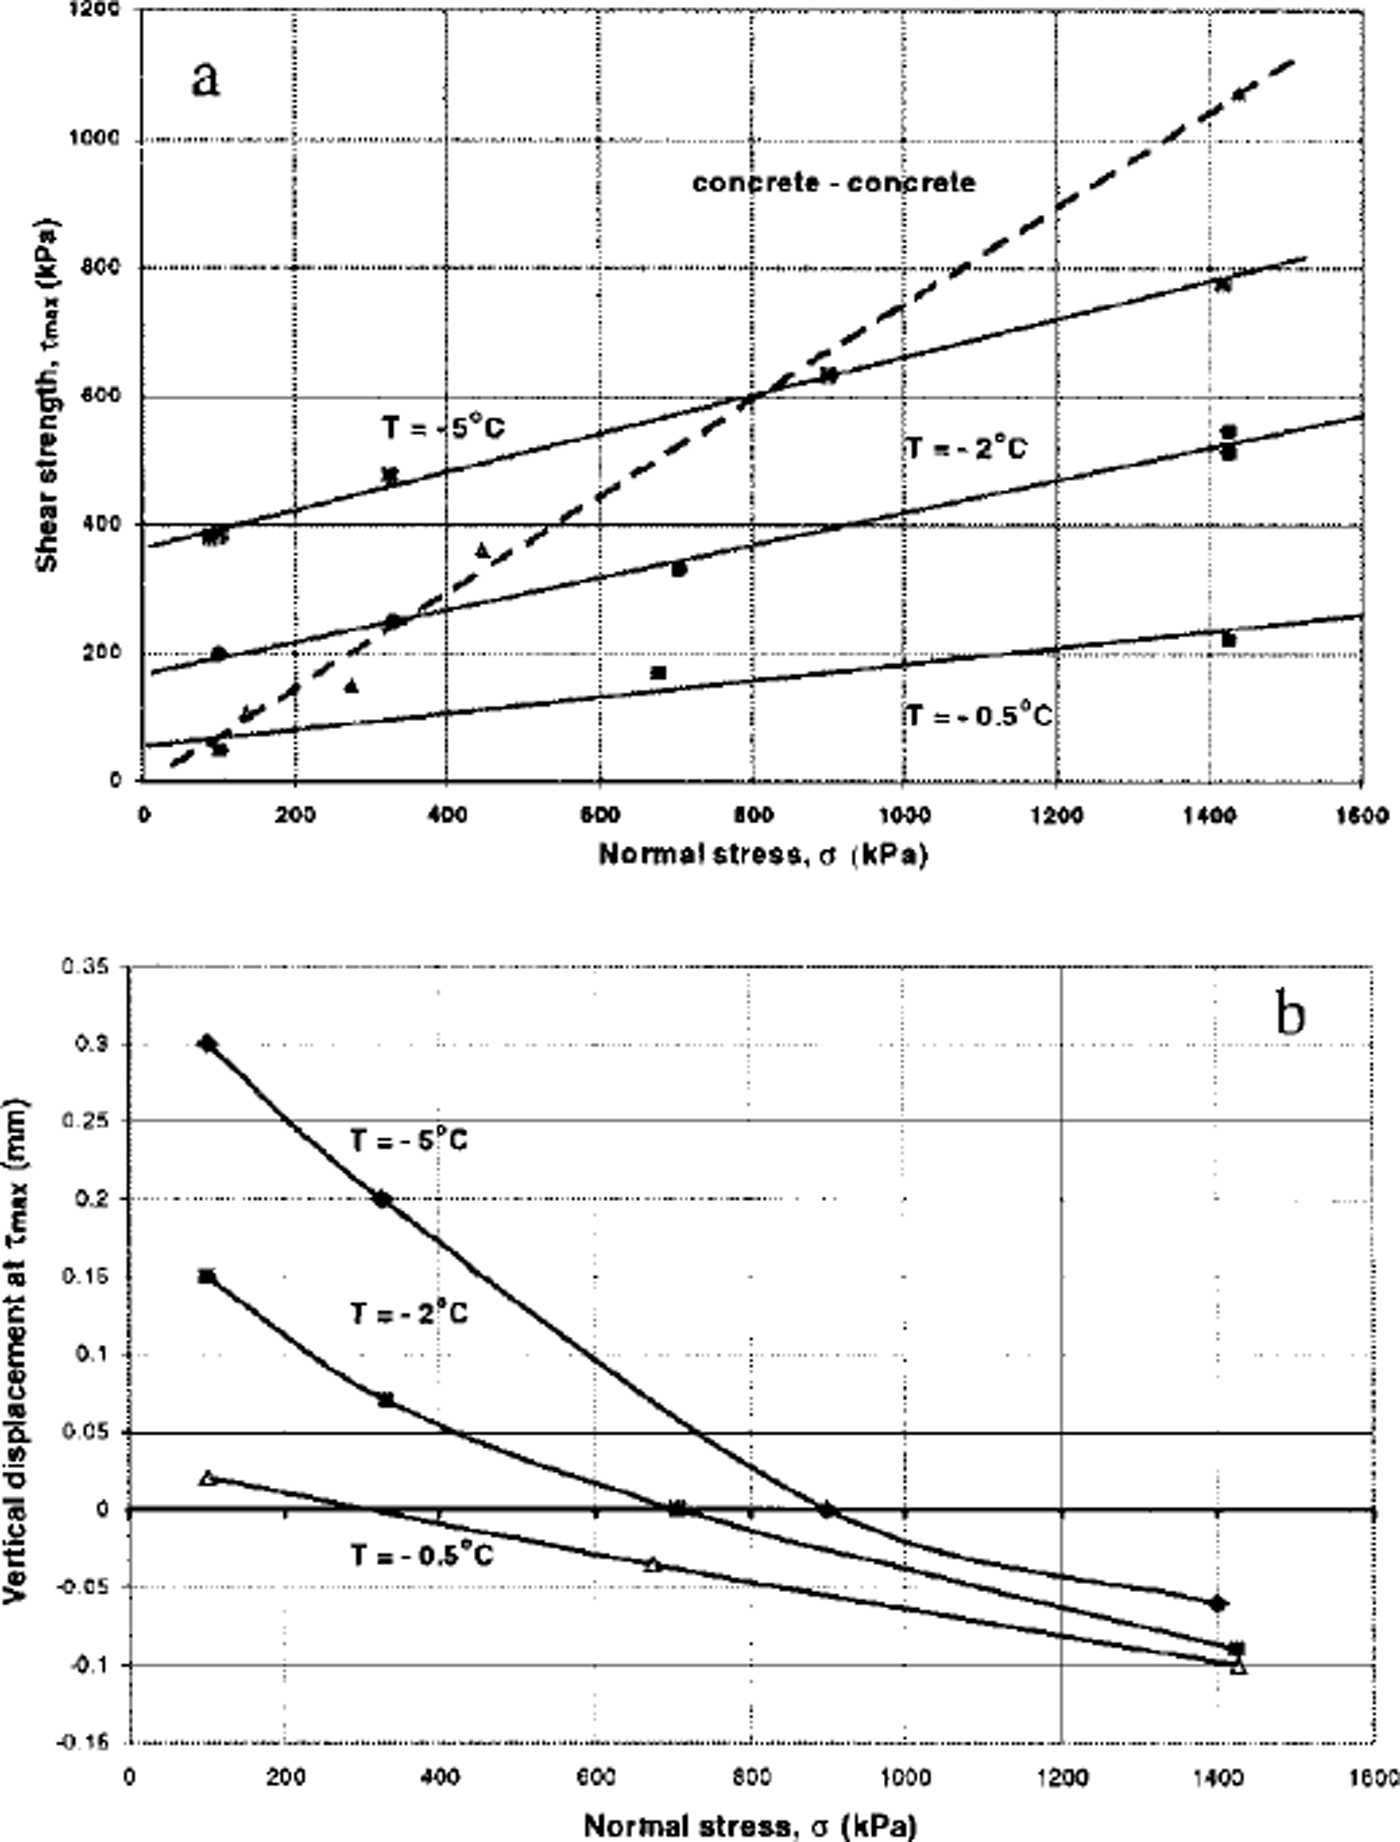
Fig. 6. The relationship between peak shear strength, τmax, and normal stress, a (a), and between vertical displacement at peak shear strength, τmax, and normal stress, a (b), at three different test temperatures –5\ –T and–0.5˚C
A better understanding of the phenomena associated with the shear strength behaviour may be obtained by considering the volume change at the interface during shear. Figure 6b shows, for each series of tests, the relationship between vertical displacement at the peak shear stress and the normal stress. This plot also indicates consistent temperature-dependent behaviour. The shear strength of ice is a function of both confining pressure and temperature (e.g. Reference Fish and ZaretskyFish and Zaretsky, 1997), so for a given normal stress a decrease in temperature will cause an increase in shear strength. Colder ice asperities offer a greater resistance to shear, and hence have a greater tendency to ˚ride over" the concrete asperities, causing increased dilation (Fig. 7a and b). With increase in normal stress, the work required to cause dilation increases. Since this results in less separation at the joint, a larger proportion of the ice asperity is subjected to shear stresses (Fig. 7c), and this, combined with increased frictional shear stresses at the interface between concrete and ice, offers a greater resistance to shear. This may be represented by a modified version of Equation (1):
where μ(T)* is a temperature-dependent property representing the interface phenomena described above. It has been demonstrated from experimental data (e.g. Reference Fish and ZaretskyFish and Zaretsky, 1997) that the variation of the strength of ice with temperature may be represented by an Arrhenius-type equation. It is reasonable to assume, therefore, that the parameter μ(T)*will vary according to an Arrhenius law. At higher stresses and temperatures the data indicate that samples compress during shear (Fig. 6b). This is caused by accommodation resulting from pressure melting and regelation of the ice (which, as the data indicate, occurs more readily at higher temperatures) caused by the complex combination of normal and shear stresses acting on the asperities. However, Equation (3) still holds in this case.
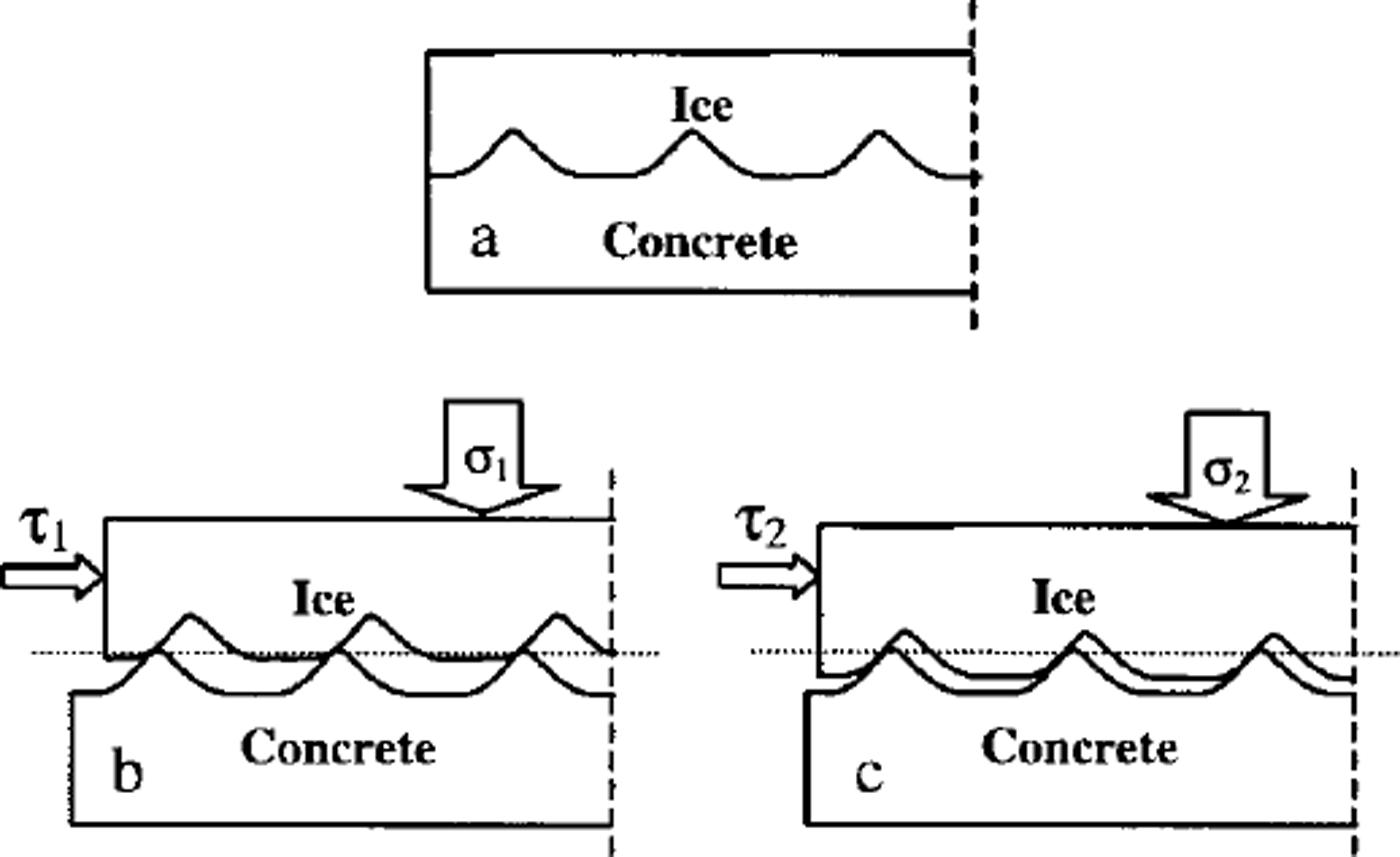
Fig. 7. (a) Joint surface of a sample before shearing. (b,c) lee dilation under two different normal stresses σ16 and σ2, where a, ≤ σ2 and ≤ τ2. The dilation in (b) is more than that in (c).
The Coulomb line for the concrete/concrete interface tests is also plotted in Figure 6a. At low temperatures and normal stresses the strength of an ice-filled joint can be significantly higher than that of a closed unfrozen joint. Conversely, at higher stresses and temperatures, the strength of an ice-filled joint can be significantly less than that of a closed unfrozen joint.
Conclusions
In order to quantify the influence of temperature on the strength of ice-filled rock joints, direct shear-box tests were conducted to measure the phenomena associated with shear on the interface between ice and a simulated rock-joint surface. Tests conducted at three different temperatures, representing the range of temperature commonly observed in Alpine permafrost, indicated that the measured stiffness and strength of the interface was a function of both normal stress and temperature. Increase in normal stress resulted in increased shear resistance and more ductile post-peak-shear-stress behaviour, and reduction in temperature caused an increase in shear resistance. The peak strength may be represented by a series of isothermal Coulomb lines.
During shear, depending on the value of normal stress, either dilation or compression occurred at the ice/concrete interface. This behaviour was found to vary consistently with temperature and normal stress, leading to the conclusion that the shear force consists of two components: one to do work against the normal load (dilation), and the other to ˚accommodate" the ice by overcoming its shear strength and causing pressure melting or viscous deformation of the ice.
Comparison of these data with the results of similar direct shear tests conducted on unfrozen joints indicates that at low temperatures and normal stresses the strength of an ice-filled joint can be significantly higher than that of an unfrozen joint In the absence of sufficient closure pressure, the strength of an ice-filled joint can be significantly less than that of an unfrozen joint.
In addition to the phenomenological findings of this study, the results of the experiments relate directly to the field case where rock discontinuities are sufficiently large that shear strength between ice and rock is controlled by the interface shear strength only. An investigation into the influence on interface shear behaviour of joint width and the rate of shearing is currently being conducted.
Acknowledgements
This research was undertaken as part of the EU PACE research project (DG-XII contract ENV4–CT97–0492).


