1 Introduction
Simultaneous flow of gas and liquid through a conduit, over a wide range of flow rates, exhibits a ‘slug flow’ pattern, which consists of the pseudo-periodic appearance of large bubbles (often called Taylor bubbles) separated by liquid slugs (Fabre & Liné Reference Fabre and Liné1992). The shape and motion of Taylor bubbles in tubes have been extensively investigated over the past decades (Davies & Taylor Reference Davies and Taylor1950; White & Beardmore Reference White and Beardmore1962; Zukoski Reference Zukoski1966; Collins Reference Collins1967b ; Collins et al. Reference Collins, de Moraes, Davidson and Harrison1978; Reinelt Reference Reinelt1987b ; Vanden-Broeck Reference Vanden-Broeck1984, Reference Vanden-Broeck1992; Viana et al. Reference Viana, Pardo, Yánez, Trallero and Joseph2003; Figueroa-Espinoza & Fabre Reference Figueroa-Espinoza and Fabre2011; Fabre Reference Fabre2016). In contrast, much less effort has been devoted to studying Taylor bubbles in annuli, which are, however, very relevant for many industrial applications such as energy dissipation facilities for chemical/nuclear reactors, casing-tubing annuli for oil production and double-pipe heat exchangers for geothermal systems (Kelessidis & Dukler Reference Kelessidis and Dukler1990; Das et al. Reference Das, Das, Purohit and Mitra1998; Ekberg et al. Reference Ekberg, Ghiaasiaan, Abdel-Khalik, Yoda and Jeter1999).
In an annulus, flow is confined between the inner surface of an outer pipe and the outer surface of an inner pipe. If the thickness of the gap between the two surfaces is much smaller than the perimeter of the pipe, the annulus is then similar to a Hele-Shaw cell. The problem of two-phase flow in a Hele-Shaw cell between two parallel flat plates has been the focus of many previous theoretical, experimental and numerical studies (e.g. Taylor & Saffman Reference Taylor and Saffman1959; Collins Reference Collins1965a
, Reference Collins1967a
; Maxworthy Reference Maxworthy1986; Kopf-Sill & Homsy Reference Kopf-Sill and Homsy1988; Roig et al.
Reference Roig, Roudet, Risso and Billet2012; Cueto-Felgueroso & Juanes Reference Cueto-Felgueroso and Juanes2014). Large bubbles in a Hele-Shaw cell (the bubble characteristic length,
![]() $d$
, is much greater than the gap thickness between the plates,
$d$
, is much greater than the gap thickness between the plates,
![]() $h$
) behave very differently from bubbles in an unbounded liquid due to the presence of wall confinement and wettability effects (Thompson Reference Thompson1968; Eck & Siekmann Reference Eck and Siekmann1978; Saffman & Tanveer Reference Saffman and Tanveer1989; Cueto-Felgueroso & Juanes Reference Cueto-Felgueroso and Juanes2014). The bubble dynamics in a Hele-Shaw cell can be characterised by the bubble Reynolds number
$h$
) behave very differently from bubbles in an unbounded liquid due to the presence of wall confinement and wettability effects (Thompson Reference Thompson1968; Eck & Siekmann Reference Eck and Siekmann1978; Saffman & Tanveer Reference Saffman and Tanveer1989; Cueto-Felgueroso & Juanes Reference Cueto-Felgueroso and Juanes2014). The bubble dynamics in a Hele-Shaw cell can be characterised by the bubble Reynolds number
![]() $Re=\unicode[STIX]{x1D70C}_{l}u_{\infty }d/\unicode[STIX]{x1D707}_{l}$
(
$Re=\unicode[STIX]{x1D70C}_{l}u_{\infty }d/\unicode[STIX]{x1D707}_{l}$
(
![]() $u_{\infty }$
is the bubble velocity relative to the ambient liquid having a density
$u_{\infty }$
is the bubble velocity relative to the ambient liquid having a density
![]() $\unicode[STIX]{x1D70C}_{l}$
and a dynamic viscosity
$\unicode[STIX]{x1D70C}_{l}$
and a dynamic viscosity
![]() $\unicode[STIX]{x1D707}_{l}$
). In addition, the gap Reynolds number
$\unicode[STIX]{x1D707}_{l}$
). In addition, the gap Reynolds number
![]() $Re(h/d)^{2}$
is often used to compare the in-plane inertial effect and the cross-gap viscous effect (Thompson Reference Thompson1968; Eck & Siekmann Reference Eck and Siekmann1978; Bush & Eames Reference Bush and Eames1998; Roig et al.
Reference Roig, Roudet, Risso and Billet2012). When
$Re(h/d)^{2}$
is often used to compare the in-plane inertial effect and the cross-gap viscous effect (Thompson Reference Thompson1968; Eck & Siekmann Reference Eck and Siekmann1978; Bush & Eames Reference Bush and Eames1998; Roig et al.
Reference Roig, Roudet, Risso and Billet2012). When
![]() $Re(h/d)^{2}\ll 1$
, the flow corresponds to the classical Hele-Shaw flow regime where the inertia is negligible (Saffman & Taylor Reference Saffman and Taylor1958; Taylor & Saffman Reference Taylor and Saffman1959; Eck & Siekmann Reference Eck and Siekmann1978; Maxworthy Reference Maxworthy1986; Tanveer Reference Tanveer1986, Reference Tanveer1987; Tanveer & Saffman Reference Tanveer and Saffman1987; Kopf-Sill & Homsy Reference Kopf-Sill and Homsy1988; Meiburg Reference Meiburg1989; Saffman & Tanveer Reference Saffman and Tanveer1989; Maruvada & Park Reference Maruvada and Park1996; Cueto-Felgueroso & Juanes Reference Cueto-Felgueroso and Juanes2014). When
$Re(h/d)^{2}\ll 1$
, the flow corresponds to the classical Hele-Shaw flow regime where the inertia is negligible (Saffman & Taylor Reference Saffman and Taylor1958; Taylor & Saffman Reference Taylor and Saffman1959; Eck & Siekmann Reference Eck and Siekmann1978; Maxworthy Reference Maxworthy1986; Tanveer Reference Tanveer1986, Reference Tanveer1987; Tanveer & Saffman Reference Tanveer and Saffman1987; Kopf-Sill & Homsy Reference Kopf-Sill and Homsy1988; Meiburg Reference Meiburg1989; Saffman & Tanveer Reference Saffman and Tanveer1989; Maruvada & Park Reference Maruvada and Park1996; Cueto-Felgueroso & Juanes Reference Cueto-Felgueroso and Juanes2014). When
![]() $Re(h/d)^{2}$
is close to or larger than 1, the inertia becomes important, as has been observed for bubbles in inclined or vertical Hele-Shaw cells (Collins Reference Collins1965a
,Reference Collins
b
; Grace & Harrison Reference Grace and Harrison1967; Lazarek & Littman Reference Lazarek and Littman1974; Maneri & Zuber Reference Maneri and Zuber1974; Hills Reference Hills1975; Vanden-Broeck Reference Vanden-Broeck1984, Reference Vanden-Broeck1992; Couet & Strumolo Reference Couet and Strumolo1987; Bush Reference Bush1997; Kelley & Wu Reference Kelley and Wu1997; Bush & Eames Reference Bush and Eames1998; Huisman, Ern & Roig Reference Huisman, Ern and Roig2012; Roig et al.
Reference Roig, Roudet, Risso and Billet2012; Wang et al.
Reference Wang, Klaasen, Degrève, Blanpain and Verhaeghe2014, Reference Wang, Klaasen, Degrève, Mahulkar, Heynderickx, Reyniers, Blanpain and Verhaeghe2016; Filella, Ern & Roig Reference Filella, Ern and Roig2015; Piedra, Ramos & Herrera Reference Piedra, Ramos and Herrera2015).
$Re(h/d)^{2}$
is close to or larger than 1, the inertia becomes important, as has been observed for bubbles in inclined or vertical Hele-Shaw cells (Collins Reference Collins1965a
,Reference Collins
b
; Grace & Harrison Reference Grace and Harrison1967; Lazarek & Littman Reference Lazarek and Littman1974; Maneri & Zuber Reference Maneri and Zuber1974; Hills Reference Hills1975; Vanden-Broeck Reference Vanden-Broeck1984, Reference Vanden-Broeck1992; Couet & Strumolo Reference Couet and Strumolo1987; Bush Reference Bush1997; Kelley & Wu Reference Kelley and Wu1997; Bush & Eames Reference Bush and Eames1998; Huisman, Ern & Roig Reference Huisman, Ern and Roig2012; Roig et al.
Reference Roig, Roudet, Risso and Billet2012; Wang et al.
Reference Wang, Klaasen, Degrève, Blanpain and Verhaeghe2014, Reference Wang, Klaasen, Degrève, Mahulkar, Heynderickx, Reyniers, Blanpain and Verhaeghe2016; Filella, Ern & Roig Reference Filella, Ern and Roig2015; Piedra, Ramos & Herrera Reference Piedra, Ramos and Herrera2015).
In this paper, we study bubble behaviour in another type of Hele-Shaw cell, i.e. thin annuli. We provide an insight, based on experimental observations, numerical simulations and theoretical analysis, into simultaneous gas–liquid flow through such systems. We focus on the regime where inertia becomes important, i.e.
![]() $Re(h/d)^{2}$
is close to or larger than unity. Laboratory experiments are conducted to measure the bubble distribution and evolution in a horizontal or slightly inclined thin annulus (§ 2). A gap-averaged, two-dimensional (2-D) formulation of the Navier–Stokes equations is then derived to represent the three-dimensional (3-D) flow dynamics (§ 3). The numerical model predictions are compared with the experimental data for different inclinations. Further numerical simulations are then performed to elucidate the roles of gap thickness and pipe diameter in bubble formation (§ 4). In addition, a theoretical analysis is presented to interpret the flow mechanisms that govern bubble dynamics in thin annuli (§ 5). Finally, a brief discussion is given and conclusions are drawn (§ 6).
$Re(h/d)^{2}$
is close to or larger than unity. Laboratory experiments are conducted to measure the bubble distribution and evolution in a horizontal or slightly inclined thin annulus (§ 2). A gap-averaged, two-dimensional (2-D) formulation of the Navier–Stokes equations is then derived to represent the three-dimensional (3-D) flow dynamics (§ 3). The numerical model predictions are compared with the experimental data for different inclinations. Further numerical simulations are then performed to elucidate the roles of gap thickness and pipe diameter in bubble formation (§ 4). In addition, a theoretical analysis is presented to interpret the flow mechanisms that govern bubble dynamics in thin annuli (§ 5). Finally, a brief discussion is given and conclusions are drawn (§ 6).
2 Experimental apparatus and procedure
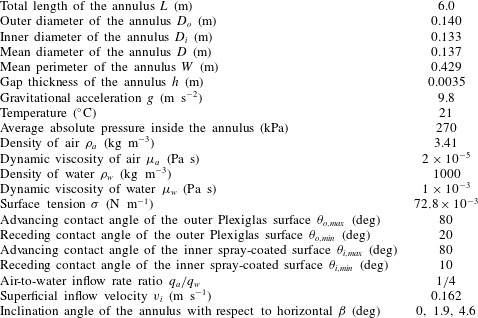
The experimental apparatus consisted of air and water supply systems, an annulus formed between two concentric pipes (comprising three connected subsections and initially filled with water), and a collection tank (figure 1). The parameters of the experimental apparatus and working fluids are as given in table 1. During the experiments, air and dyed water were continuously pumped into a mixer before entering the test section. Visual observation showed the two fluids were well segregated by the time they entered the annulus. Three high-speed cameras were mounted above the annulus subsections for visualisation and recording purposes. The outer pipe was made of Plexiglas to facilitate visualisation, while the inner stainless steel tubing was spray coated to create a white surface which maximised the colour contrast between the air and dyed water. The videos were taken at a frame rate of 17 frames per second with a resolution of
![]() $1280\times 720$
pixels, and a colour depth of 24 bits per pixel. The data were imported into MATLAB for post-processing to extract bubble size and velocity data.
$1280\times 720$
pixels, and a colour depth of 24 bits per pixel. The data were imported into MATLAB for post-processing to extract bubble size and velocity data.
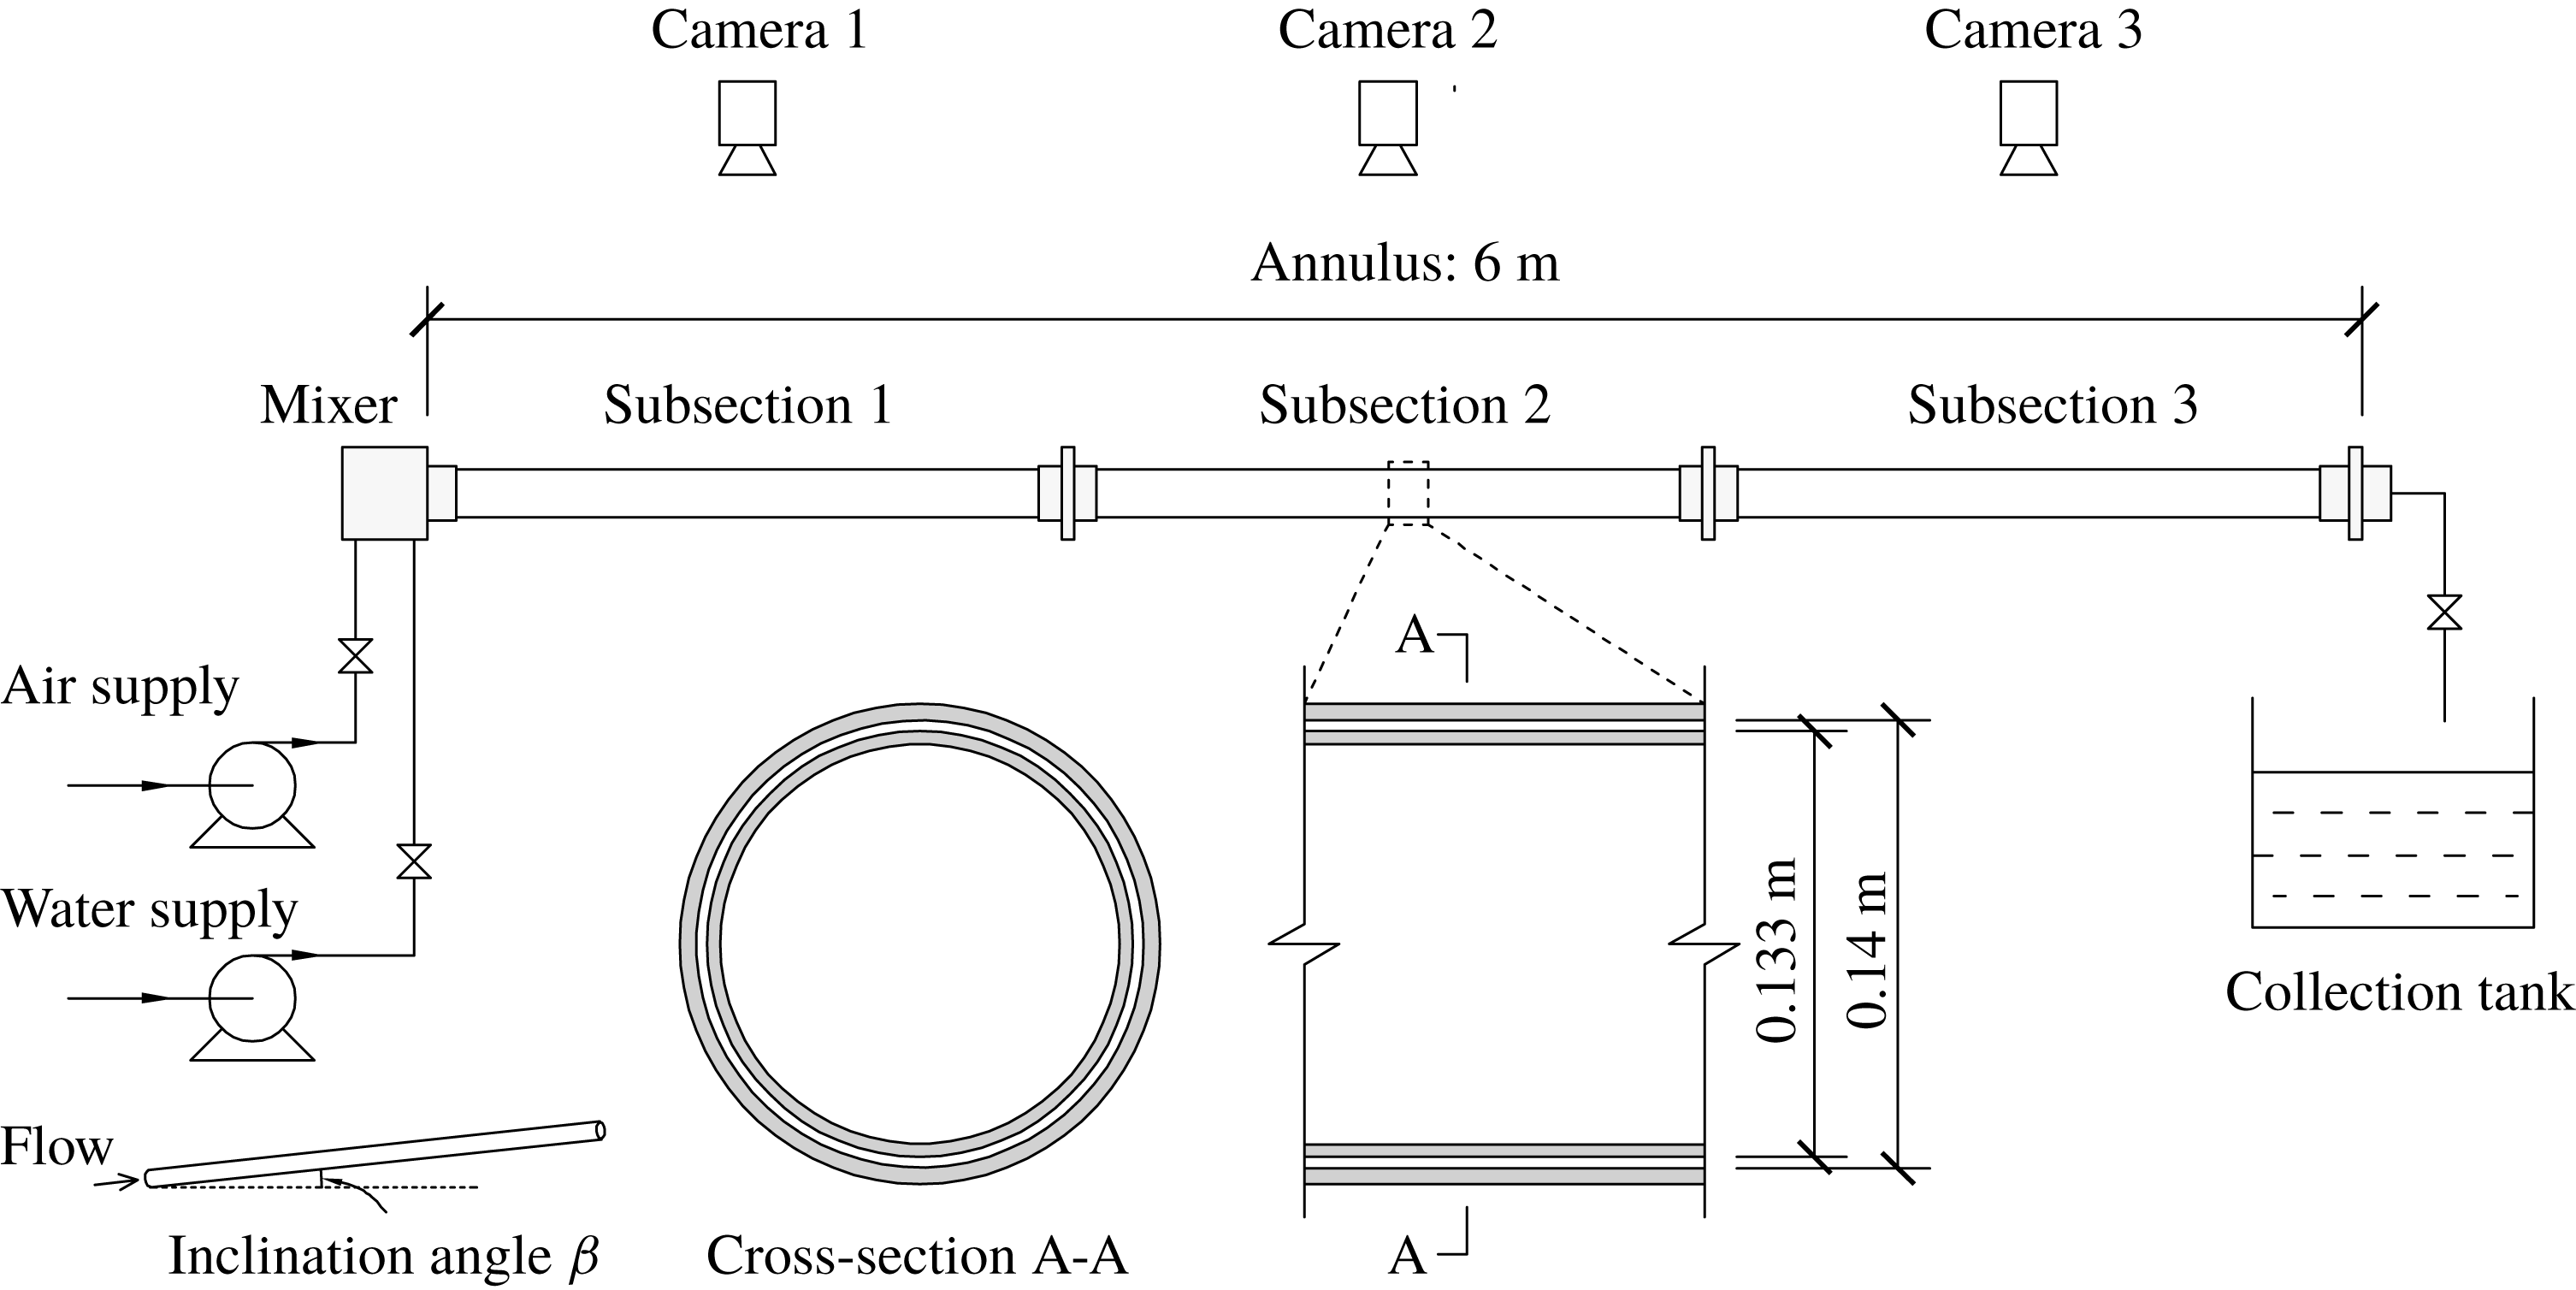
Figure 1. Schematic illustration of the experimental apparatus.
3 Mathematical formulation and numerical model
3.1 Governing equations
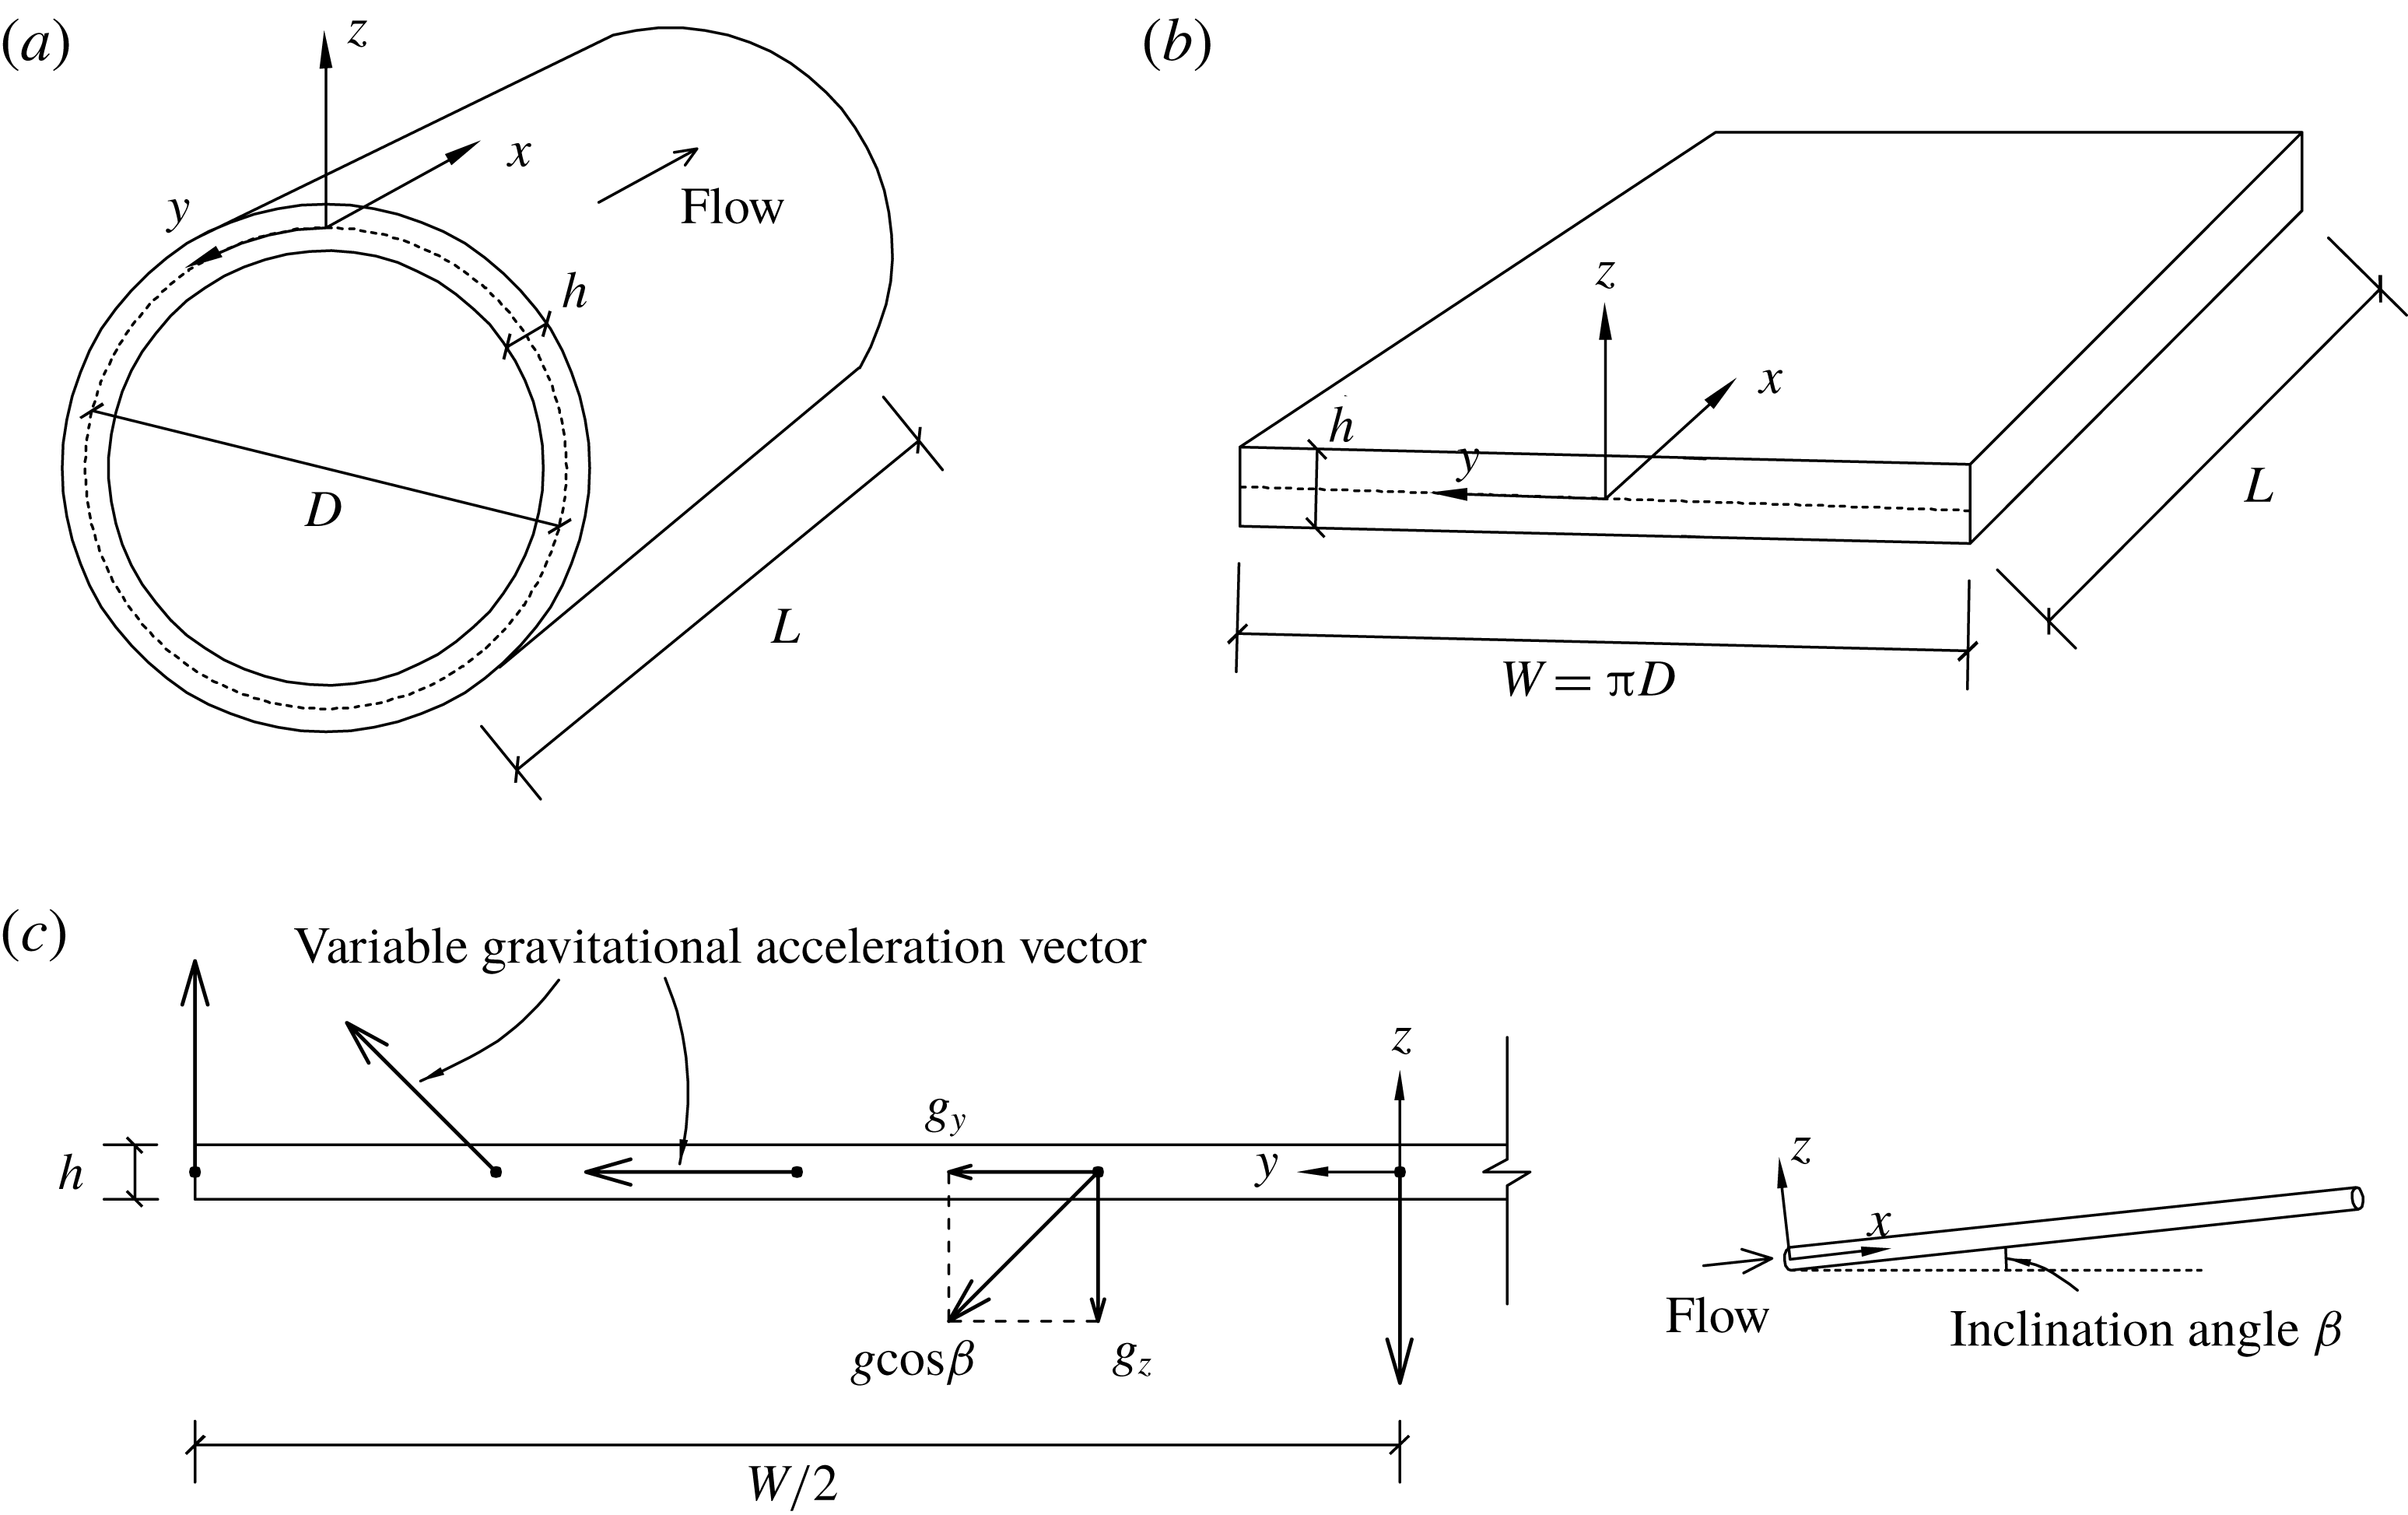
Figure 2. Schematic of (a) the thin annulus and (b) the equivalent Hele-Shaw cell. (c) An illustration showing how the direction of gravitational acceleration changes along the equivalent Hele-Shaw cell to ensure the flow replicates that seen in the actual annulus.
Table 1. Parameters of the experimental apparatus and fluids.
As shown in figure 2(a), we define a 3-D curvilinear coordinate system (
![]() $x,y,z$
) based on the mid-plane of the thin annulus (i.e. the distance of this mid-plane from both the outer and inner walls is
$x,y,z$
) based on the mid-plane of the thin annulus (i.e. the distance of this mid-plane from both the outer and inner walls is
![]() $h/2$
), where
$h/2$
), where
![]() $x$
is defined to be along the pipe length (
$x$
is defined to be along the pipe length (
![]() $0\leqslant x\leqslant L$
),
$0\leqslant x\leqslant L$
),
![]() $y$
is around the perimeter (
$y$
is around the perimeter (
![]() $-W/2\leqslant y\leqslant W/2$
with
$-W/2\leqslant y\leqslant W/2$
with
![]() $y=0$
and
$y=0$
and
![]() $y=\pm W/2$
corresponding to the top and bottom of the pipe, respectively), and
$y=\pm W/2$
corresponding to the top and bottom of the pipe, respectively), and
![]() $z$
is the direction across the gap (
$z$
is the direction across the gap (
![]() $-h/2\leqslant z\leqslant h/2$
with
$-h/2\leqslant z\leqslant h/2$
with
![]() $z=h/2$
and
$z=h/2$
and
![]() $z=-h/2$
defining the outer and inner channel walls, respectively). The system is therefore equivalent to a Hele-Shaw cell (viz. figure 2
b) under a distorted gravity field (viz. figure 2
c).
$z=-h/2$
defining the outer and inner channel walls, respectively). The system is therefore equivalent to a Hele-Shaw cell (viz. figure 2
b) under a distorted gravity field (viz. figure 2
c).
We use the approximation that the flow velocity in the
![]() $z$
direction is negligible (
$z$
direction is negligible (
![]() $u_{z}=0$
) given the very high aspect ratio (i.e.
$u_{z}=0$
) given the very high aspect ratio (i.e.
![]() $h/W\ll 1$
). By eliminating the terms involving
$h/W\ll 1$
). By eliminating the terms involving
![]() $u_{z}$
, the governing equations of the incompressible two-phase, air–water flow are obtained, including the mass and momentum conservation equations given respectively by
$u_{z}$
, the governing equations of the incompressible two-phase, air–water flow are obtained, including the mass and momentum conservation equations given respectively by
and an equation for the volume fraction of air given as
Here,
![]() $\boldsymbol{u}=[u_{x},u_{y}]$
is the velocity vector,
$\boldsymbol{u}=[u_{x},u_{y}]$
is the velocity vector,
![]() $\unicode[STIX]{x1D735}=[\unicode[STIX]{x2202}/\unicode[STIX]{x2202}x,\unicode[STIX]{x2202}/\unicode[STIX]{x2202}y]$
is the 2-D gradient,
$\unicode[STIX]{x1D735}=[\unicode[STIX]{x2202}/\unicode[STIX]{x2202}x,\unicode[STIX]{x2202}/\unicode[STIX]{x2202}y]$
is the 2-D gradient,
![]() $t$
is the time,
$t$
is the time,
![]() $\unicode[STIX]{x1D6FC}$
is the volume fraction of air, the bulk density is
$\unicode[STIX]{x1D6FC}$
is the volume fraction of air, the bulk density is
![]() $\unicode[STIX]{x1D70C}=\unicode[STIX]{x1D6FC}\unicode[STIX]{x1D70C}_{a}+(1-\unicode[STIX]{x1D6FC})\unicode[STIX]{x1D70C}_{w}$
,
$\unicode[STIX]{x1D70C}=\unicode[STIX]{x1D6FC}\unicode[STIX]{x1D70C}_{a}+(1-\unicode[STIX]{x1D6FC})\unicode[STIX]{x1D70C}_{w}$
,
![]() $p$
is the pressure, the bulk dynamic viscosity is
$p$
is the pressure, the bulk dynamic viscosity is
![]() $\unicode[STIX]{x1D707}=\unicode[STIX]{x1D6FC}\unicode[STIX]{x1D707}_{a}+(1-\unicode[STIX]{x1D6FC})\unicode[STIX]{x1D707}_{w}$
, the gravitational acceleration vector is
$\unicode[STIX]{x1D707}=\unicode[STIX]{x1D6FC}\unicode[STIX]{x1D707}_{a}+(1-\unicode[STIX]{x1D6FC})\unicode[STIX]{x1D707}_{w}$
, the gravitational acceleration vector is
![]() $\boldsymbol{g}=[g\sin \unicode[STIX]{x1D6FD},g\cos \unicode[STIX]{x1D6FD}\sin (2y/d)]$
,
$\boldsymbol{g}=[g\sin \unicode[STIX]{x1D6FD},g\cos \unicode[STIX]{x1D6FD}\sin (2y/d)]$
,
![]() $\unicode[STIX]{x1D70E}$
is the surface tension,
$\unicode[STIX]{x1D70E}$
is the surface tension,
![]() $\unicode[STIX]{x1D705}$
is the interface curvature,
$\unicode[STIX]{x1D705}$
is the interface curvature,
![]() $\unicode[STIX]{x1D6FF}$
is the Dirac delta function and
$\unicode[STIX]{x1D6FF}$
is the Dirac delta function and
![]() $\boldsymbol{n}$
is the interface outward-pointing unit normal. Surface tension force is treated as a continuous surface force (Brackbill, Kothe & Zemach Reference Brackbill, Kothe and Zemach1992). Note (3.1)–(3.3) are written in a form following Bush (Reference Bush1997) that eases the derivation of gap-averaged, 2-D equations in the following § 3.2.
$\boldsymbol{n}$
is the interface outward-pointing unit normal. Surface tension force is treated as a continuous surface force (Brackbill, Kothe & Zemach Reference Brackbill, Kothe and Zemach1992). Note (3.1)–(3.3) are written in a form following Bush (Reference Bush1997) that eases the derivation of gap-averaged, 2-D equations in the following § 3.2.
3.2 Gap-averaging process
We assume the velocity profile in the annulus to be parabolic in the
![]() $z$
-direction (Gondret & Rabaud Reference Gondret and Rabaud1997):
$z$
-direction (Gondret & Rabaud Reference Gondret and Rabaud1997):
where
![]() $\bar{\boldsymbol{u}}$
is the gap-averaged velocity. This is consistent with our calculation
$\bar{\boldsymbol{u}}$
is the gap-averaged velocity. This is consistent with our calculation
![]() $\unicode[STIX]{x1D70C}_{w}v_{i}(2h)/\unicode[STIX]{x1D707}_{w}=1134$
, which reveals the flow to be laminar (Beavers, Sparrow & Magnuson Reference Beavers, Sparrow and Magnuson1970).
$\unicode[STIX]{x1D70C}_{w}v_{i}(2h)/\unicode[STIX]{x1D707}_{w}=1134$
, which reveals the flow to be laminar (Beavers, Sparrow & Magnuson Reference Beavers, Sparrow and Magnuson1970).
We derive a coupled set of gap-averaged equations by integrating equations (3.1)–(3.3) along the
![]() $z$
direction (Roig et al.
Reference Roig, Roudet, Risso and Billet2012):
$z$
direction (Roig et al.
Reference Roig, Roudet, Risso and Billet2012):
We acknowledge the fact that (3.5)–(3.7) may not represent fully all relevant dynamics, e.g. 3-D effects local to the air–water interface (Oliveira & Meiburg Reference Oliveira and Meiburg2011). It is, nonetheless, of interest to determine the extent to which our approximate model can capture as many of the phenomena observed experimentally as possible.
3.3 Curvature and contact angle
The shape of the air–water interface is affected by the wettability of the channel walls. To incorporate this effect, the curvature in (3.6) may be replaced by (Thompson, Juel & Hazel Reference Thompson, Juel and Hazel2014)
where
![]() $\unicode[STIX]{x1D705}_{l}$
is the lateral curvature (on the
$\unicode[STIX]{x1D705}_{l}$
is the lateral curvature (on the
![]() $x$
–
$x$
–
![]() $y$
plane) which is estimated using the diffuse-interface approach based on the volume fraction field (Xie et al.
Reference Xie, Pavlidis, Salinas, Percival, Pain and Matar2016),
$y$
plane) which is estimated using the diffuse-interface approach based on the volume fraction field (Xie et al.
Reference Xie, Pavlidis, Salinas, Percival, Pain and Matar2016),
![]() $\unicode[STIX]{x1D705}_{t}$
is the transverse curvature (across the gap) which is estimated from the meniscus profile (figure 3
a),
$\unicode[STIX]{x1D705}_{t}$
is the transverse curvature (across the gap) which is estimated from the meniscus profile (figure 3
a),
![]() $\unicode[STIX]{x1D703}_{o}$
is the local contact angle at the outer wall and
$\unicode[STIX]{x1D703}_{o}$
is the local contact angle at the outer wall and
![]() $\unicode[STIX]{x1D703}_{i}$
is that at the inner wall. The local contact angle along the contact line can vary significantly from the advancing value (at the bubble tail) to the receding value (at the bubble front). The experimental measurements by Antonini et al. (Reference Antonini, Carmona, Pierce, Marengo and Amirfazli2009) showed that the angle can be interpolated using a third-order polynomial function:
$\unicode[STIX]{x1D703}_{i}$
is that at the inner wall. The local contact angle along the contact line can vary significantly from the advancing value (at the bubble tail) to the receding value (at the bubble front). The experimental measurements by Antonini et al. (Reference Antonini, Carmona, Pierce, Marengo and Amirfazli2009) showed that the angle can be interpolated using a third-order polynomial function:
where
![]() $\unicode[STIX]{x1D703}$
corresponds to the local contact angle at either the outer or inner wall (i.e.
$\unicode[STIX]{x1D703}$
corresponds to the local contact angle at either the outer or inner wall (i.e.
![]() $\unicode[STIX]{x1D703}_{o}$
or
$\unicode[STIX]{x1D703}_{o}$
or
![]() $\unicode[STIX]{x1D703}_{i}$
, respectively),
$\unicode[STIX]{x1D703}_{i}$
, respectively),
![]() $\unicode[STIX]{x1D703}_{max}$
and
$\unicode[STIX]{x1D703}_{max}$
and
![]() $\unicode[STIX]{x1D703}_{min}$
denote the advancing and receding contact angles of the corresponding surface, respectively,
$\unicode[STIX]{x1D703}_{min}$
denote the advancing and receding contact angles of the corresponding surface, respectively,
![]() $\unicode[STIX]{x1D719}$
is the angle between the local velocity vector
$\unicode[STIX]{x1D719}$
is the angle between the local velocity vector
![]() $\bar{\boldsymbol{u}}$
and the interface normal
$\bar{\boldsymbol{u}}$
and the interface normal
![]() $\boldsymbol{n}$
(figure 3
b). Figure 4 shows the variation of the local contact angle
$\boldsymbol{n}$
(figure 3
b). Figure 4 shows the variation of the local contact angle
![]() $\unicode[STIX]{x1D703}$
at the outer and inner walls with respect to
$\unicode[STIX]{x1D703}$
at the outer and inner walls with respect to
![]() $\unicode[STIX]{x1D719}$
. Contact angle hysteresis is promoted by roughness of the channel wall surface (Dussan Reference Dussan1979); we also discuss in § 6 the potential effect of roughness on the presence/absence of thin water films on the channel walls.
$\unicode[STIX]{x1D719}$
. Contact angle hysteresis is promoted by roughness of the channel wall surface (Dussan Reference Dussan1979); we also discuss in § 6 the potential effect of roughness on the presence/absence of thin water films on the channel walls.

Figure 3. Schematic of (a) the cross-gap meniscus profile governed by the local contact angles,
![]() $\unicode[STIX]{x1D703}_{o}$
and
$\unicode[STIX]{x1D703}_{o}$
and
![]() $\unicode[STIX]{x1D703}_{i}$
, at the outer and inner walls, respectively, and (b) the moving contact line in the
$\unicode[STIX]{x1D703}_{i}$
, at the outer and inner walls, respectively, and (b) the moving contact line in the
![]() $x$
–
$x$
–
![]() $y$
plane with the local advancing/receding state determined by the intersection angle
$y$
plane with the local advancing/receding state determined by the intersection angle
![]() $\unicode[STIX]{x1D719}$
between the velocity vector
$\unicode[STIX]{x1D719}$
between the velocity vector
![]() $\bar{\boldsymbol{u}}$
and the interface normal
$\bar{\boldsymbol{u}}$
and the interface normal
![]() $\boldsymbol{n}$
.
$\boldsymbol{n}$
.

Figure 4. Interpolation of contact angles around a contact line at the outer or inner wall of the annulus using a third-order polynomial fitting (Antonini et al.
Reference Antonini, Carmona, Pierce, Marengo and Amirfazli2009);
![]() $\unicode[STIX]{x1D703}$
denotes the local contact angle and
$\unicode[STIX]{x1D703}$
denotes the local contact angle and
![]() $\unicode[STIX]{x1D719}$
denotes the intersection angle between the local velocity vector and the interface normal as shown in figure 3.
$\unicode[STIX]{x1D719}$
denotes the intersection angle between the local velocity vector and the interface normal as shown in figure 3.
3.4 Model set-up and numerical methods
A numerical experiment was designed as shown in figure 5. The length and width of the 2-D domain were the pipe length
![]() $L$
and perimeter
$L$
and perimeter
![]() $W$
, respectively. This domain was originally filled with water that had an initial velocity
$W$
, respectively. This domain was originally filled with water that had an initial velocity
![]() $v_{i}$
along the
$v_{i}$
along the
![]() $x$
direction. The inlet condition was defined by the inflow velocity
$x$
direction. The inlet condition was defined by the inflow velocity
![]() $v_{i}$
uniformly imposed at the left boundary, such that the air flowed into the domain through the middle part (
$v_{i}$
uniformly imposed at the left boundary, such that the air flowed into the domain through the middle part (
![]() $W/5$
wide), corresponding to the inflow rate condition of
$W/5$
wide), corresponding to the inflow rate condition of
![]() $q_{a}/(q_{a}+q_{w})=1/5$
(table 1), while the water was injected from the remaining portion of the left boundary. This is consistent with the experimental observation that air and water were well segregated in the mixer before entering the annulus. A free-slip condition was used for the two longitudinal sides of the domain, considering that the air phase is away from the pipe bottom and the flow across the pipe bottom is negligible. A hydrostatic pressure condition was imposed along the outlet to account for the gravity-induced pressure gradient across the channel.
$q_{a}/(q_{a}+q_{w})=1/5$
(table 1), while the water was injected from the remaining portion of the left boundary. This is consistent with the experimental observation that air and water were well segregated in the mixer before entering the annulus. A free-slip condition was used for the two longitudinal sides of the domain, considering that the air phase is away from the pipe bottom and the flow across the pipe bottom is negligible. A hydrostatic pressure condition was imposed along the outlet to account for the gravity-induced pressure gradient across the channel.
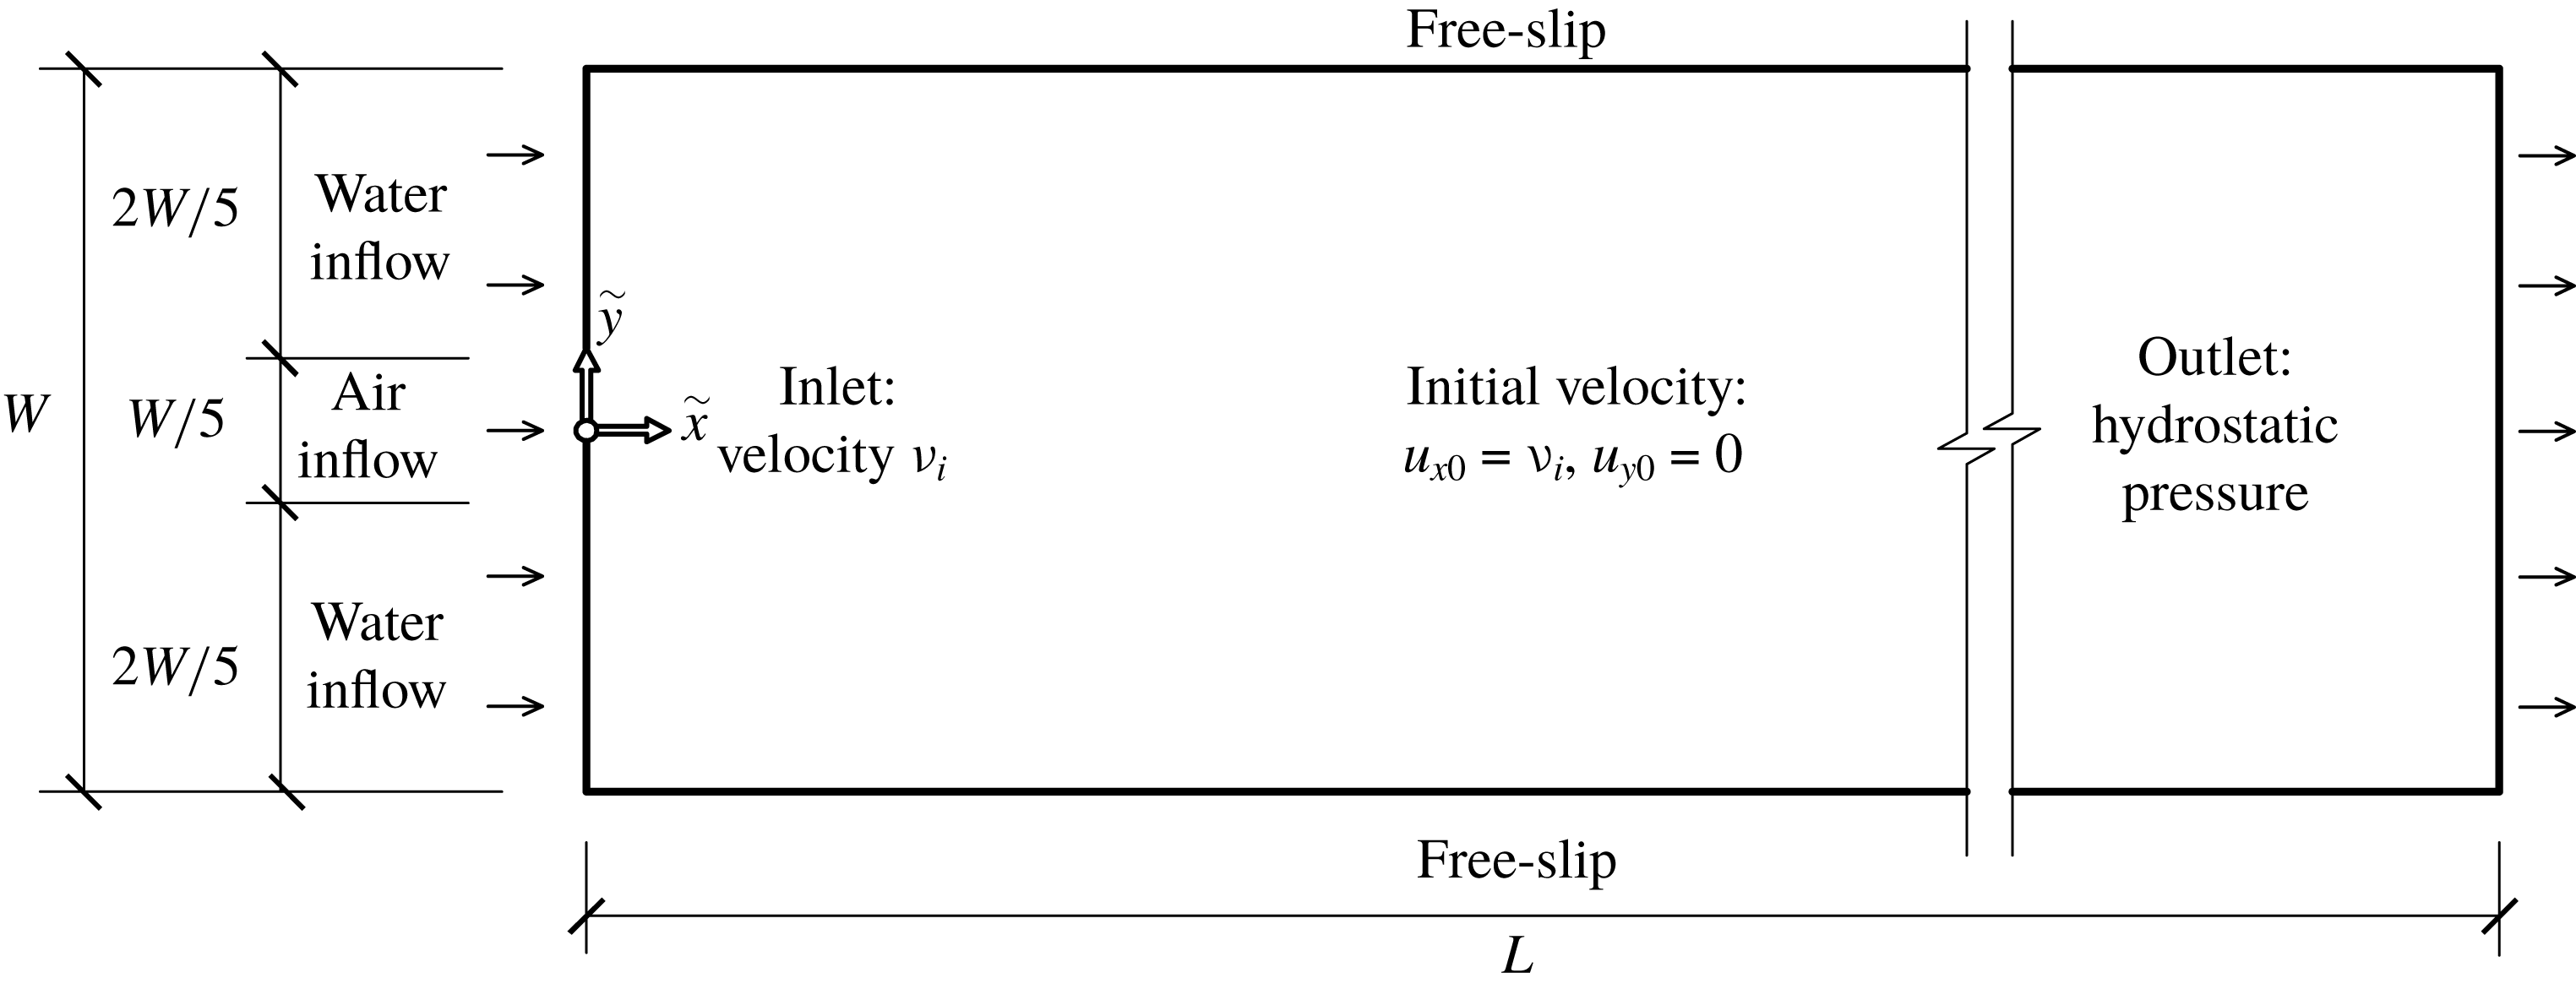
Figure 5. The 2-D model set-up for numerical simulation.
The numerical model was solved based on a mixed control-volume finite-element method, which has been validated against a series of benchmark cases of single rising bubbles, coalescence of two bubbles and droplet impacts (Xie et al.
Reference Xie, Pavlidis, Percival, Gomes, Pain and Matar2014, Reference Xie, Pavlidis, Salinas, Percival, Pain and Matar2016, Reference Xie, Hewitt, Pavlidis, Salinas, Pain and Matar2017). The computational domain was discretised into an unstructured grid of triangular
![]() $\text{P}_{1}\text{DG}\text{-}\text{P}_{2}$
elements (linear discontinuous velocity between elements and quadratic continuous pressure between elements) (Cotter et al.
Reference Cotter, Ham, Pain and Reich2009). A finite volume discretisation of the mass conservation equation and a linear discontinuous Galerkin discretisation of the momentum equation were used with an adaptive implicit/explicit time stepping scheme (Xie et al.
Reference Xie, Pavlidis, Salinas, Percival, Pain and Matar2016). Within each time step, the equations were iterated upon using a pressure projection method until all equations are simultaneously balanced (Pavlidis et al.
Reference Pavlidis, Xie, Percival, Gomes, Pain and Matar2014; Xie et al.
Reference Xie, Pavlidis, Percival, Gomes, Pain and Matar2014). Interface dynamics were captured through a compressive advection-based volume-of-fluid approach, which used a novel and mathematically rigorous nonlinear Petrov–Galerkin method for maintaining sharp interfaces (Pavlidis et al.
Reference Pavlidis, Gomes, Xie, Percival, Pain and Matar2016). Surface tension was modelled using a diffused-interface formulation that can accurately estimate the lateral curvature based on the volume fraction field (Xie et al.
Reference Xie, Pavlidis, Salinas, Percival, Pain and Matar2016). Anisotropic mesh adaptation (Pain et al.
Reference Pain, Umpleby, de Oliveira and Goddard2001) was used to place a finer mesh around the interface during its evolution as required to capture the dynamics (Xie et al.
Reference Xie, Pavlidis, Percival, Gomes, Pain and Matar2014, Reference Xie, Pavlidis, Salinas, Percival, Pain and Matar2016). The criteria for mesh refinement, based on the volume fraction field, included an interpolation error bound of 0.1, a minimum element size of
$\text{P}_{1}\text{DG}\text{-}\text{P}_{2}$
elements (linear discontinuous velocity between elements and quadratic continuous pressure between elements) (Cotter et al.
Reference Cotter, Ham, Pain and Reich2009). A finite volume discretisation of the mass conservation equation and a linear discontinuous Galerkin discretisation of the momentum equation were used with an adaptive implicit/explicit time stepping scheme (Xie et al.
Reference Xie, Pavlidis, Salinas, Percival, Pain and Matar2016). Within each time step, the equations were iterated upon using a pressure projection method until all equations are simultaneously balanced (Pavlidis et al.
Reference Pavlidis, Xie, Percival, Gomes, Pain and Matar2014; Xie et al.
Reference Xie, Pavlidis, Percival, Gomes, Pain and Matar2014). Interface dynamics were captured through a compressive advection-based volume-of-fluid approach, which used a novel and mathematically rigorous nonlinear Petrov–Galerkin method for maintaining sharp interfaces (Pavlidis et al.
Reference Pavlidis, Gomes, Xie, Percival, Pain and Matar2016). Surface tension was modelled using a diffused-interface formulation that can accurately estimate the lateral curvature based on the volume fraction field (Xie et al.
Reference Xie, Pavlidis, Salinas, Percival, Pain and Matar2016). Anisotropic mesh adaptation (Pain et al.
Reference Pain, Umpleby, de Oliveira and Goddard2001) was used to place a finer mesh around the interface during its evolution as required to capture the dynamics (Xie et al.
Reference Xie, Pavlidis, Percival, Gomes, Pain and Matar2014, Reference Xie, Pavlidis, Salinas, Percival, Pain and Matar2016). The criteria for mesh refinement, based on the volume fraction field, included an interpolation error bound of 0.1, a minimum element size of
![]() $W/60$
and maximum element size of
$W/60$
and maximum element size of
![]() $L/6$
and
$L/6$
and
![]() $W/20$
in the
$W/20$
in the
![]() $x$
and
$x$
and
![]() $y$
directions, respectively. The 2-D simulation outputs were projected onto the original 3-D Cartesian coordinate system to facilitate visual comparison with experimental data.
$y$
directions, respectively. The 2-D simulation outputs were projected onto the original 3-D Cartesian coordinate system to facilitate visual comparison with experimental data.
4 Results
4.1 Experimental observation and numerical simulation
Figures 6–9 show the formation of air bubbles in the water flowing through the annulus at different inclinations. Despite the limitations of the gap-averaged 2-D numerical model in representing some 3-D effects such as the detailed transverse shape of the air–water interface and the cross-gap velocity/gravity component, very similar flow behaviour in the lateral directions (i.e.
![]() $x$
and
$x$
and
![]() $y$
directions) was observed in the laboratory experiments and numerical simulations.
$y$
directions) was observed in the laboratory experiments and numerical simulations.
In the horizontal case (figure 6), air was conveyed by long bubbles having a tadpole-like shape with a semi-circular cap and a highly stretched tail connected via an apparent neck. These bubbles, separated by liquid slugs, were forced to flow at the top of the annulus due to buoyancy. The tail of a bubble was initially connected to the inlet (figure 6 a) and was stretched as the bubble advanced until it finally disconnected from the inlet (figure 6 b). The bubble then contracted as a result of surface tension (figure 6 c) and continued to move with an essentially steady shape through the co-current flowing liquid towards the outlet (figure 6 d). When the bubble was separated from the inlet, another bubble began to form, resulting in the appearance of a sequence of similarly shaped/sized bubbles moving along the top of the annulus.
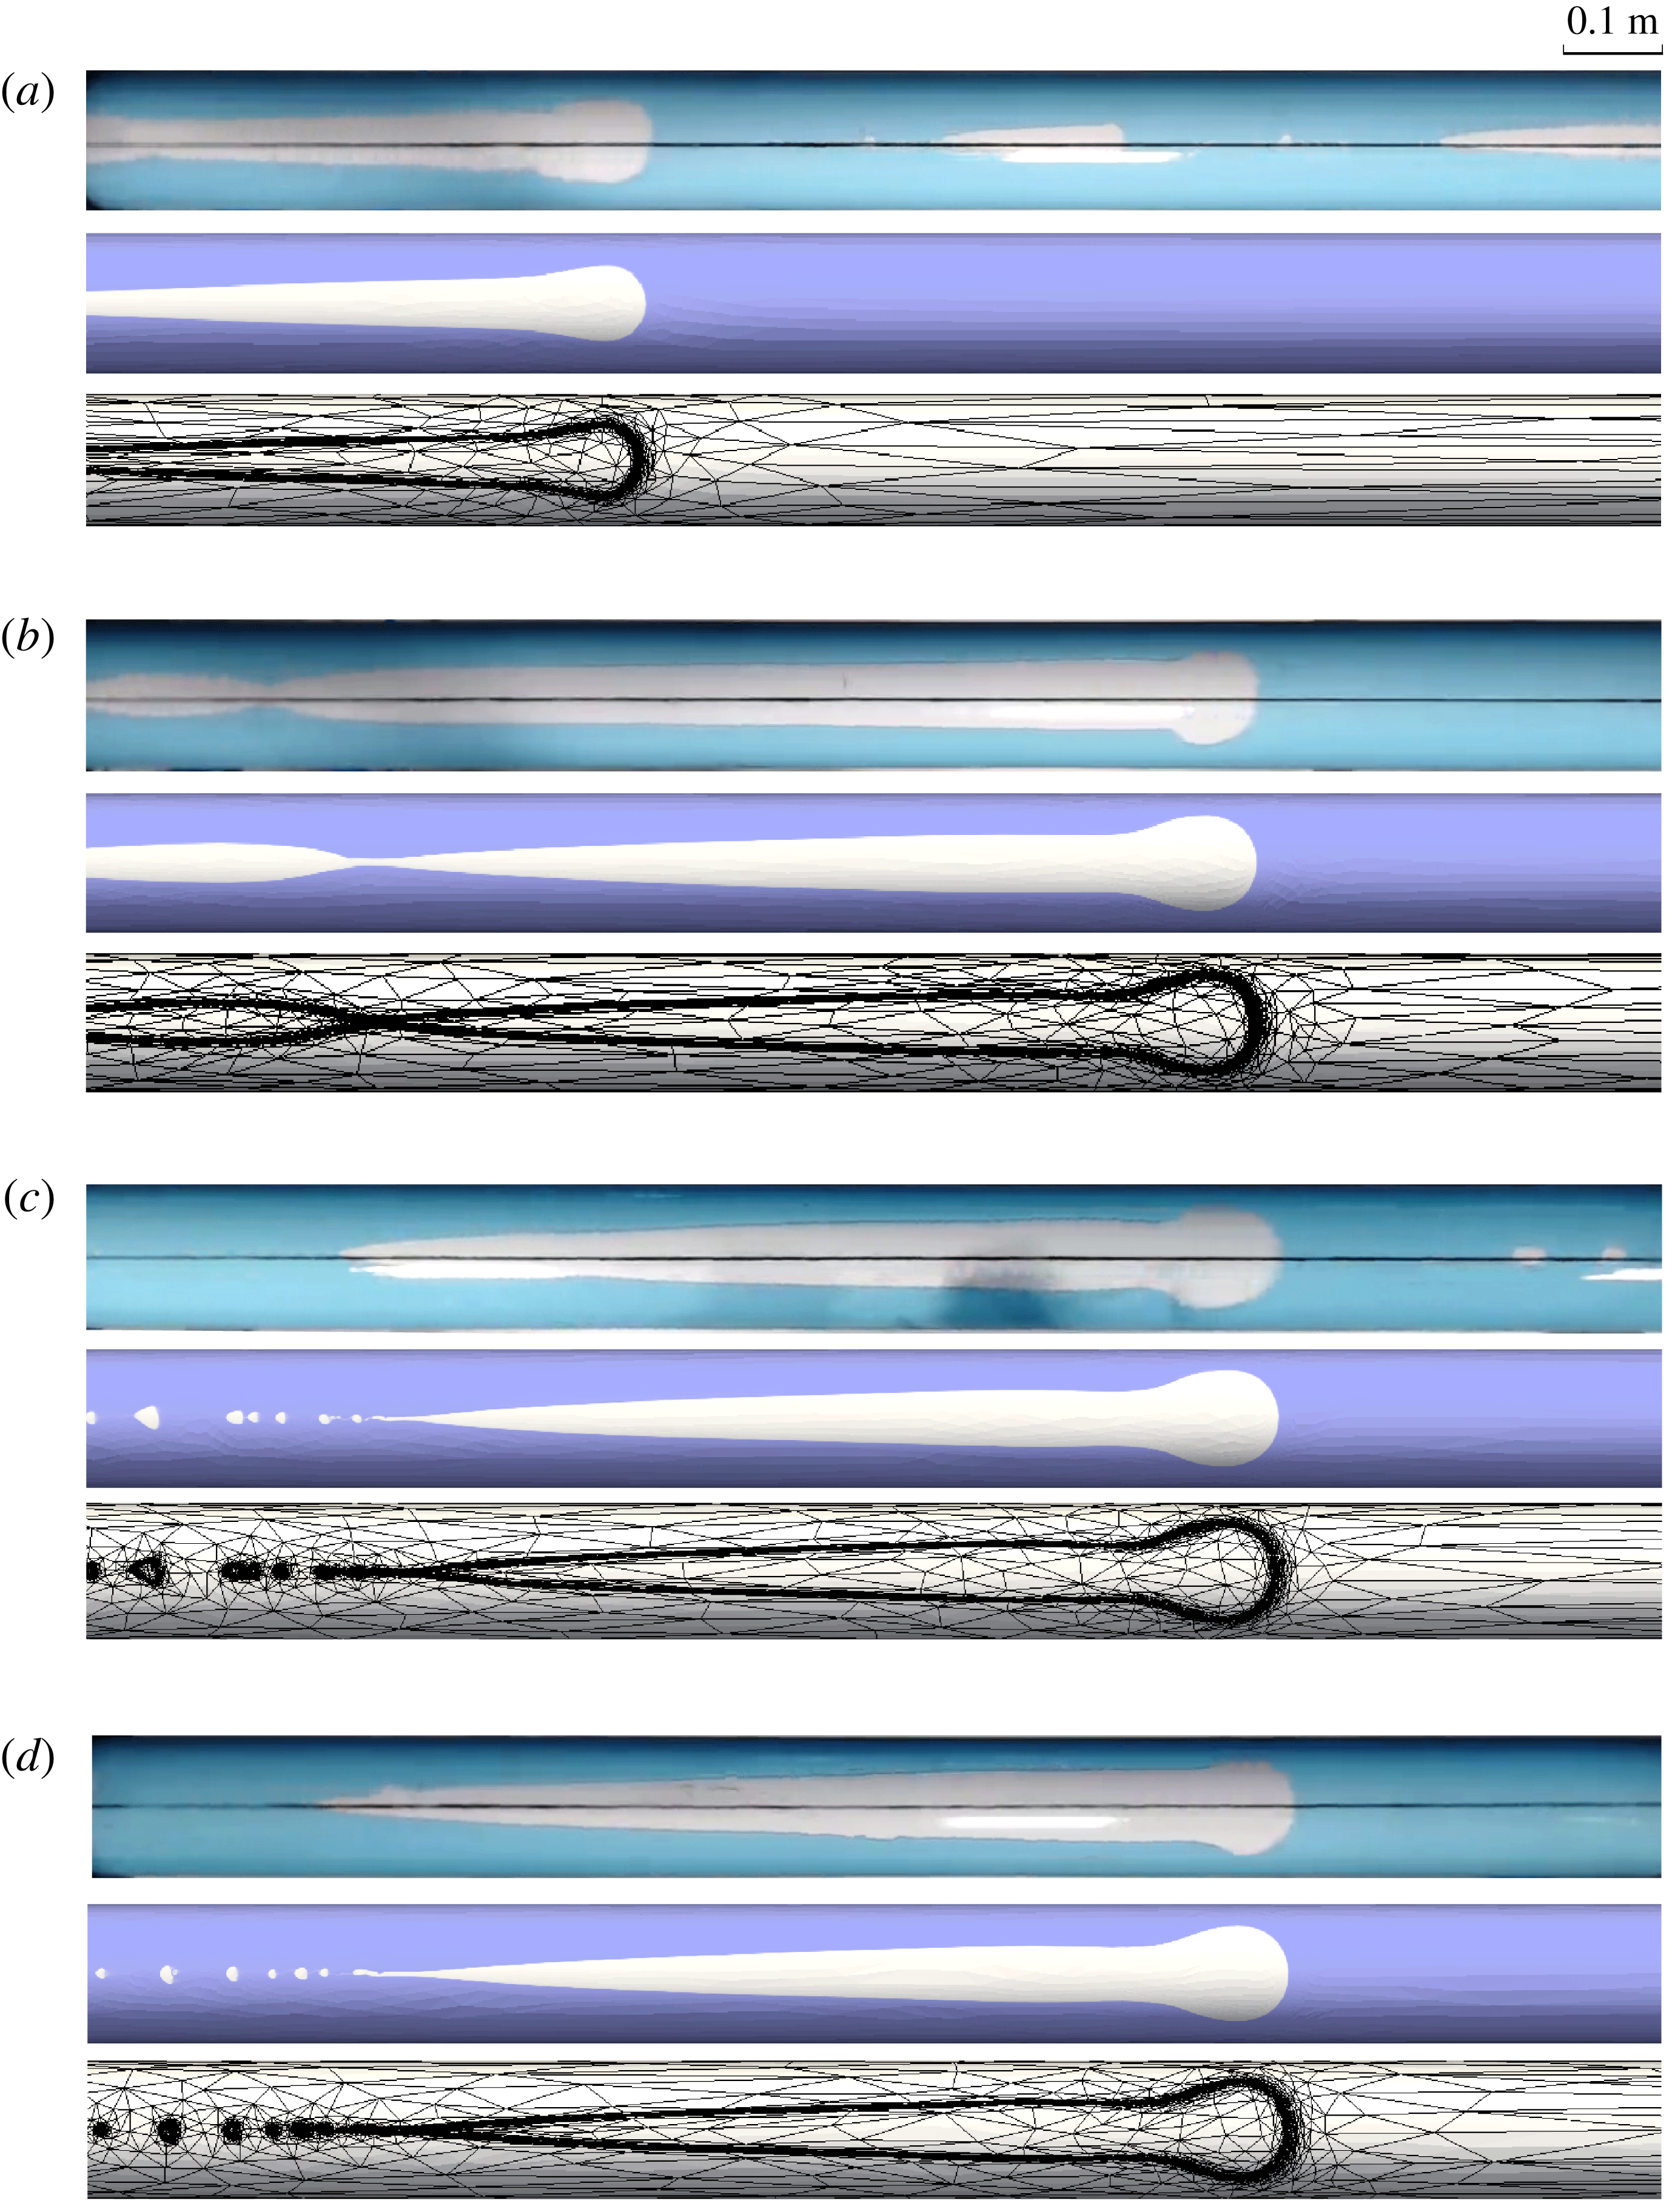
Figure 6. The formation and evolution of bubbles in the horizontal annulus (top view): (a) generation of the bubble near the inlet (in annulus subsection 1), (b) disconnection of the bubble (in annulus subsection 1), (c) stabilisation of the bubble after slight contraction (in annulus subsection 2) and (d) translation of the steady bubble to the outlet (in annulus subsection 3). Each figure panel includes the experimental observation, the simulation result and the adaptive unstructured mesh used in the simulation.
In the
![]() $1.9^{\circ }$
inclined case (figure 7), bubbles still exhibited a tadpole-like shape but with a much shorter tail, whilst the cap shape remained similar to that in the horizontal case. The bubble detached quickly from the inlet after its formation (figure 7
a). Due to the constant inflow of air, another bubble formed, disconnected and migrated following the leading one. In this way, a stream of distinct bubbles developed as in the horizontal case. However, if the spacing between two bubbles was sufficiently small, the trailing bubble might catch up (figure 7
b) and merge with its upstream neighbour (figure 7
c). The larger bubble formed might further coalesce with another bubble upstream or downstream. Finally, the bubbles that formed relatively stable shapes were transported to the outlet by the flowing water (figure 7
d).
$1.9^{\circ }$
inclined case (figure 7), bubbles still exhibited a tadpole-like shape but with a much shorter tail, whilst the cap shape remained similar to that in the horizontal case. The bubble detached quickly from the inlet after its formation (figure 7
a). Due to the constant inflow of air, another bubble formed, disconnected and migrated following the leading one. In this way, a stream of distinct bubbles developed as in the horizontal case. However, if the spacing between two bubbles was sufficiently small, the trailing bubble might catch up (figure 7
b) and merge with its upstream neighbour (figure 7
c). The larger bubble formed might further coalesce with another bubble upstream or downstream. Finally, the bubbles that formed relatively stable shapes were transported to the outlet by the flowing water (figure 7
d).
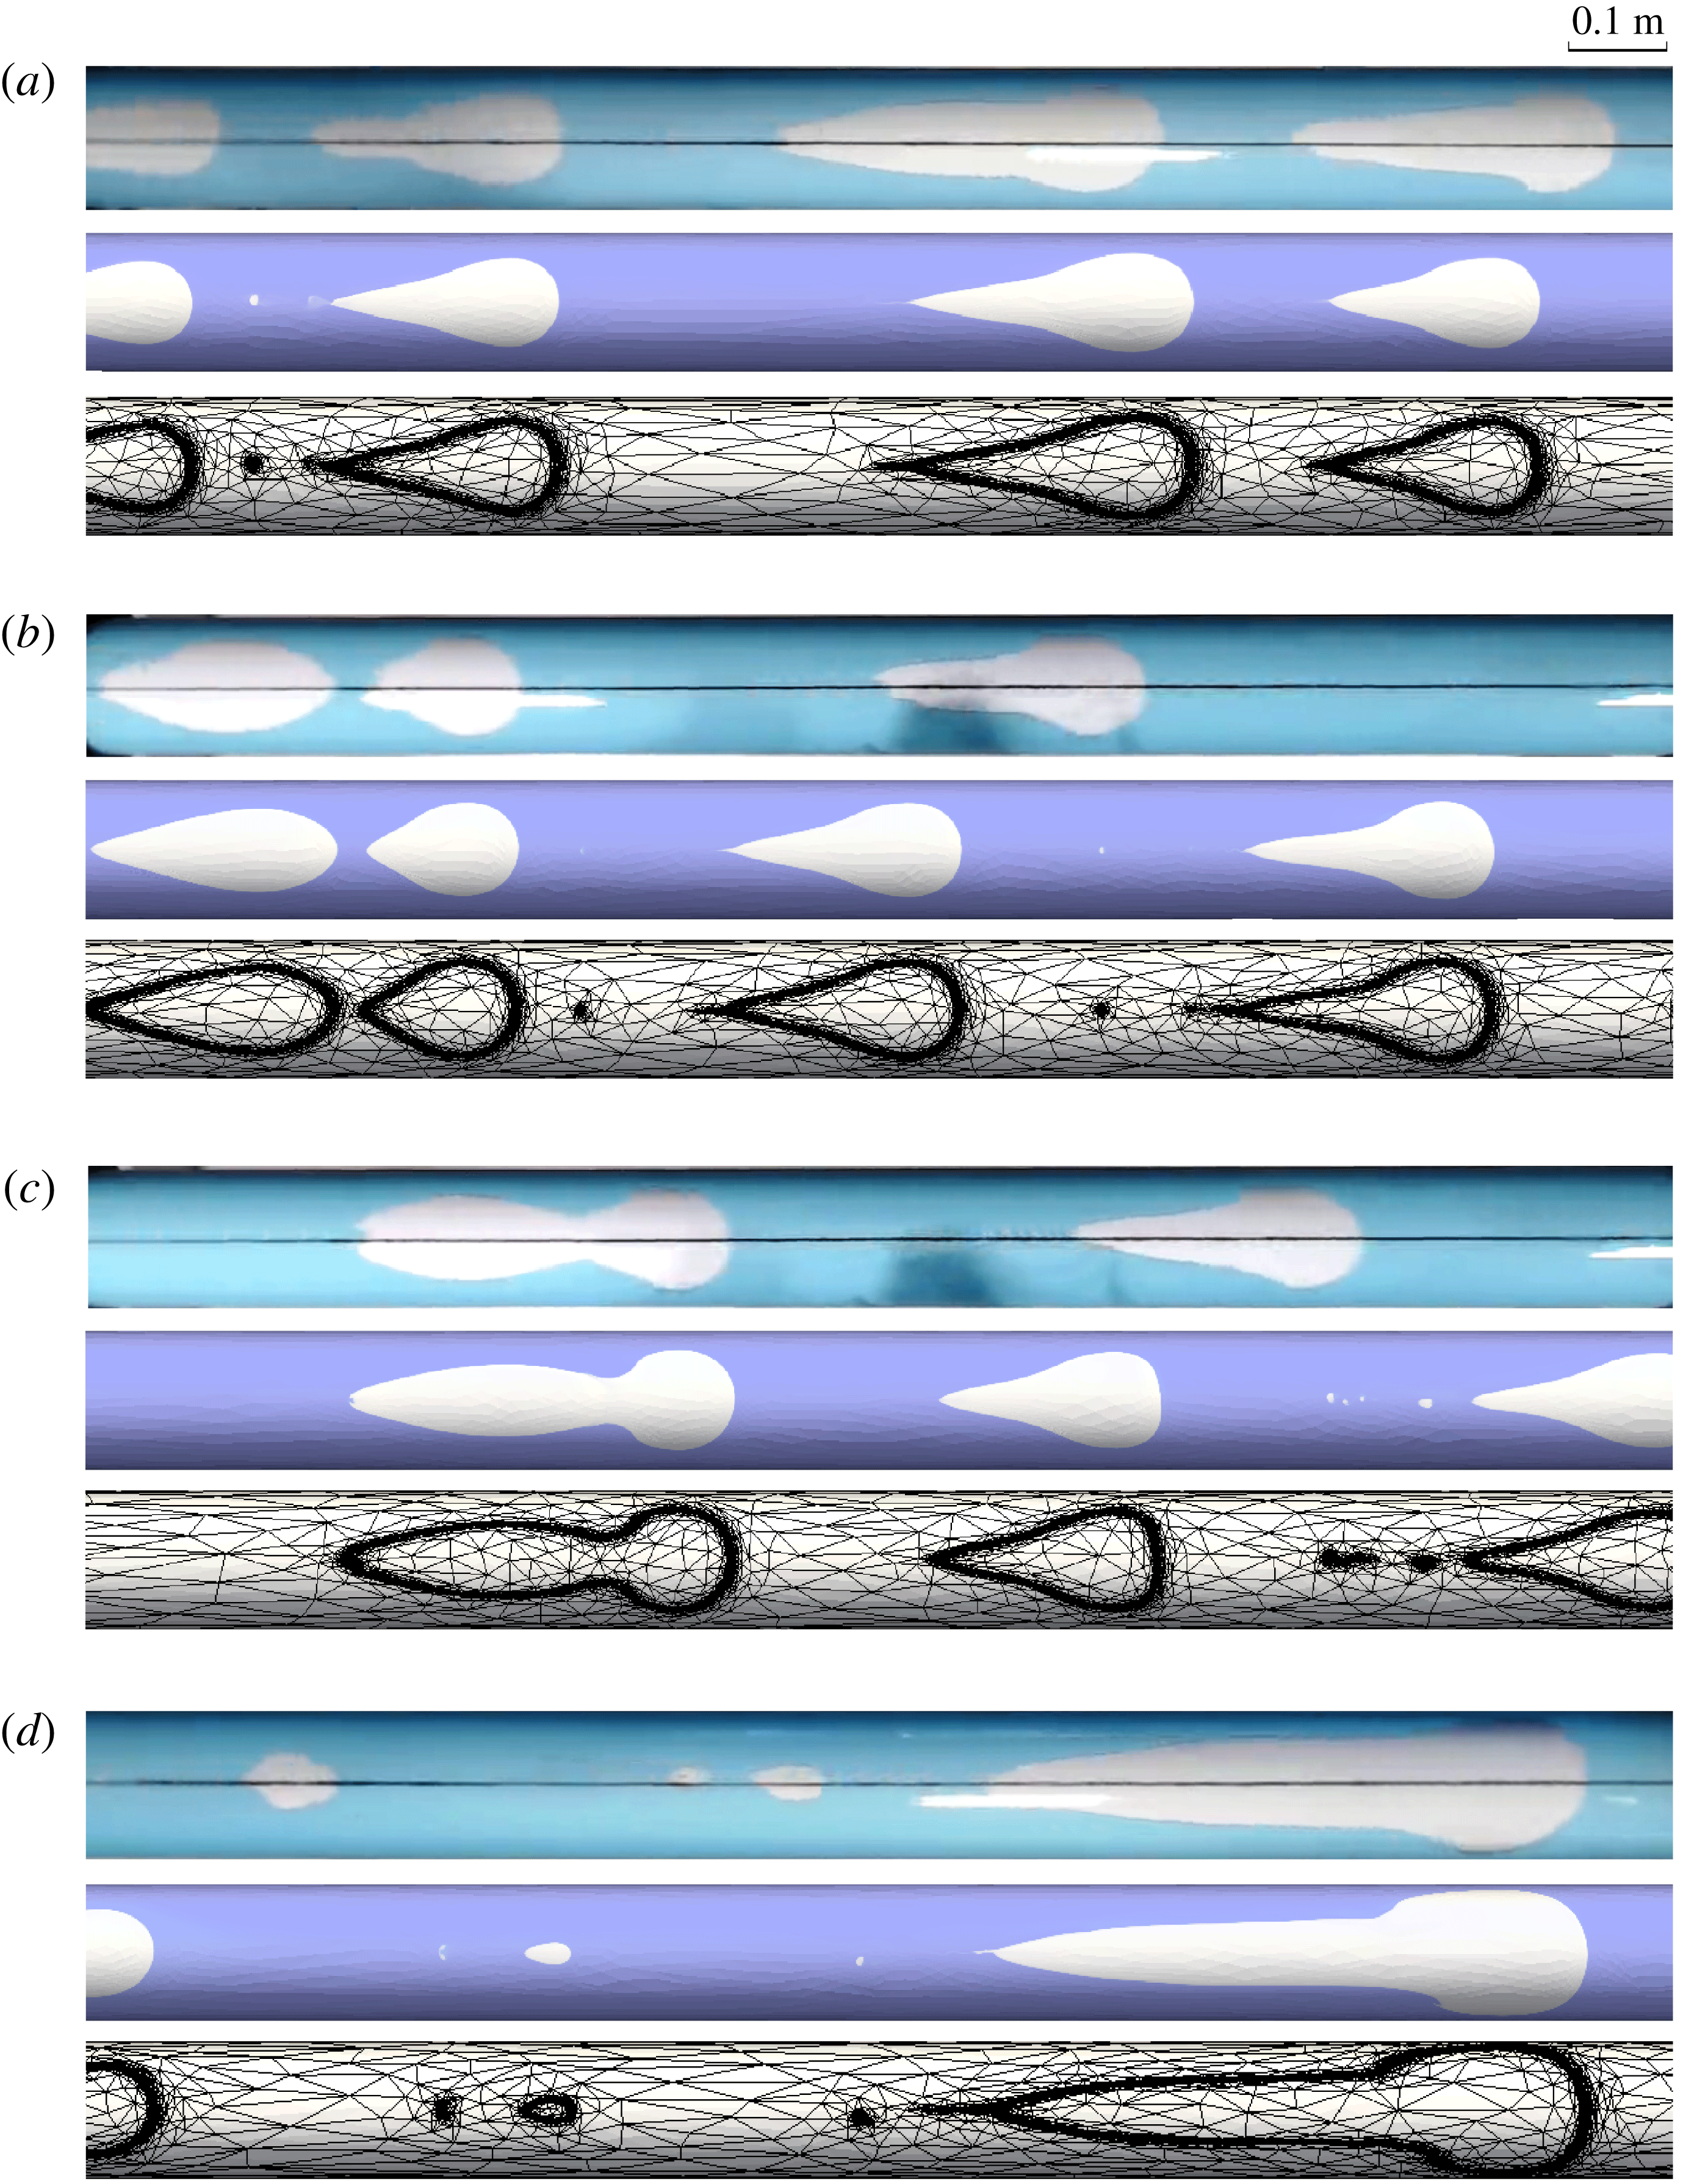
Figure 7. The formation and evolution of bubbles in the
![]() $1.9^{\circ }$
inclined annulus (top view): (a) generation of bubbles near the inlet (in annulus subsection 1), (b) interaction of bubbles, with the trailing bubble catching up with the leading bubble (in annulus subsection 2), (c) coalescence of the trailing and leading bubbles (in annulus subsection 2) and (d) translation of steady bubbles to the outlet (in annulus subsection 3). Each figure panel includes the experimental observation, the simulation result and the adaptive unstructured mesh used in the simulation.
$1.9^{\circ }$
inclined annulus (top view): (a) generation of bubbles near the inlet (in annulus subsection 1), (b) interaction of bubbles, with the trailing bubble catching up with the leading bubble (in annulus subsection 2), (c) coalescence of the trailing and leading bubbles (in annulus subsection 2) and (d) translation of steady bubbles to the outlet (in annulus subsection 3). Each figure panel includes the experimental observation, the simulation result and the adaptive unstructured mesh used in the simulation.
There appears to be three stages in the coalescence process. (i) Interacting stage (0.0–0.4 s in figure 8). The trailing bubble with a larger velocity caught up with the leading bubble. As the two bubbles became closer, the trailing bubble experienced a marked change in shape, with its cap becoming more pointed with an increased local curvature at the front. The geometry of the leading bubble only changed slightly with the tail becoming shorter and flatter. The changing shape of the two bubbles was caused by the increased pressure gradient between the two bubble interfaces as they got closer together, during which time the liquid between the two bubbles was gradually pushed out. (ii) Merging stage (0.5–0.6 s in figure 8). The cap of the trailing bubble invaded the rear of the leading bubble. The liquid film between the two bubbles was ruptured and drained as the two bubbles united. The merged bubble exhibited a complex, tortuous shape with the cap and tail connected by a narrow neck and a wider body. (iii) Stabilising stage (0.7–1.0 s in figure 8). The merged larger bubble underwent deformation and adjusted itself from a complex, unsteady shape to the stable tadpole-like form.
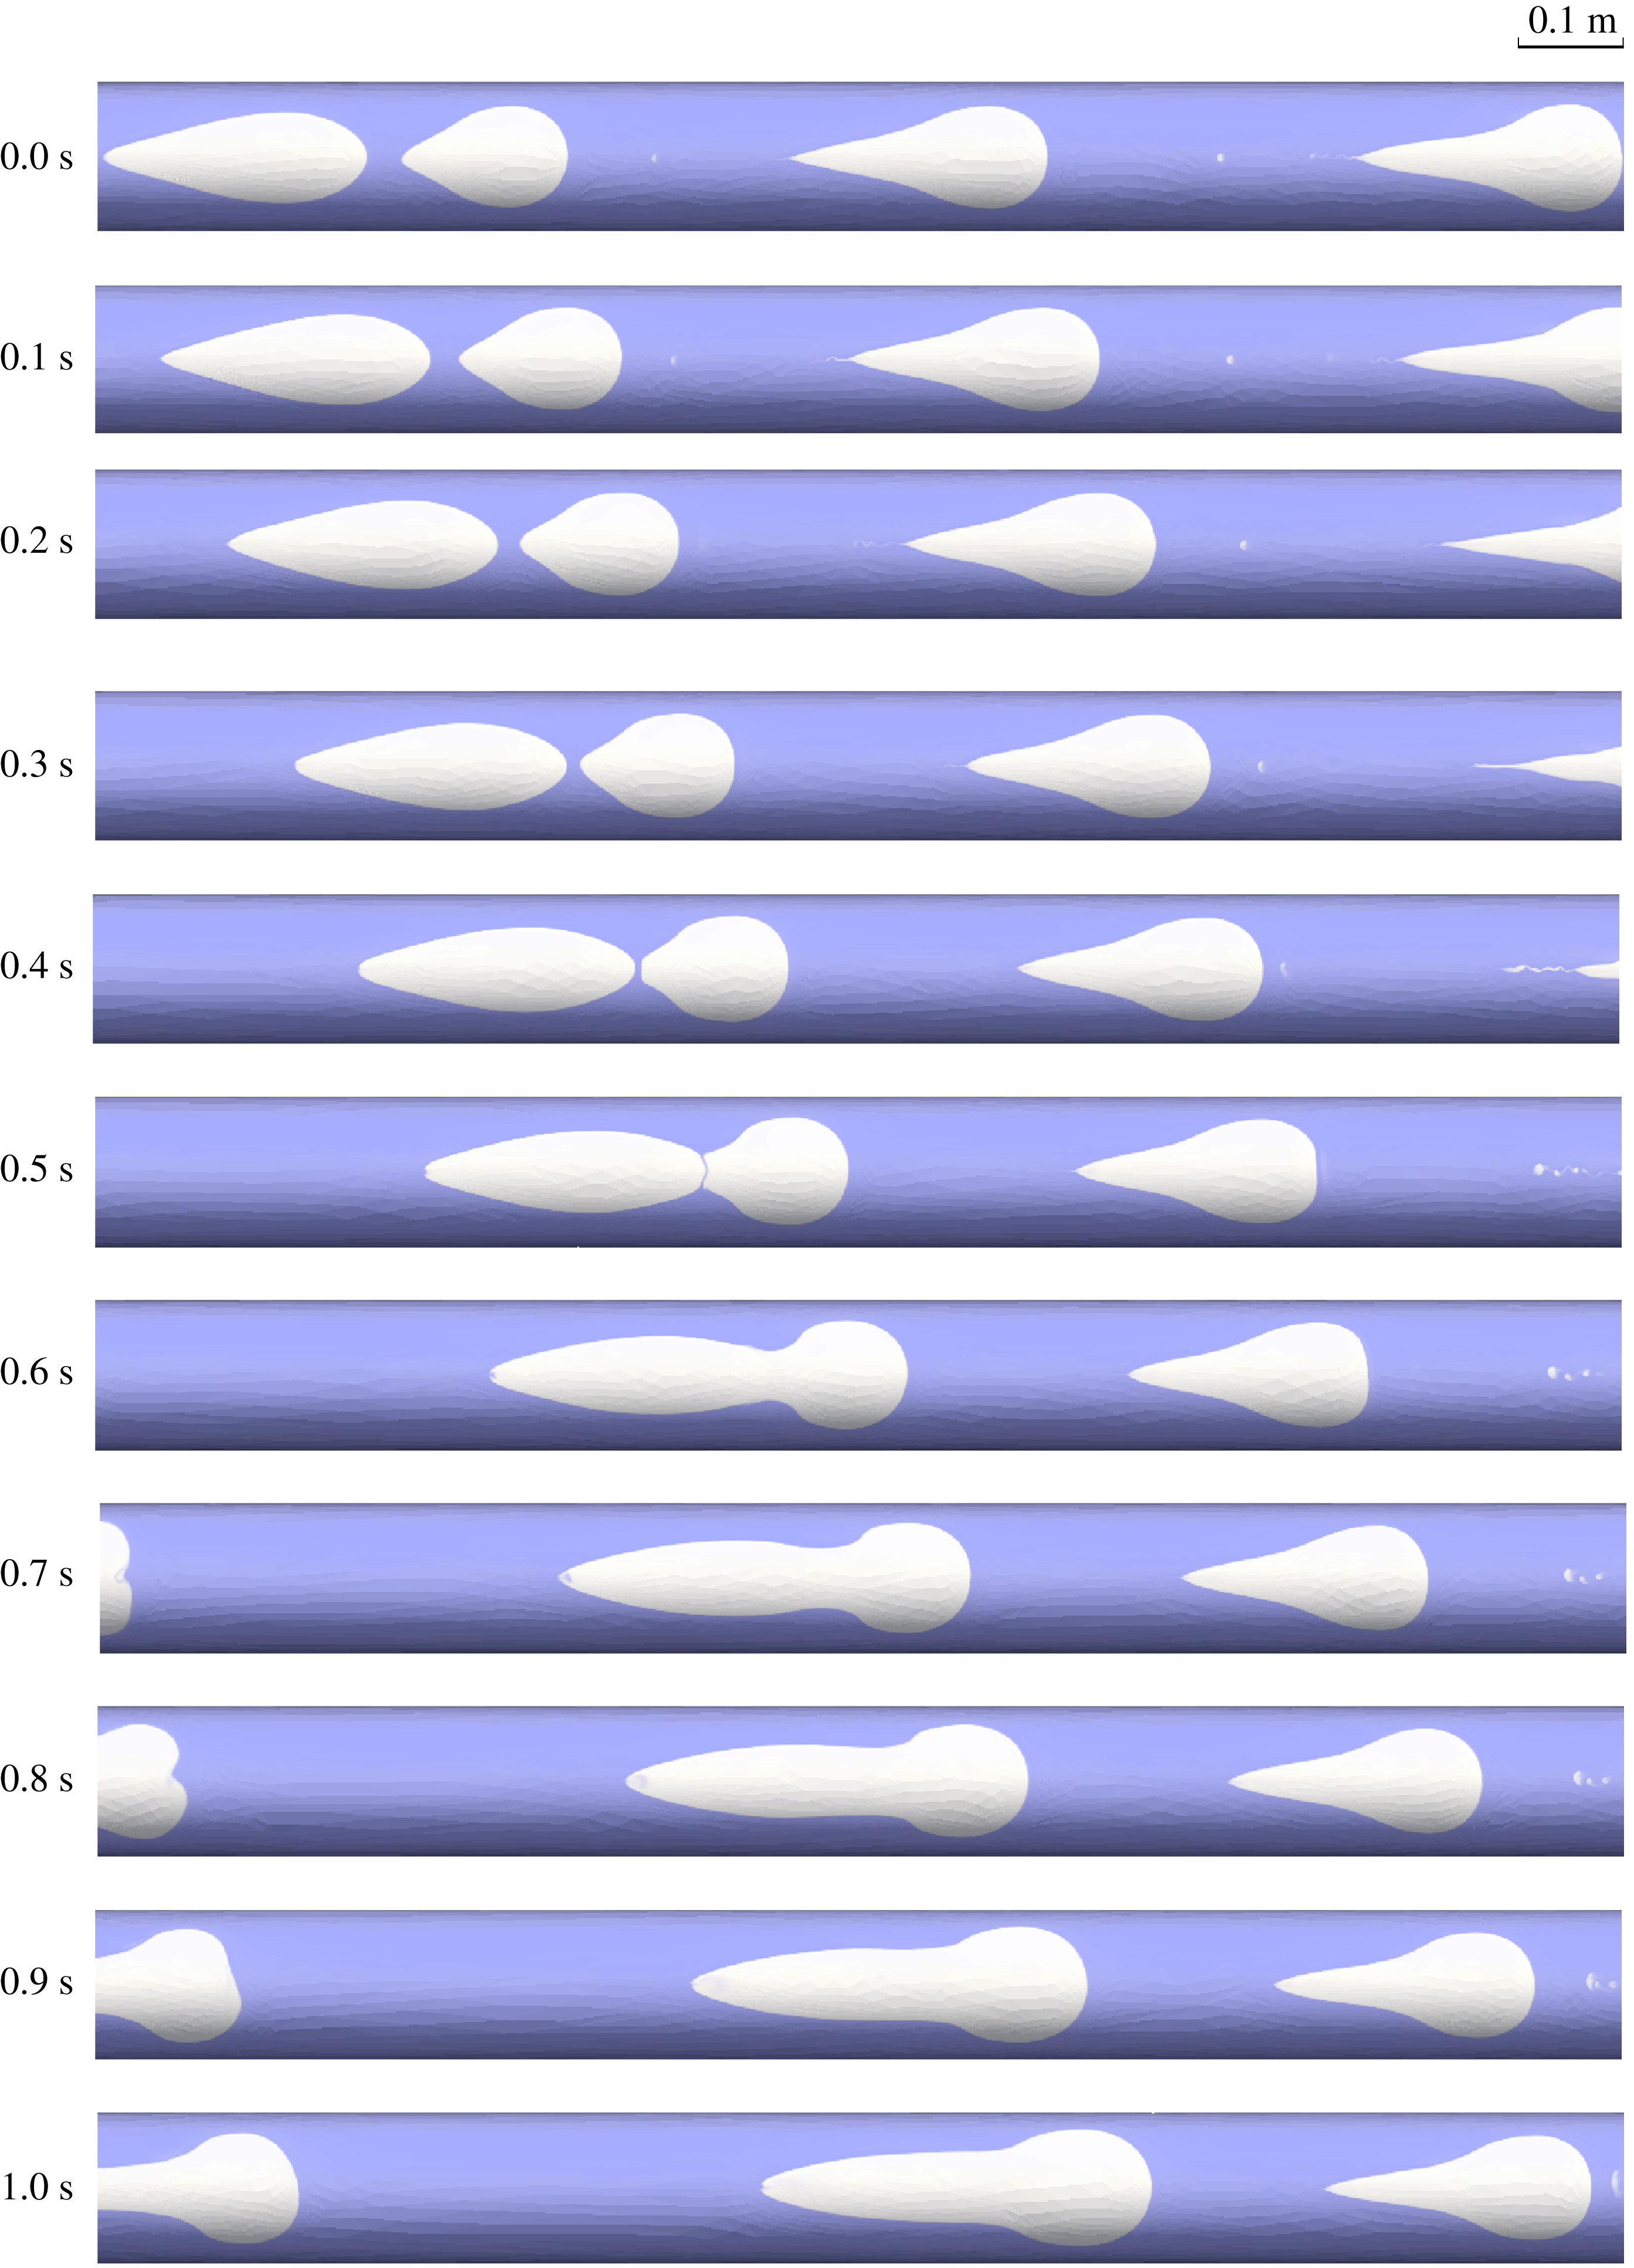
Figure 8. Simulation results showing the coalescence process for two bubbles in the
![]() $1.9^{\circ }$
inclined annulus.
$1.9^{\circ }$
inclined annulus.
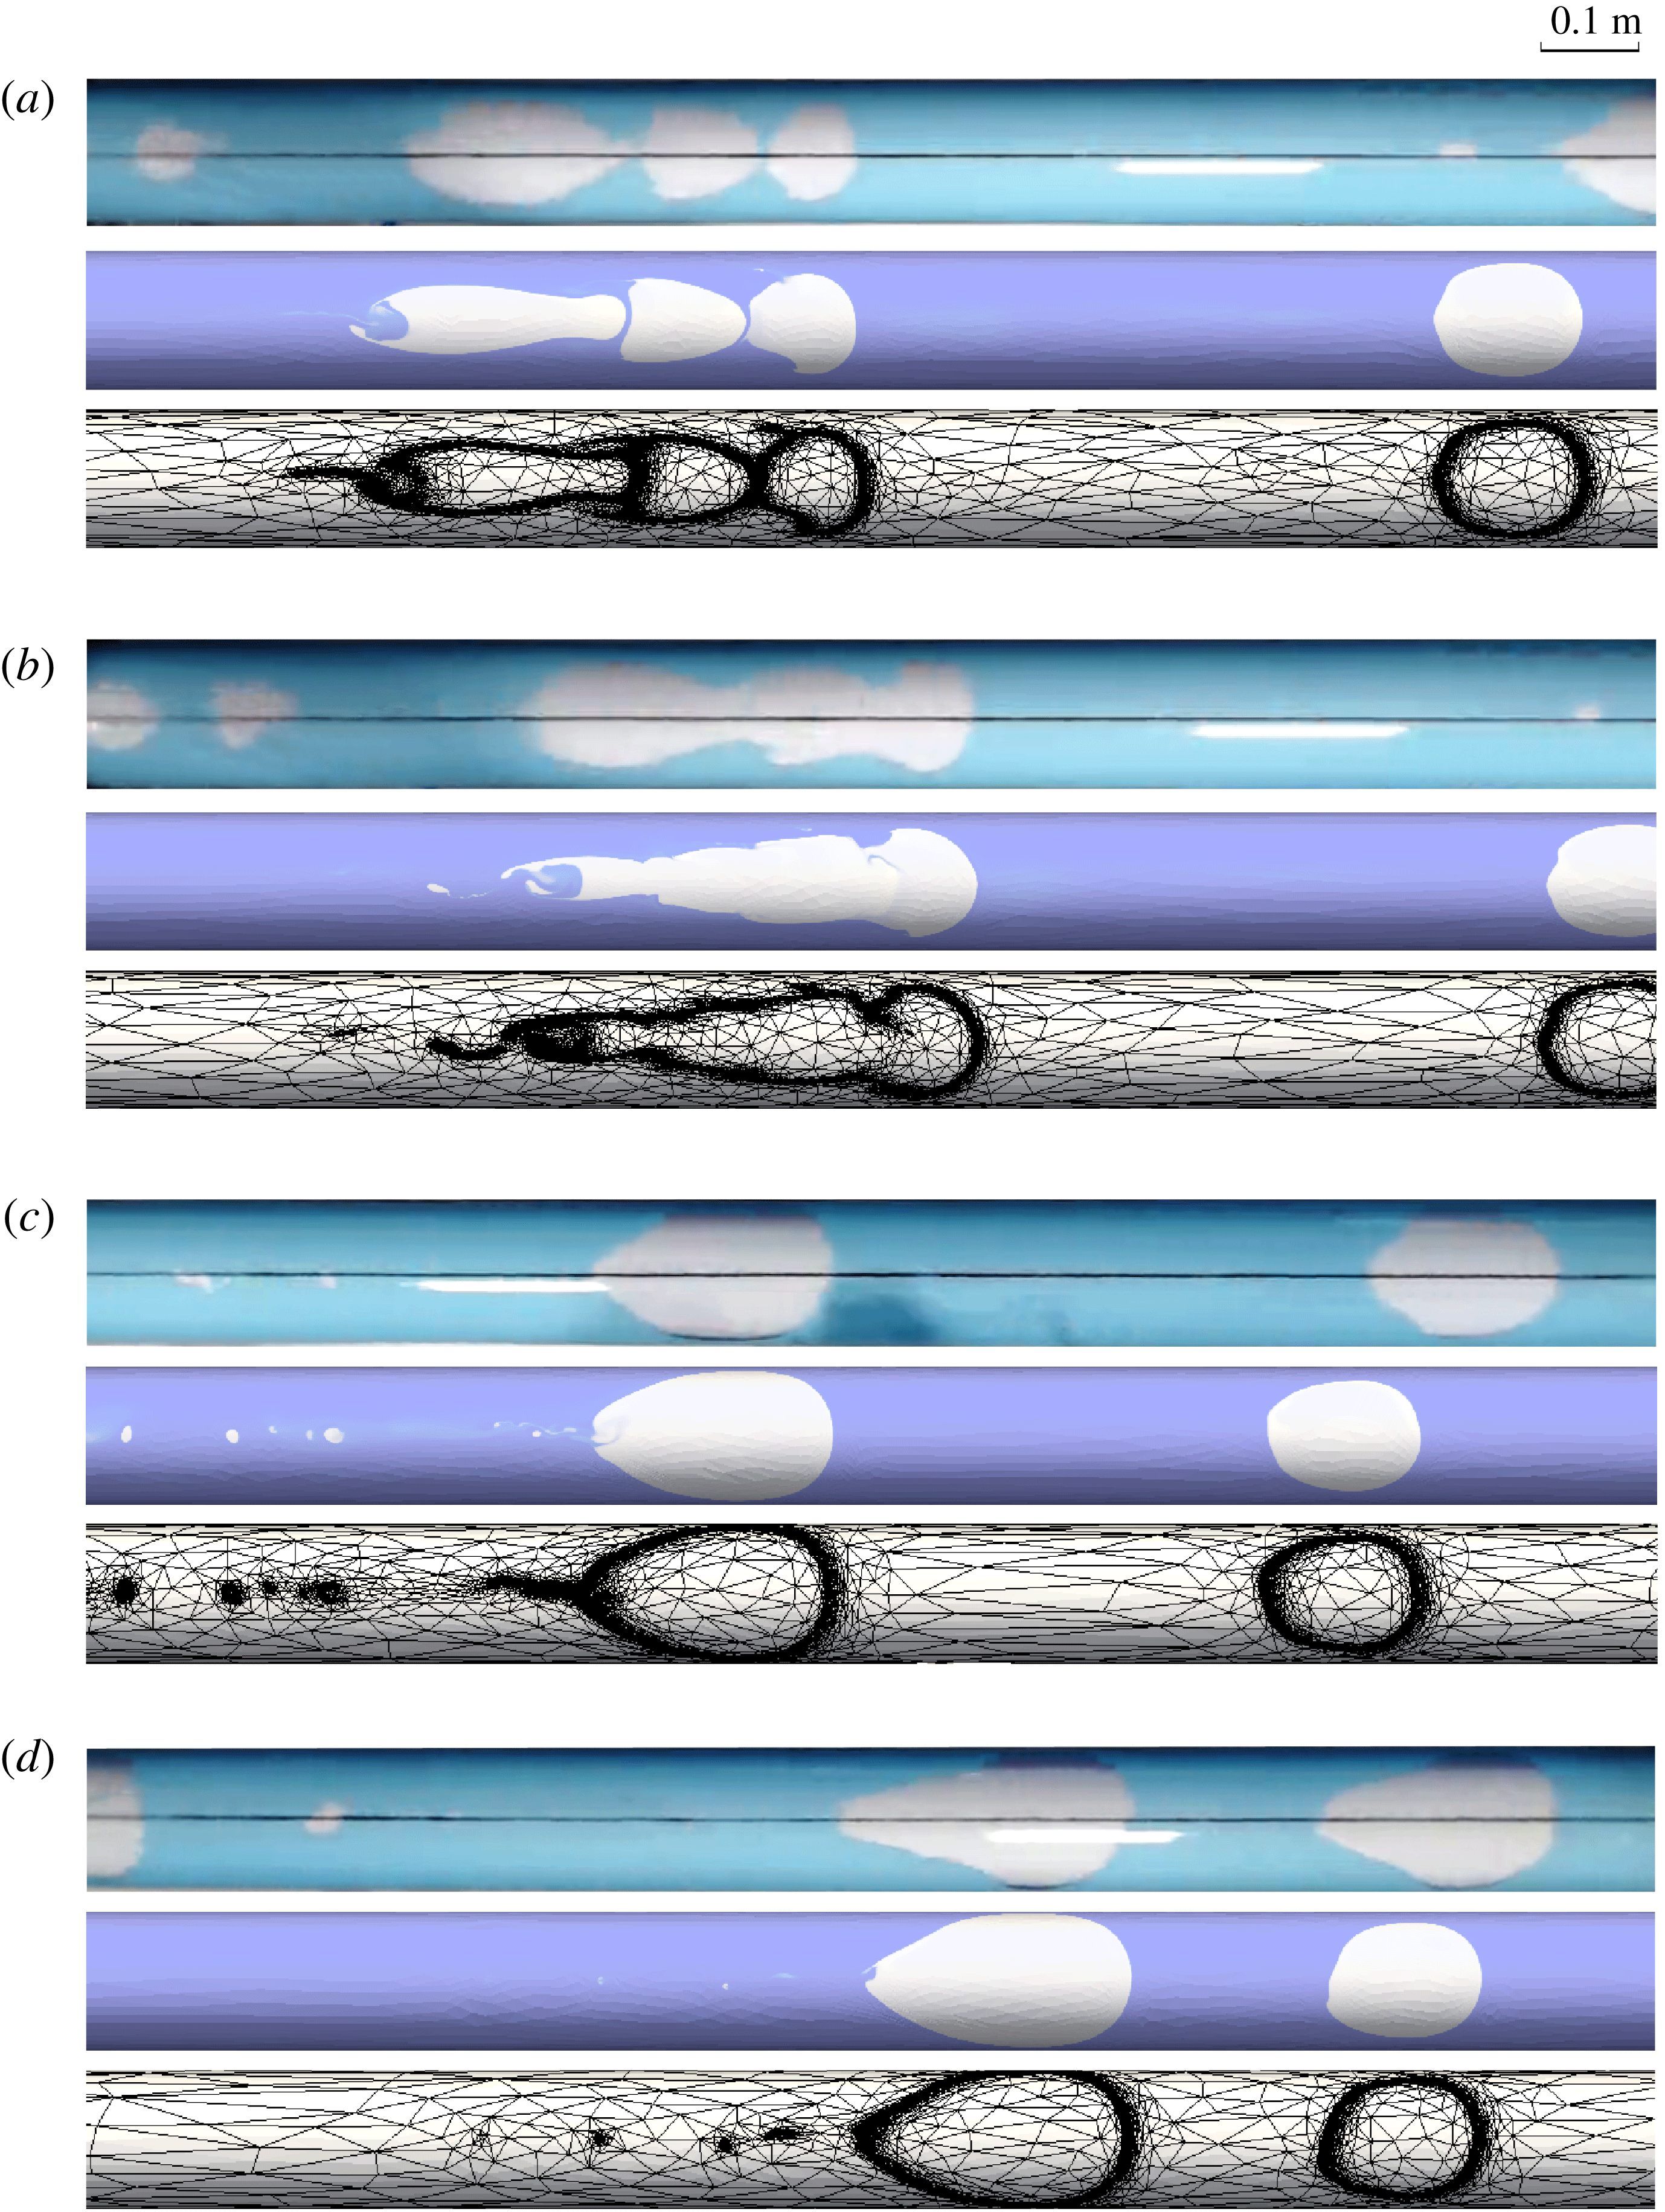
Figure 9. The formation and evolution of bubbles in the
![]() $4.6^{\circ }$
inclined annulus (top view): (a) generation and interaction of bubbles close to the inlet (in annulus subsection 1), (b) coalescence of the trailing, middle and leading bubbles (in annulus subsection 1), (c) stabilisation of merged larger bubbles (in annulus subsection 2) and (d) translation of steady bubbles to the outlet (in annulus subsection 3). Each figure panel includes the experimental observation, the simulation result and the adaptive unstructured mesh used in the simulation.
$4.6^{\circ }$
inclined annulus (top view): (a) generation and interaction of bubbles close to the inlet (in annulus subsection 1), (b) coalescence of the trailing, middle and leading bubbles (in annulus subsection 1), (c) stabilisation of merged larger bubbles (in annulus subsection 2) and (d) translation of steady bubbles to the outlet (in annulus subsection 3). Each figure panel includes the experimental observation, the simulation result and the adaptive unstructured mesh used in the simulation.
In the
![]() $4.6^{\circ }$
inclined case (figure 9), bubbles became more compact and almost lost the tail structure although the cap shape remained similar to that in the horizontal case. Bubbles separated from the inlet quickly and again formed a train (figure 9
a). The bubbles could merge at an earlier stage by virtue of their smaller spacing and simultaneous coalescence of three bubbles could occur (figure 9
a,b). During the coalescence of three bubbles, the leading bubble remained a semi-circular cap, whereas its rear was flattened; the middle bubble was between the leading and trailing bubbles and showed a sharpened front and a flattened rear; the trailing bubble displayed a narrowed front invading into the back of middle bubble. As merging occurred, the liquid films between bubbles broke and dissipated, such that a united larger bubble was formed with a highly tortuous, unsteady shape. The coalesced larger bubble gradually stabilised itself (figure 9
c) and then migrated to the exit (figure 9
d).
$4.6^{\circ }$
inclined case (figure 9), bubbles became more compact and almost lost the tail structure although the cap shape remained similar to that in the horizontal case. Bubbles separated from the inlet quickly and again formed a train (figure 9
a). The bubbles could merge at an earlier stage by virtue of their smaller spacing and simultaneous coalescence of three bubbles could occur (figure 9
a,b). During the coalescence of three bubbles, the leading bubble remained a semi-circular cap, whereas its rear was flattened; the middle bubble was between the leading and trailing bubbles and showed a sharpened front and a flattened rear; the trailing bubble displayed a narrowed front invading into the back of middle bubble. As merging occurred, the liquid films between bubbles broke and dissipated, such that a united larger bubble was formed with a highly tortuous, unsteady shape. The coalesced larger bubble gradually stabilised itself (figure 9
c) and then migrated to the exit (figure 9
d).
The statistics of the normalised length, cap diameter and terminal velocity of stabilised bubbles in the cases of different inclinations are compared in figure 10. Data from ten fully developed bubbles were collected in the region 2–5 m downstream of the inlet, where the bubbles were not influenced by either inlet or outlet effects. As expected from the discussion above, the bubble length reduces significantly as the inclination of the annulus increases (figure 10 a), due to the deterioration of tail structure. However, the cap diameter, measured based on the curvature of the cap front, only shows a slight increase with the inclination of the annulus (figure 10 b). The terminal velocity of the bubbles also increases slightly with inclination (figure 10 c). An excellent quantitative match with the experimental measurements was achieved by the numerical model. The pseudo-periodic nature of the slug flow and variation of bubble properties as observed in the experiment was also well captured in the simulation (figure 10). Although the inlet condition was stationary, the slug flow pattern varied constantly.
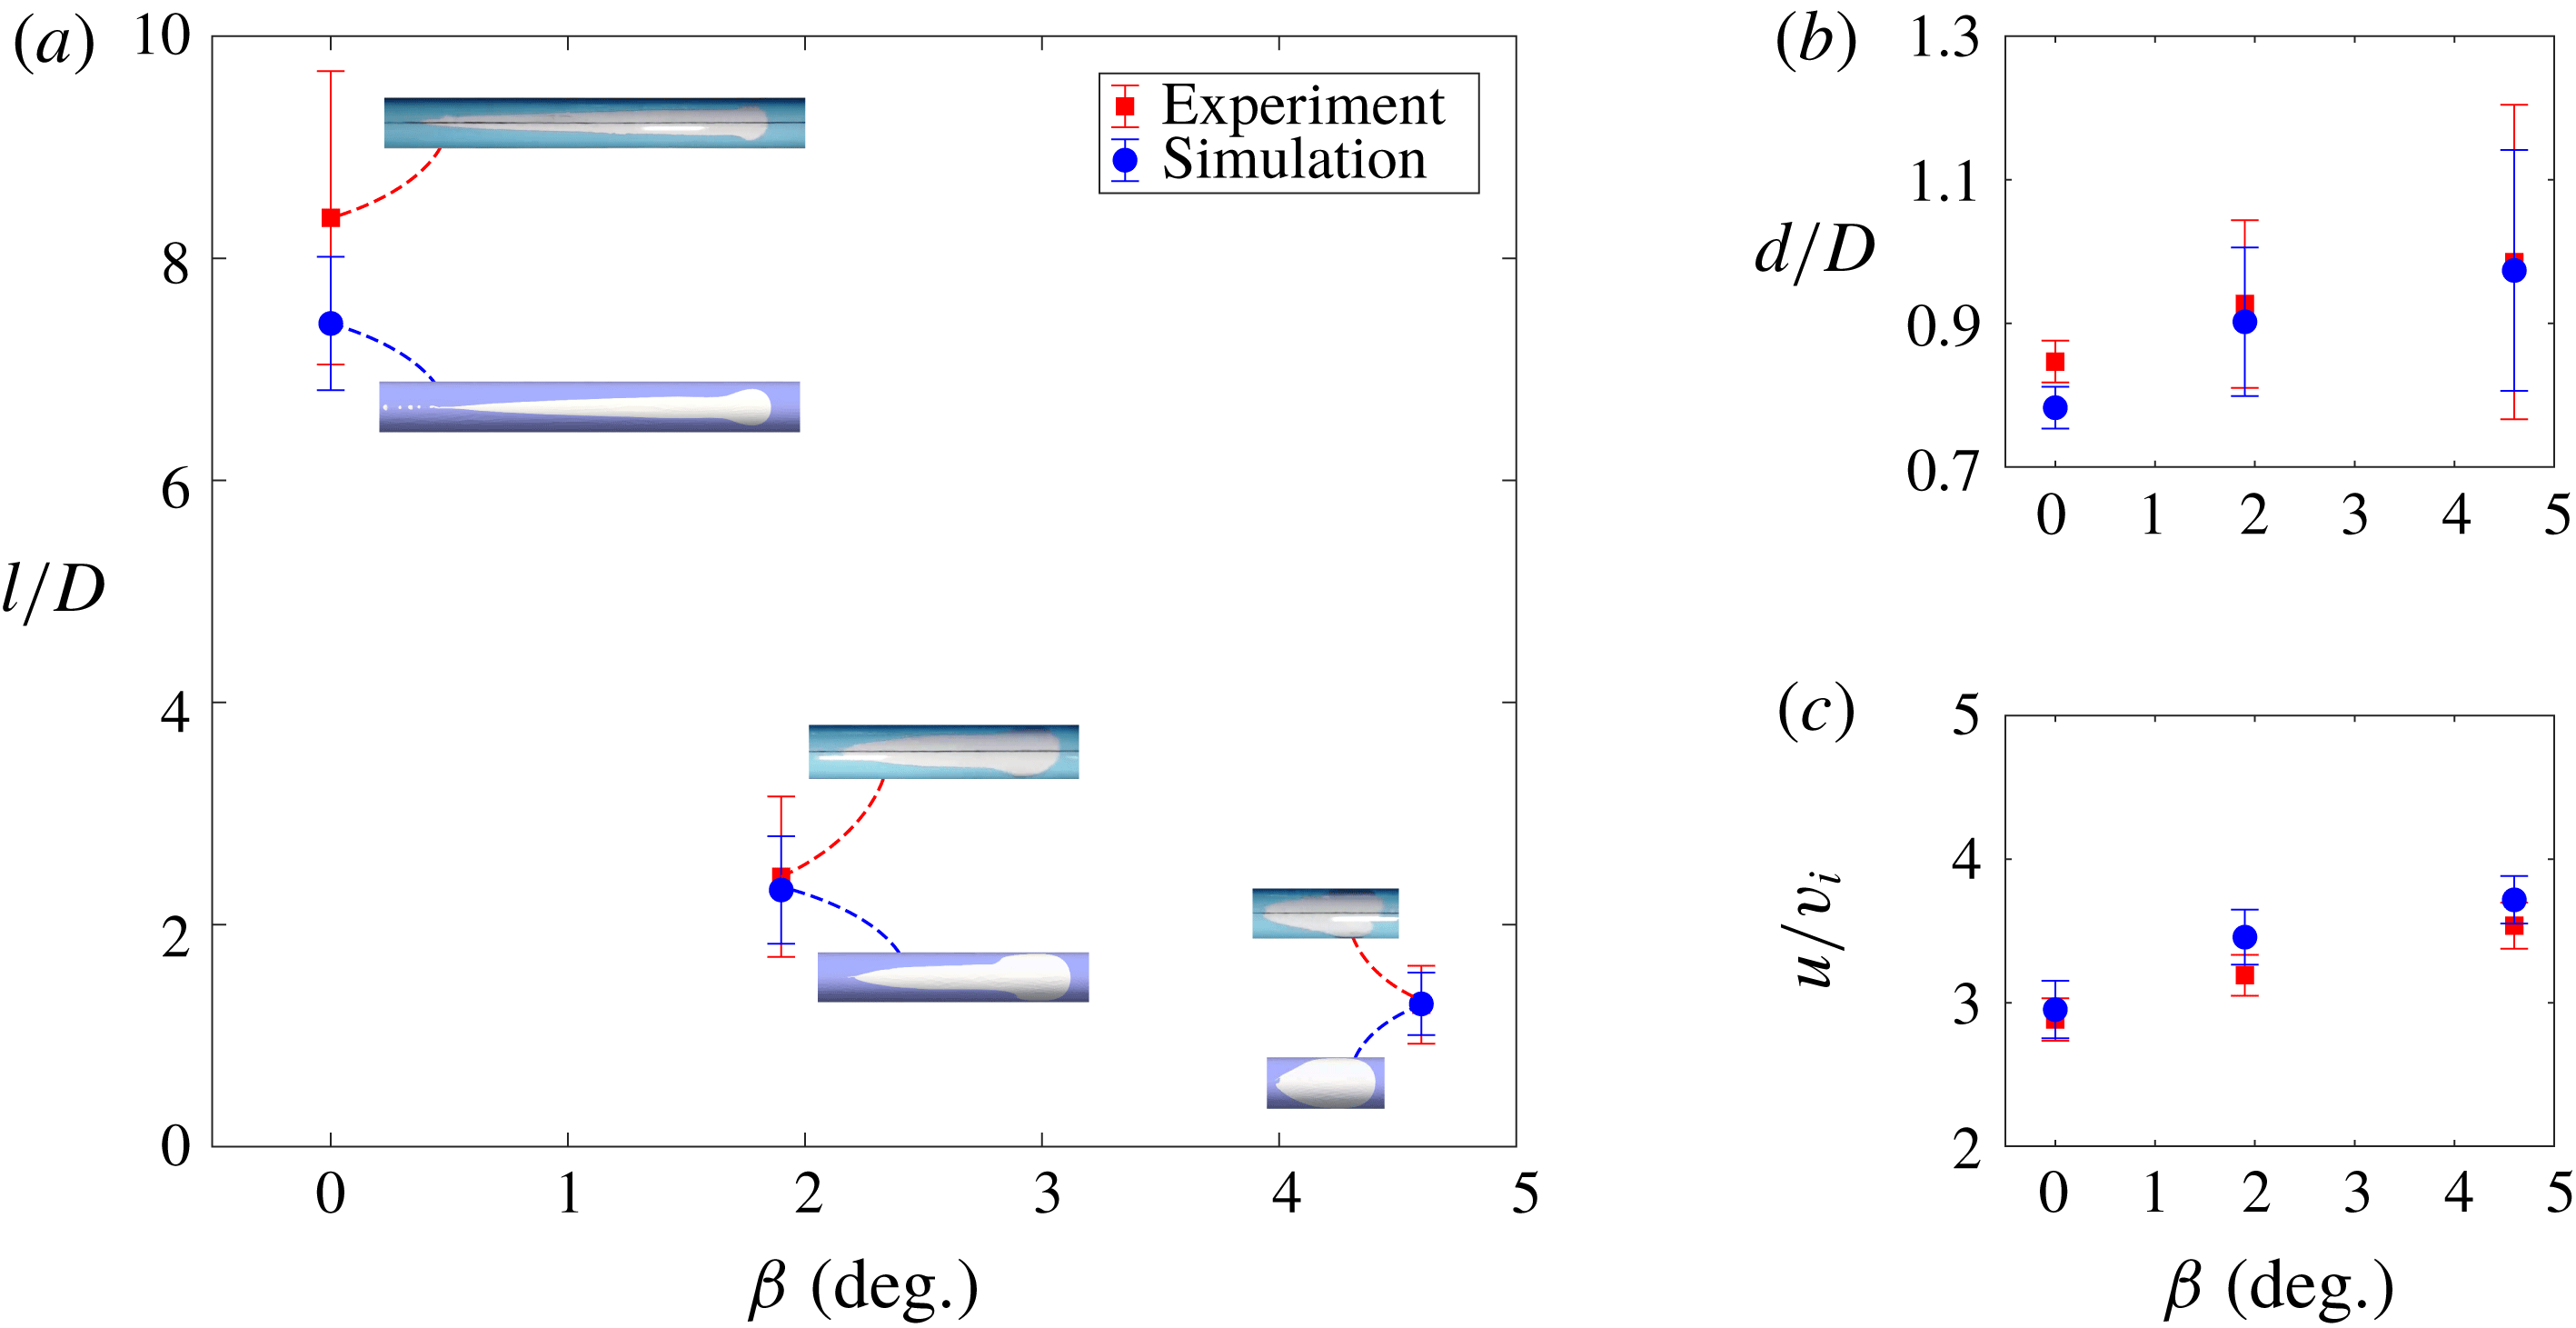
Figure 10. Variation of bubble properties with the inclination angle
![]() $\unicode[STIX]{x1D6FD}$
: (a) normalised bubble length
$\unicode[STIX]{x1D6FD}$
: (a) normalised bubble length
![]() $l/D$
, (b) normalised bubble cap diameter
$l/D$
, (b) normalised bubble cap diameter
![]() $d/D$
and (c) normalised bubble terminal velocity
$d/D$
and (c) normalised bubble terminal velocity
![]() $u/v_{i}$
.
$u/v_{i}$
.
4.2 Effects of gap thickness and pipe diameter
We used the numerical model to further elucidate the effects of gap thickness and pipe diameter on bubbles in thin annuli. First, we set the pipe diameter to be
![]() $D=0.137$
m, the air-to-water inflow rate ratio to be
$D=0.137$
m, the air-to-water inflow rate ratio to be
![]() $q_{a}/q_{w}=1/4$
and the superficial inflow velocity to be
$q_{a}/q_{w}=1/4$
and the superficial inflow velocity to be
![]() $v_{i}=0.162~\text{m}~\text{s}^{-1}$
. We varied the gap thickness
$v_{i}=0.162~\text{m}~\text{s}^{-1}$
. We varied the gap thickness
![]() $h$
from 0.001 to 0.005 m, for which the flow remained to be laminar (Beavers et al.
Reference Beavers, Sparrow and Magnuson1970) and cross-gap gravity effect was not significant. As shown in figure 11(a), when
$h$
from 0.001 to 0.005 m, for which the flow remained to be laminar (Beavers et al.
Reference Beavers, Sparrow and Magnuson1970) and cross-gap gravity effect was not significant. As shown in figure 11(a), when
![]() $h=0.001$
m (i.e.
$h=0.001$
m (i.e.
![]() $h/D=0.0073$
), the bubbles in the horizontal and inclined annuli are very similar, having a slender oval shape with a semi-circular front and a gradually narrowed rear (no discernible neck existed). In the horizontal case, as
$h/D=0.0073$
), the bubbles in the horizontal and inclined annuli are very similar, having a slender oval shape with a semi-circular front and a gradually narrowed rear (no discernible neck existed). In the horizontal case, as
![]() $h$
becomes larger, the tadpole-like shape becomes more pronounced with a much longer tail and a more distinct neck where the tail joins the cap. If the annulus is inclined, as
$h$
becomes larger, the tadpole-like shape becomes more pronounced with a much longer tail and a more distinct neck where the tail joins the cap. If the annulus is inclined, as
![]() $h$
increases, the tail tends to vanish and the bubble length decreases significantly. In contrast to the marked variation of bubble length with
$h$
increases, the tail tends to vanish and the bubble length decreases significantly. In contrast to the marked variation of bubble length with
![]() $h$
, the cap diameter and terminal velocity are much less sensitive to
$h$
, the cap diameter and terminal velocity are much less sensitive to
![]() $h$
(figure 11
b,c).
$h$
(figure 11
b,c).
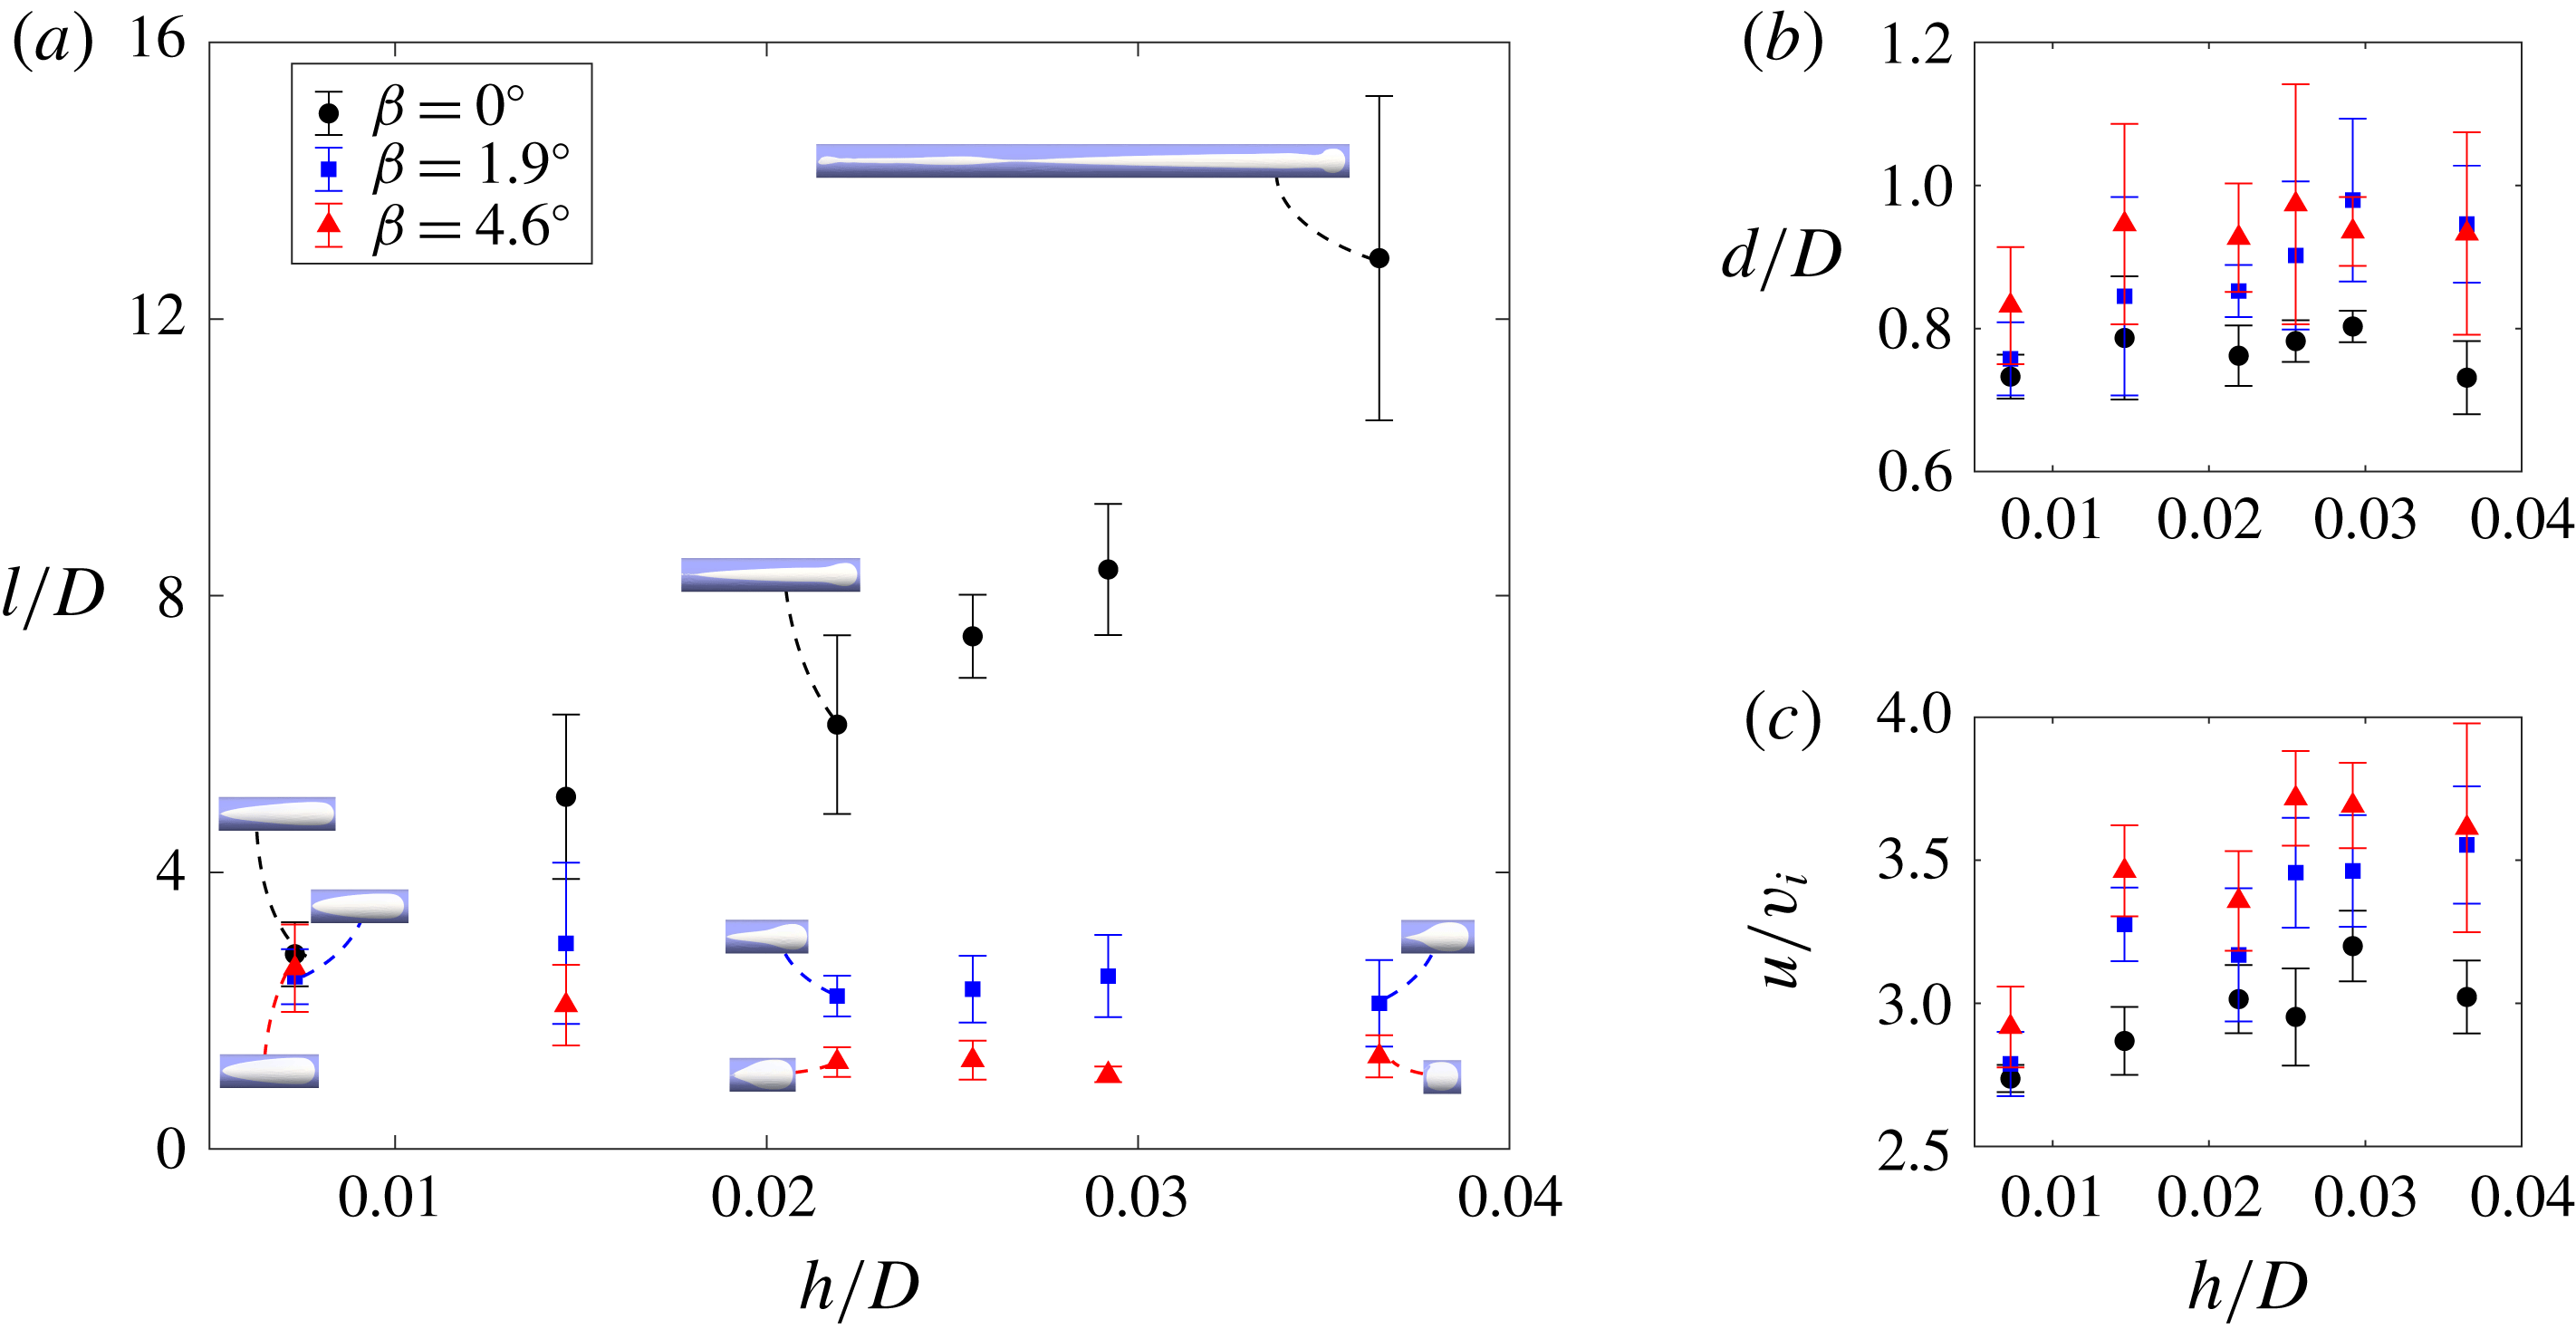
Figure 11. Variation of bubble properties with the gap thickness
![]() $h$
while the pipe diameter
$h$
while the pipe diameter
![]() $D$
is fixed to be
$D$
is fixed to be
![]() $0.137$
m: (a) normalised bubble length
$0.137$
m: (a) normalised bubble length
![]() $l/D$
, (b) normalised bubble cap diameter
$l/D$
, (b) normalised bubble cap diameter
![]() $d/D$
and (c) normalised bubble terminal velocity
$d/D$
and (c) normalised bubble terminal velocity
![]() $u/v_{i}$
.
$u/v_{i}$
.
Next, we explored the effect of changing pipe diameter
![]() $D=0.05$
–0.4 m (the pipe length
$D=0.05$
–0.4 m (the pipe length
![]() $L$
also varied with
$L$
also varied with
![]() $D$
according to a fixed ratio
$D$
according to a fixed ratio
![]() $L/D=43.8$
), keeping
$L/D=43.8$
), keeping
![]() $h=0.0035$
m and the same inflow conditions as before. Note that, in figure 12, the bubble length and cap diameter in each case are normalised by the corresponding pipe diameter. As shown in figure 12(a), the ratio of bubble length to the pipe diameter generally does not vary significantly with the change of
$h=0.0035$
m and the same inflow conditions as before. Note that, in figure 12, the bubble length and cap diameter in each case are normalised by the corresponding pipe diameter. As shown in figure 12(a), the ratio of bubble length to the pipe diameter generally does not vary significantly with the change of
![]() $D$
. However, in the horizontal annulus with
$D$
. However, in the horizontal annulus with
![]() $D=0.4$
m (i.e.
$D=0.4$
m (i.e.
![]() $h/D=0.0087$
), the bubble has a very long, extremely stretched, wavy tail, which does not disconnect from the inlet; the bubble length, therefore, corresponds to the whole pipe length. With the decrease of
$h/D=0.0087$
), the bubble has a very long, extremely stretched, wavy tail, which does not disconnect from the inlet; the bubble length, therefore, corresponds to the whole pipe length. With the decrease of
![]() $D$
(i.e. increase of
$D$
(i.e. increase of
![]() $h/D$
), the cap diameter relative to the pipe diameter increases while the bubble velocity decreases (figure 12
b,c).
$h/D$
), the cap diameter relative to the pipe diameter increases while the bubble velocity decreases (figure 12
b,c).
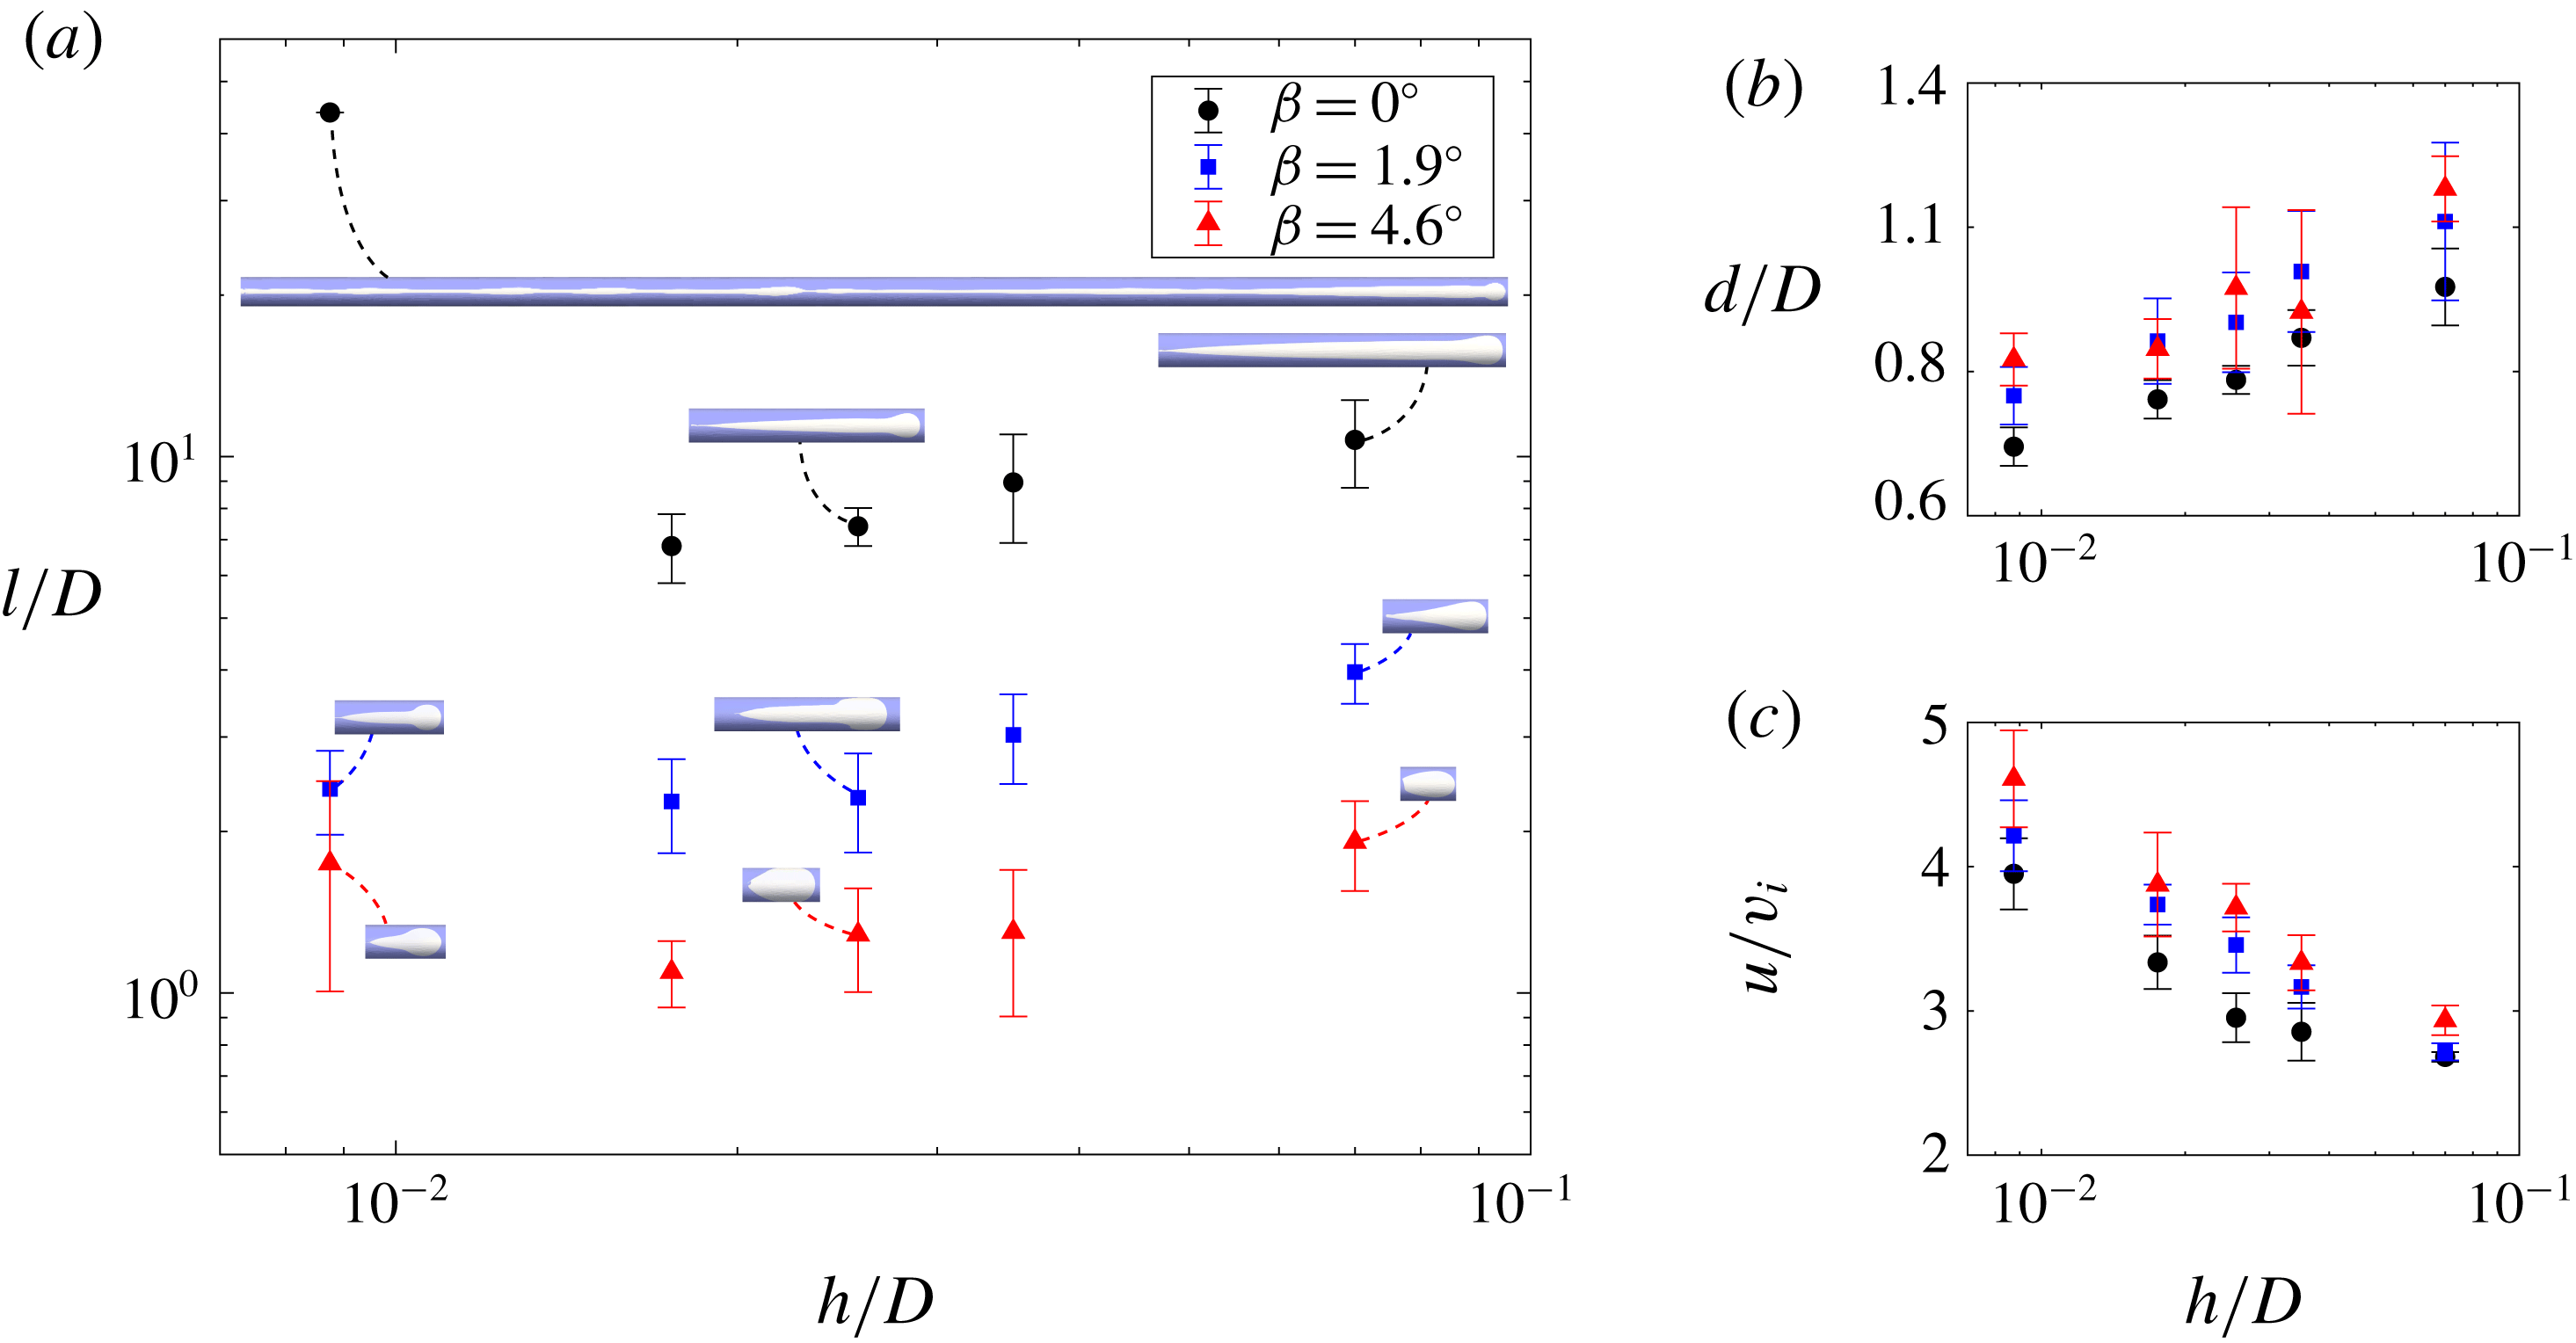
Figure 12. Variation of bubble properties with the pipe diameter
![]() $D$
while the gap thickness
$D$
while the gap thickness
![]() $h$
is fixed to be 0.0035 m: (a) normalised bubble length
$h$
is fixed to be 0.0035 m: (a) normalised bubble length
![]() $l/D$
, (b) normalised bubble cap diameter
$l/D$
, (b) normalised bubble cap diameter
![]() $d/D$
and (c) normalised bubble terminal velocity
$d/D$
and (c) normalised bubble terminal velocity
![]() $u/v_{i}$
.
$u/v_{i}$
.
5 Flow mechanisms
We use the numerical model to investigate the pressure and velocity fields around the bubbles, which determine the bubble motion, shape and dynamics, and can thus provide clues for interpreting the mechanisms that control these behaviours. Figure 13(a) shows the typical steady bubbles for three different inclinations, and figures 13(b) and 13(c) give their pressure and velocity fields, respectively. To facilitate comparison, the absolute pressure at the foremost point of each bubble is chosen as the reference pressure in each case, so that the pressure contour gives the differential pressure between the absolute pressure and the reference pressure. It can be seen that inside the bubble, the pressure is generally constant due to the very low air density. The pressure in the liquid behind the bubble is higher than that in front of the bubble, driving the bubble to flow towards the outlet. The velocity of air inside the bubble is significantly higher than that of the surrounding liquid.
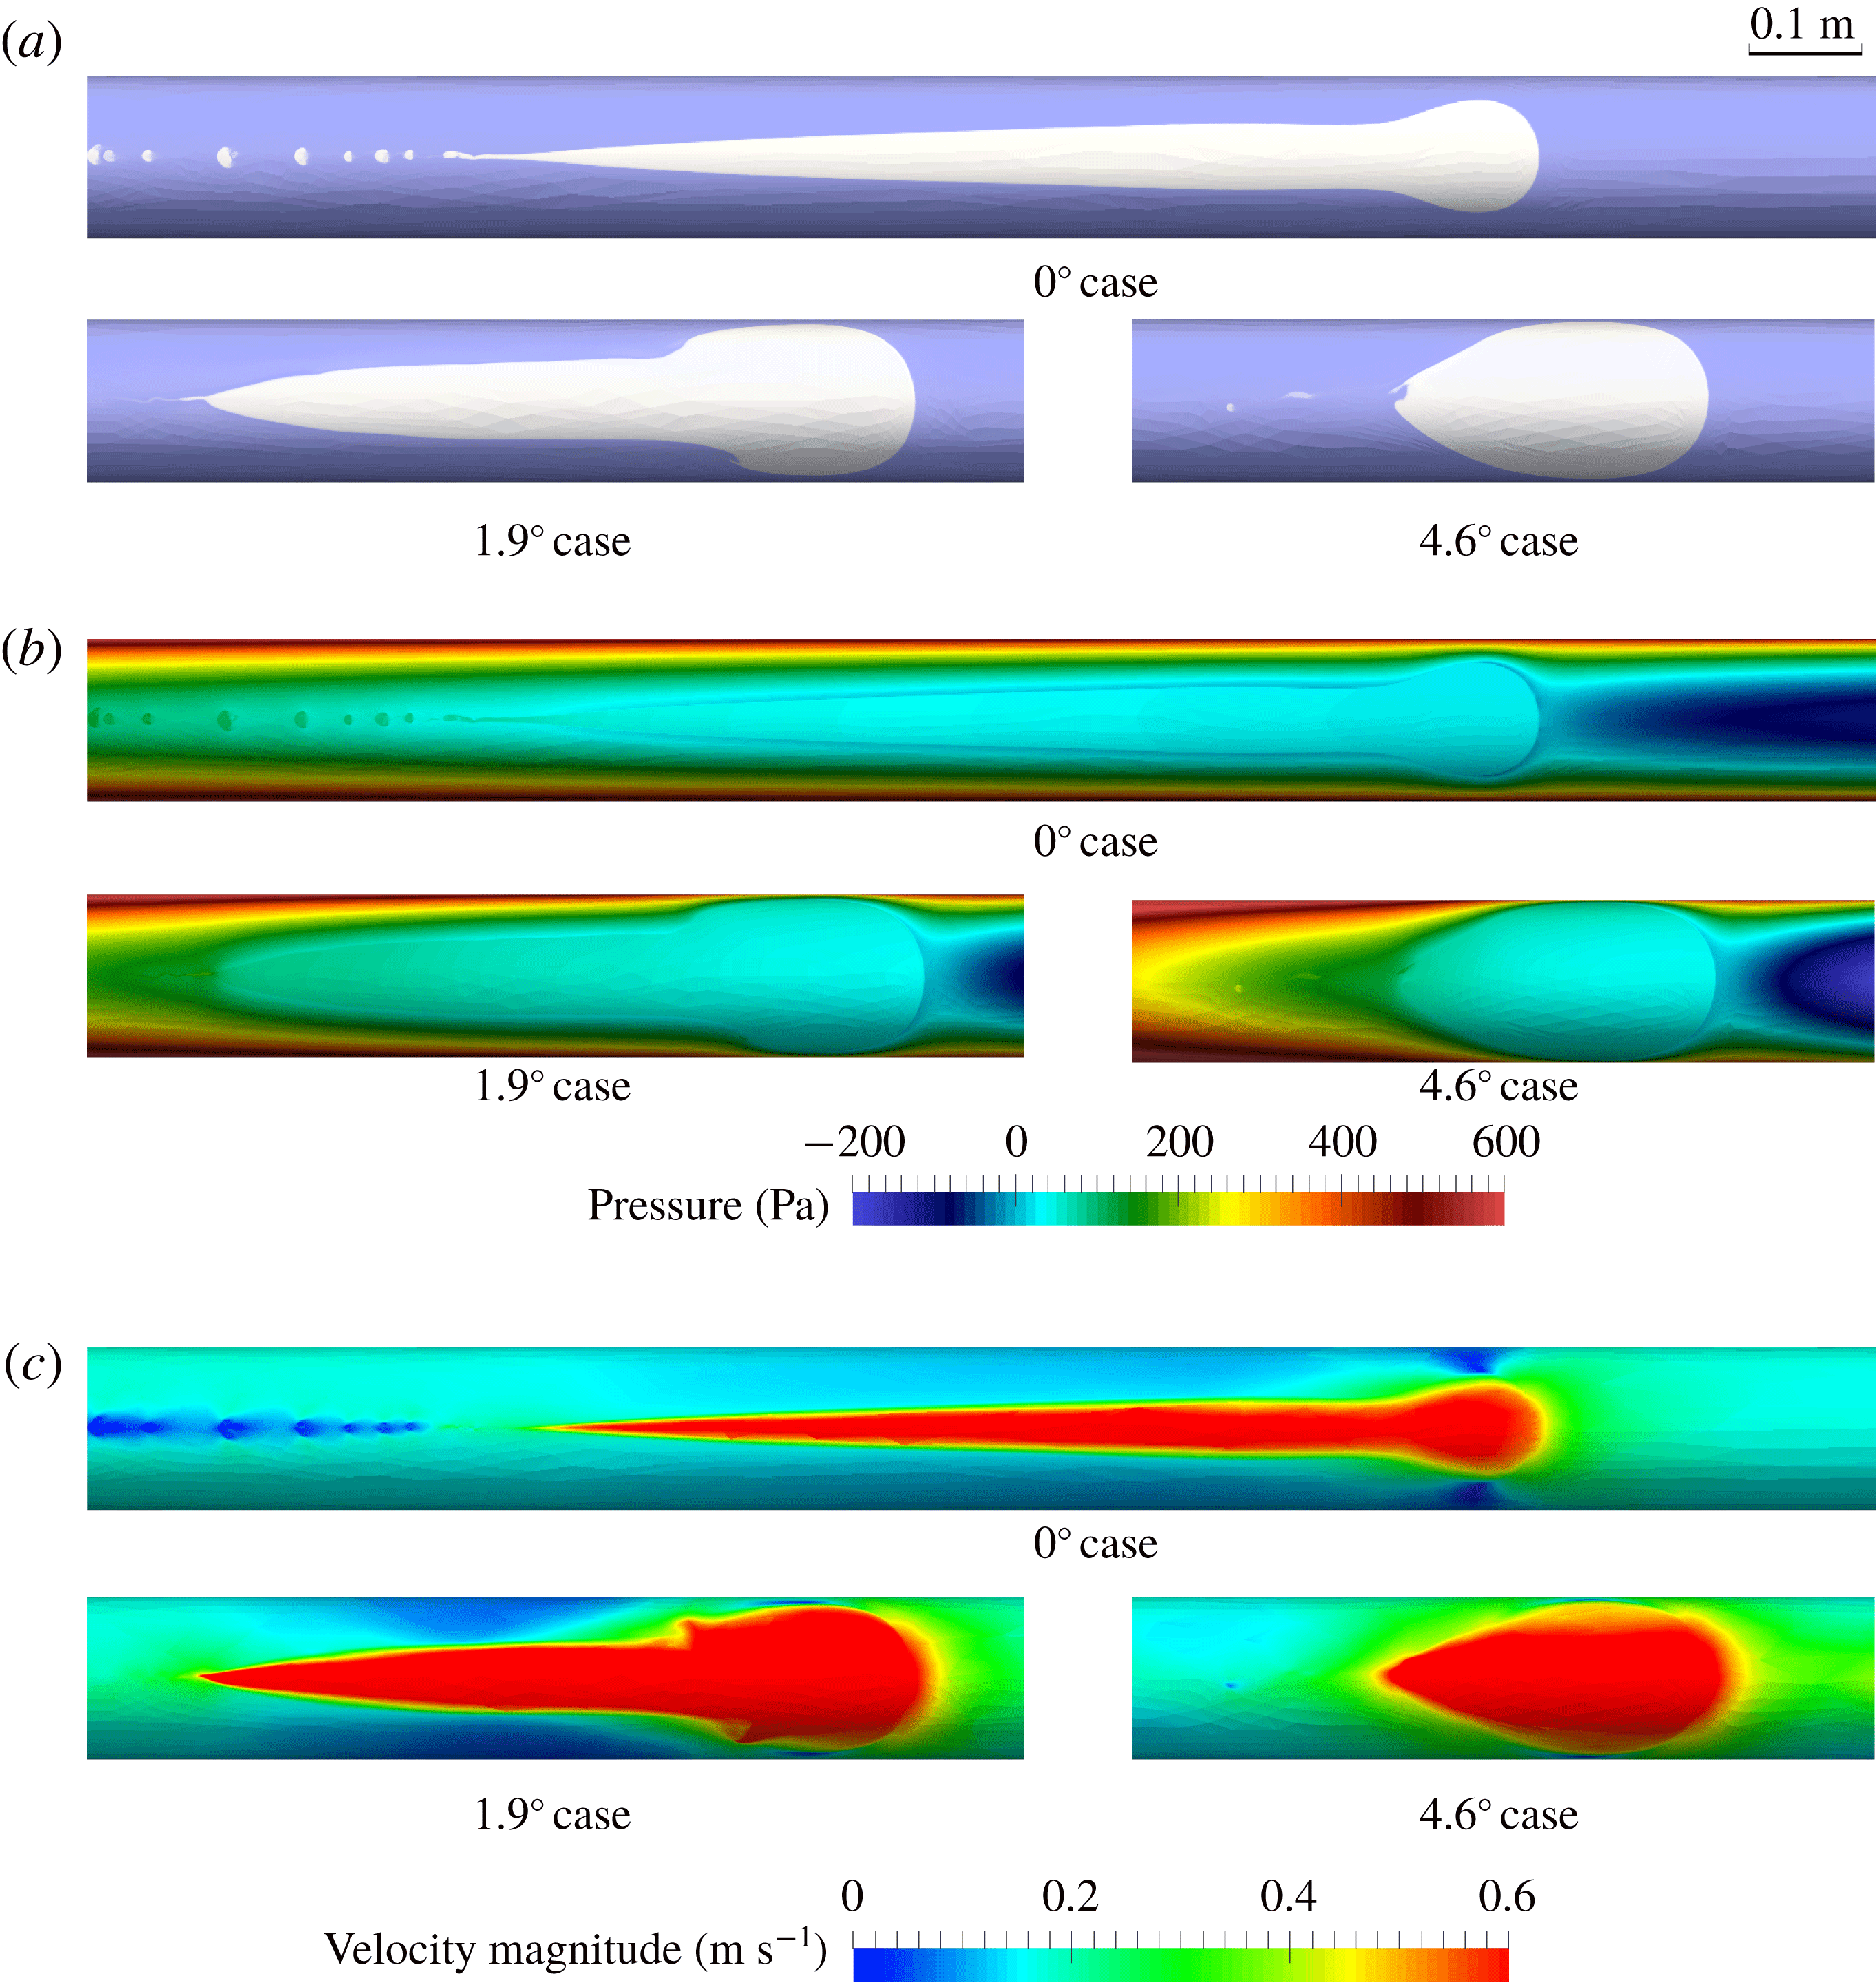
Figure 13. Simulation results showing (a) typical steady bubbles in annuli with different inclinations, and their surrounding (b) pressure and (c) velocity fields. To facilitate comparison, the absolute pressure at the frontal point of each bubble is chosen as the reference pressure for that case, so that the pressure contour gives the differential pressure between the absolute pressure and the reference pressure.
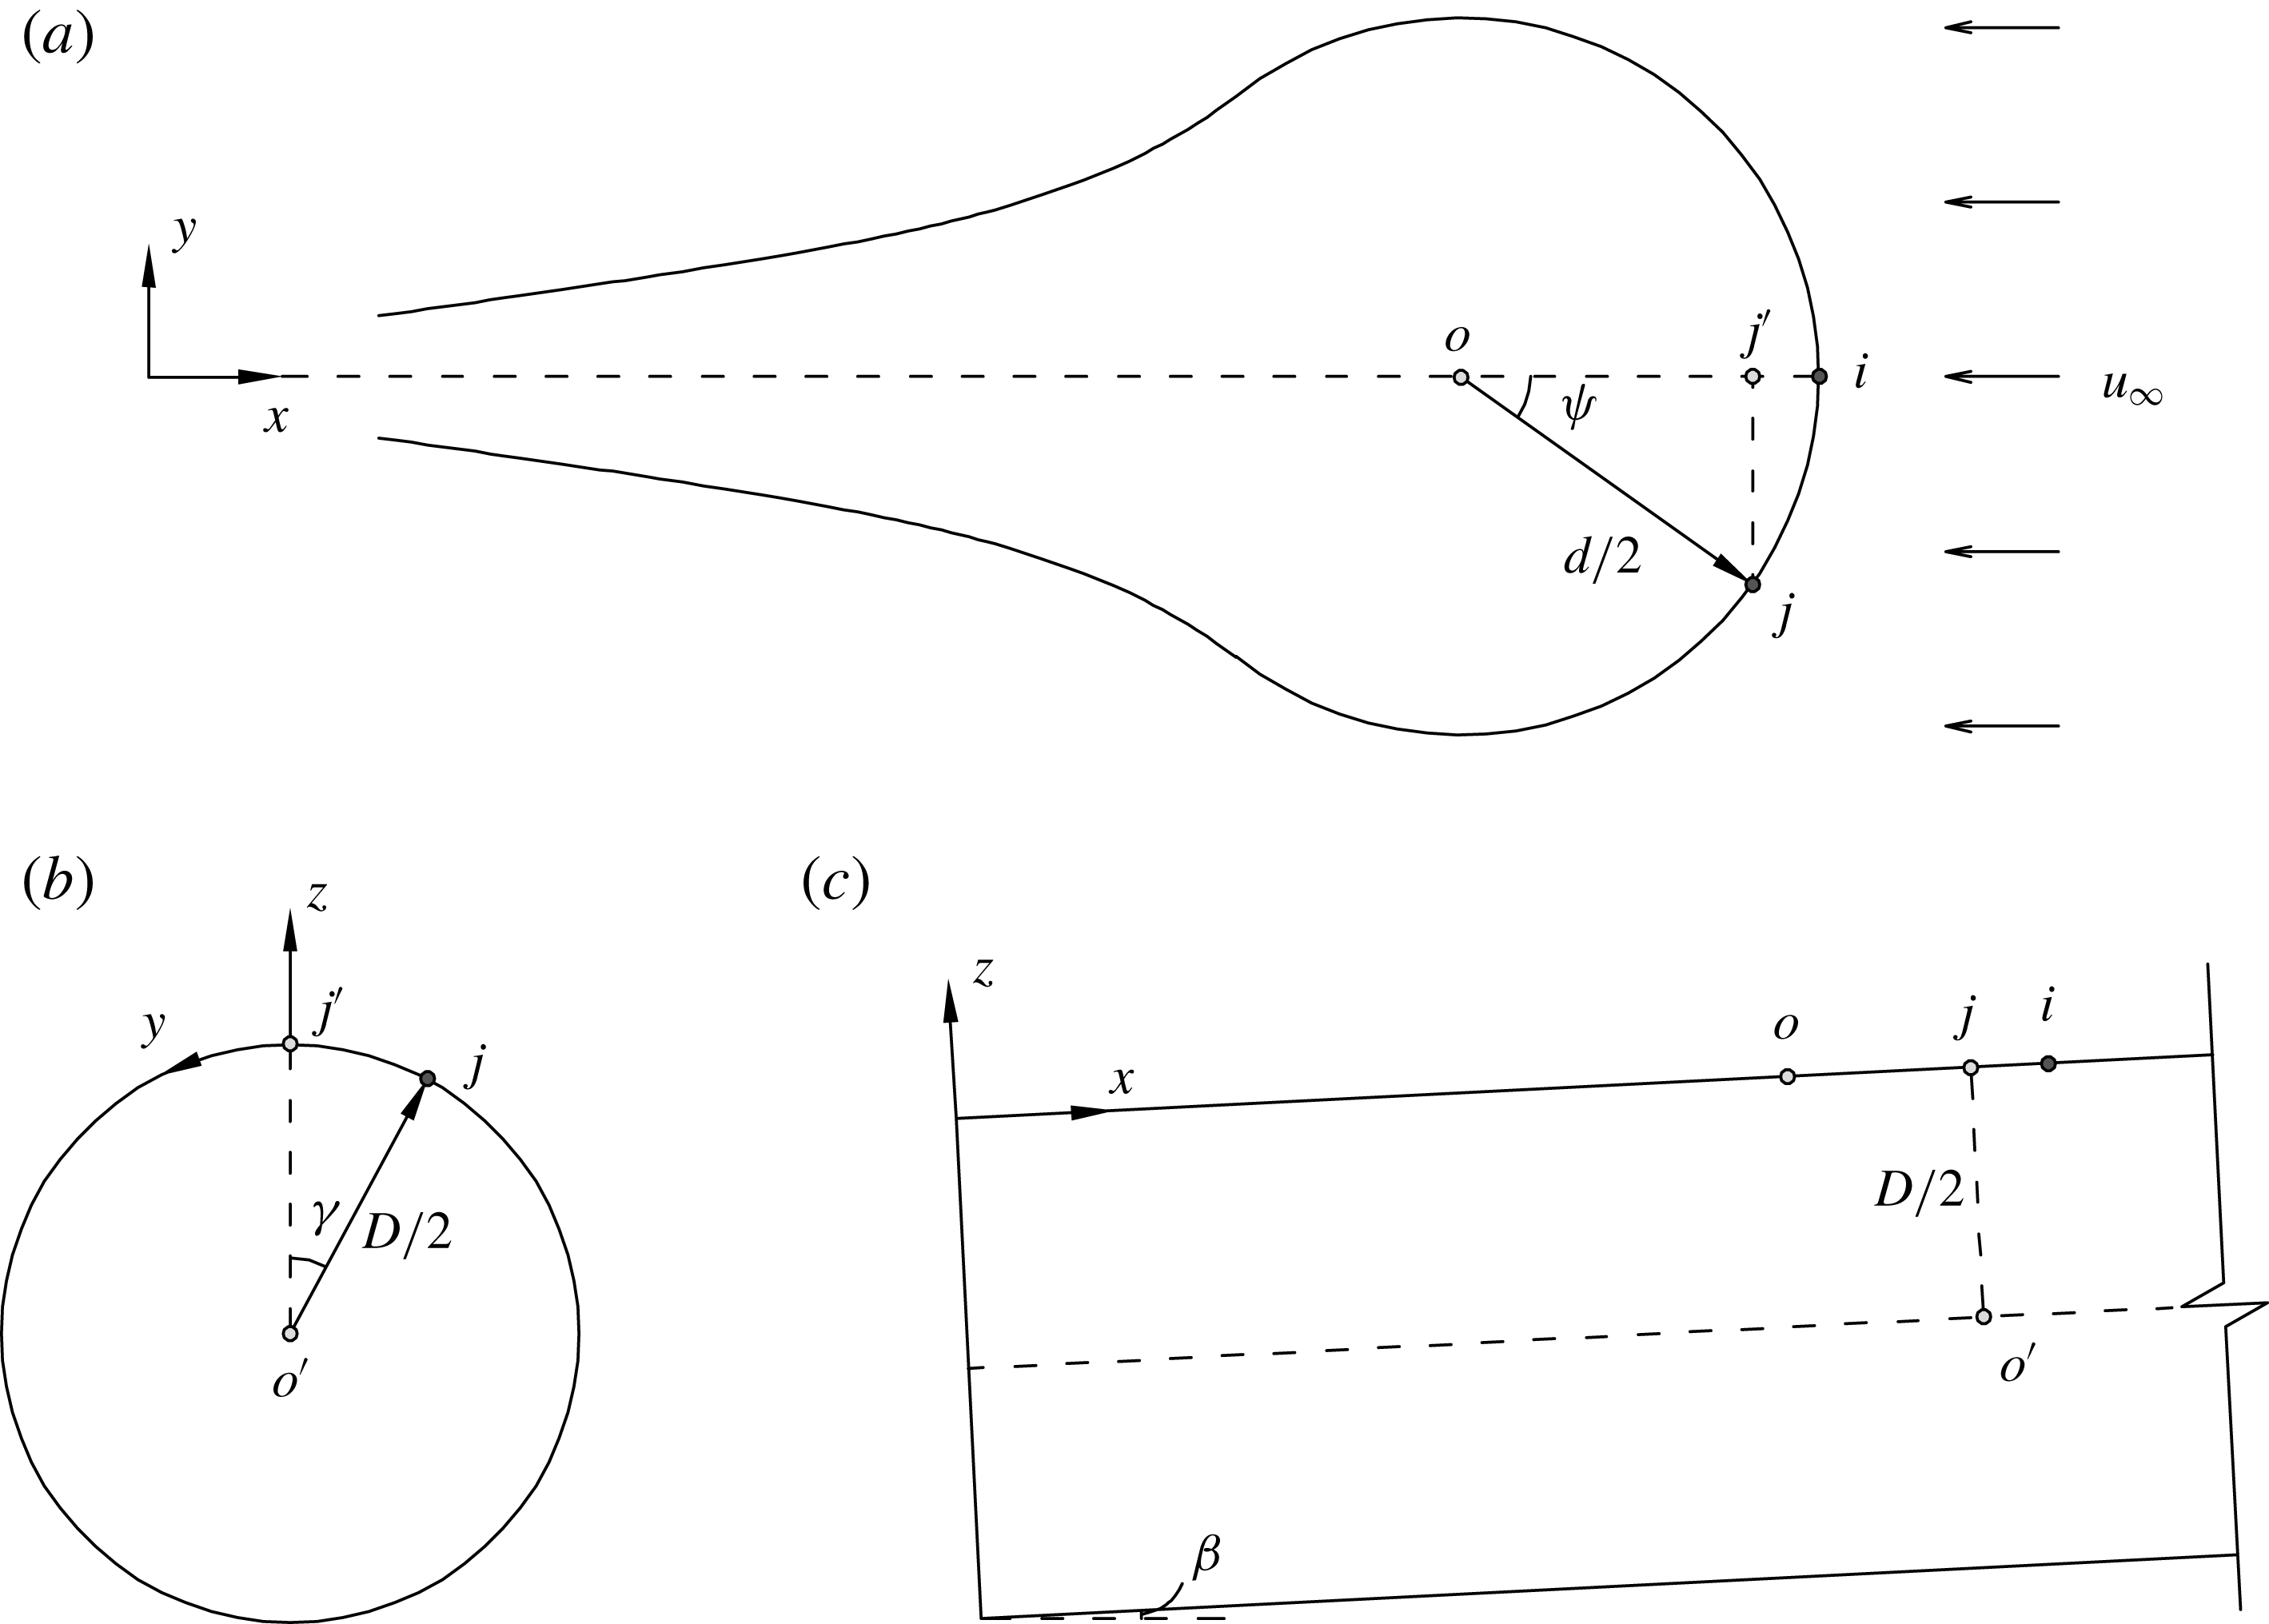
Figure 14. (a) The unrolled geometry of a bubble in the
![]() $x$
–
$x$
–
![]() $y$
plane, and the views of (b) a transversal cross-section in the
$y$
plane, and the views of (b) a transversal cross-section in the
![]() $y$
–
$y$
–
![]() $z$
plane and (c) a longitudinal cross-section in the
$z$
plane and (c) a longitudinal cross-section in the
![]() $x$
–
$x$
–
![]() $z$
plane.
$z$
plane.
We explore the mechanisms controlling the bubble shape and motion through a simple analysis. We define two polar coordinate systems: one based on the unrolled 2-D bubble cap geometry in the
![]() $x$
–
$x$
–
![]() $y$
plane (figure 14
a), and the other based on the transverse cross-section of the pipe in the
$y$
plane (figure 14
a), and the other based on the transverse cross-section of the pipe in the
![]() $y$
–
$y$
–
![]() $z$
plane (figure 14
b). By applying Bernoulli’s equation to the steady flow around the bubble cap, assumed to be irrotational with the surface tension being neglected, the following relationship is obtained:
$z$
plane (figure 14
b). By applying Bernoulli’s equation to the steady flow around the bubble cap, assumed to be irrotational with the surface tension being neglected, the following relationship is obtained:
where
![]() $u_{\unicode[STIX]{x1D713}}$
is the relative velocity of the surrounding liquid to the bubble at a point with a polar angle of
$u_{\unicode[STIX]{x1D713}}$
is the relative velocity of the surrounding liquid to the bubble at a point with a polar angle of
![]() $\unicode[STIX]{x1D713}$
, and
$\unicode[STIX]{x1D713}$
, and
![]() $\unicode[STIX]{x1D6FE}$
is the polar angle in the coordinate system of the transverse cross-section. We assume that flow around the bubble cap is similar to that seen around a circular cylinder to a first approximation (Collins Reference Collins1967a
). This flow field can be solved using the stream function and velocity potential, with the following relationship obtained (Wilkes Reference Wilkes2006):
$\unicode[STIX]{x1D6FE}$
is the polar angle in the coordinate system of the transverse cross-section. We assume that flow around the bubble cap is similar to that seen around a circular cylinder to a first approximation (Collins Reference Collins1967a
). This flow field can be solved using the stream function and velocity potential, with the following relationship obtained (Wilkes Reference Wilkes2006):
where
![]() $u_{\infty }$
is the far-field relative velocity of the flow to the bubble. By combining (5.1), (5.2) and the relation
$u_{\infty }$
is the far-field relative velocity of the flow to the bubble. By combining (5.1), (5.2) and the relation
![]() $(d/2)\sin \unicode[STIX]{x1D713}=(D/2)\unicode[STIX]{x1D6FE}$
(see figure 14
a,b), we obtain
$(d/2)\sin \unicode[STIX]{x1D713}=(D/2)\unicode[STIX]{x1D6FE}$
(see figure 14
a,b), we obtain
In the limit of small
![]() $\unicode[STIX]{x1D6FE}$
and
$\unicode[STIX]{x1D6FE}$
and
![]() $\unicode[STIX]{x1D713}$
, equation (5.3) becomes
$\unicode[STIX]{x1D713}$
, equation (5.3) becomes
If
![]() $r\rightarrow \infty$
,
$r\rightarrow \infty$
,
![]() $\unicode[STIX]{x1D6FD}=90^{\circ }$
, then solution (5.4) converges to that for plane bubbles rising through a quiescent liquid between vertical, parallel flat plates, i.e.
$\unicode[STIX]{x1D6FD}=90^{\circ }$
, then solution (5.4) converges to that for plane bubbles rising through a quiescent liquid between vertical, parallel flat plates, i.e.
![]() $0.5(gd/2)^{1/2}$
(Davies & Taylor Reference Davies and Taylor1950; Collins Reference Collins1965a
).
$0.5(gd/2)^{1/2}$
(Davies & Taylor Reference Davies and Taylor1950; Collins Reference Collins1965a
).
For the simultaneous gas–liquid flow here, the bubble terminal velocity
![]() $u$
is calculated as (Griffith & Wallis Reference Griffith and Wallis1961)
$u$
is calculated as (Griffith & Wallis Reference Griffith and Wallis1961)
where
![]() $v_{i}$
is the superficial inflow velocity (table 1). We substitute the measured diameters of bubble cap from the experimental/numerical results into (5.5) to derive the predicted bubble terminal velocity
$v_{i}$
is the superficial inflow velocity (table 1). We substitute the measured diameters of bubble cap from the experimental/numerical results into (5.5) to derive the predicted bubble terminal velocity
![]() $u_{pred}$
. The predicted values are compared to the actual velocity
$u_{pred}$
. The predicted values are compared to the actual velocity
![]() $u_{meas}$
measured in the experiment and simulation. It can be seen that our simplified analysis gives a good estimation of the bubble velocity in thin annuli for different inclination angles, pipe diameters and gap thicknesses (figure 15).
$u_{meas}$
measured in the experiment and simulation. It can be seen that our simplified analysis gives a good estimation of the bubble velocity in thin annuli for different inclination angles, pipe diameters and gap thicknesses (figure 15).
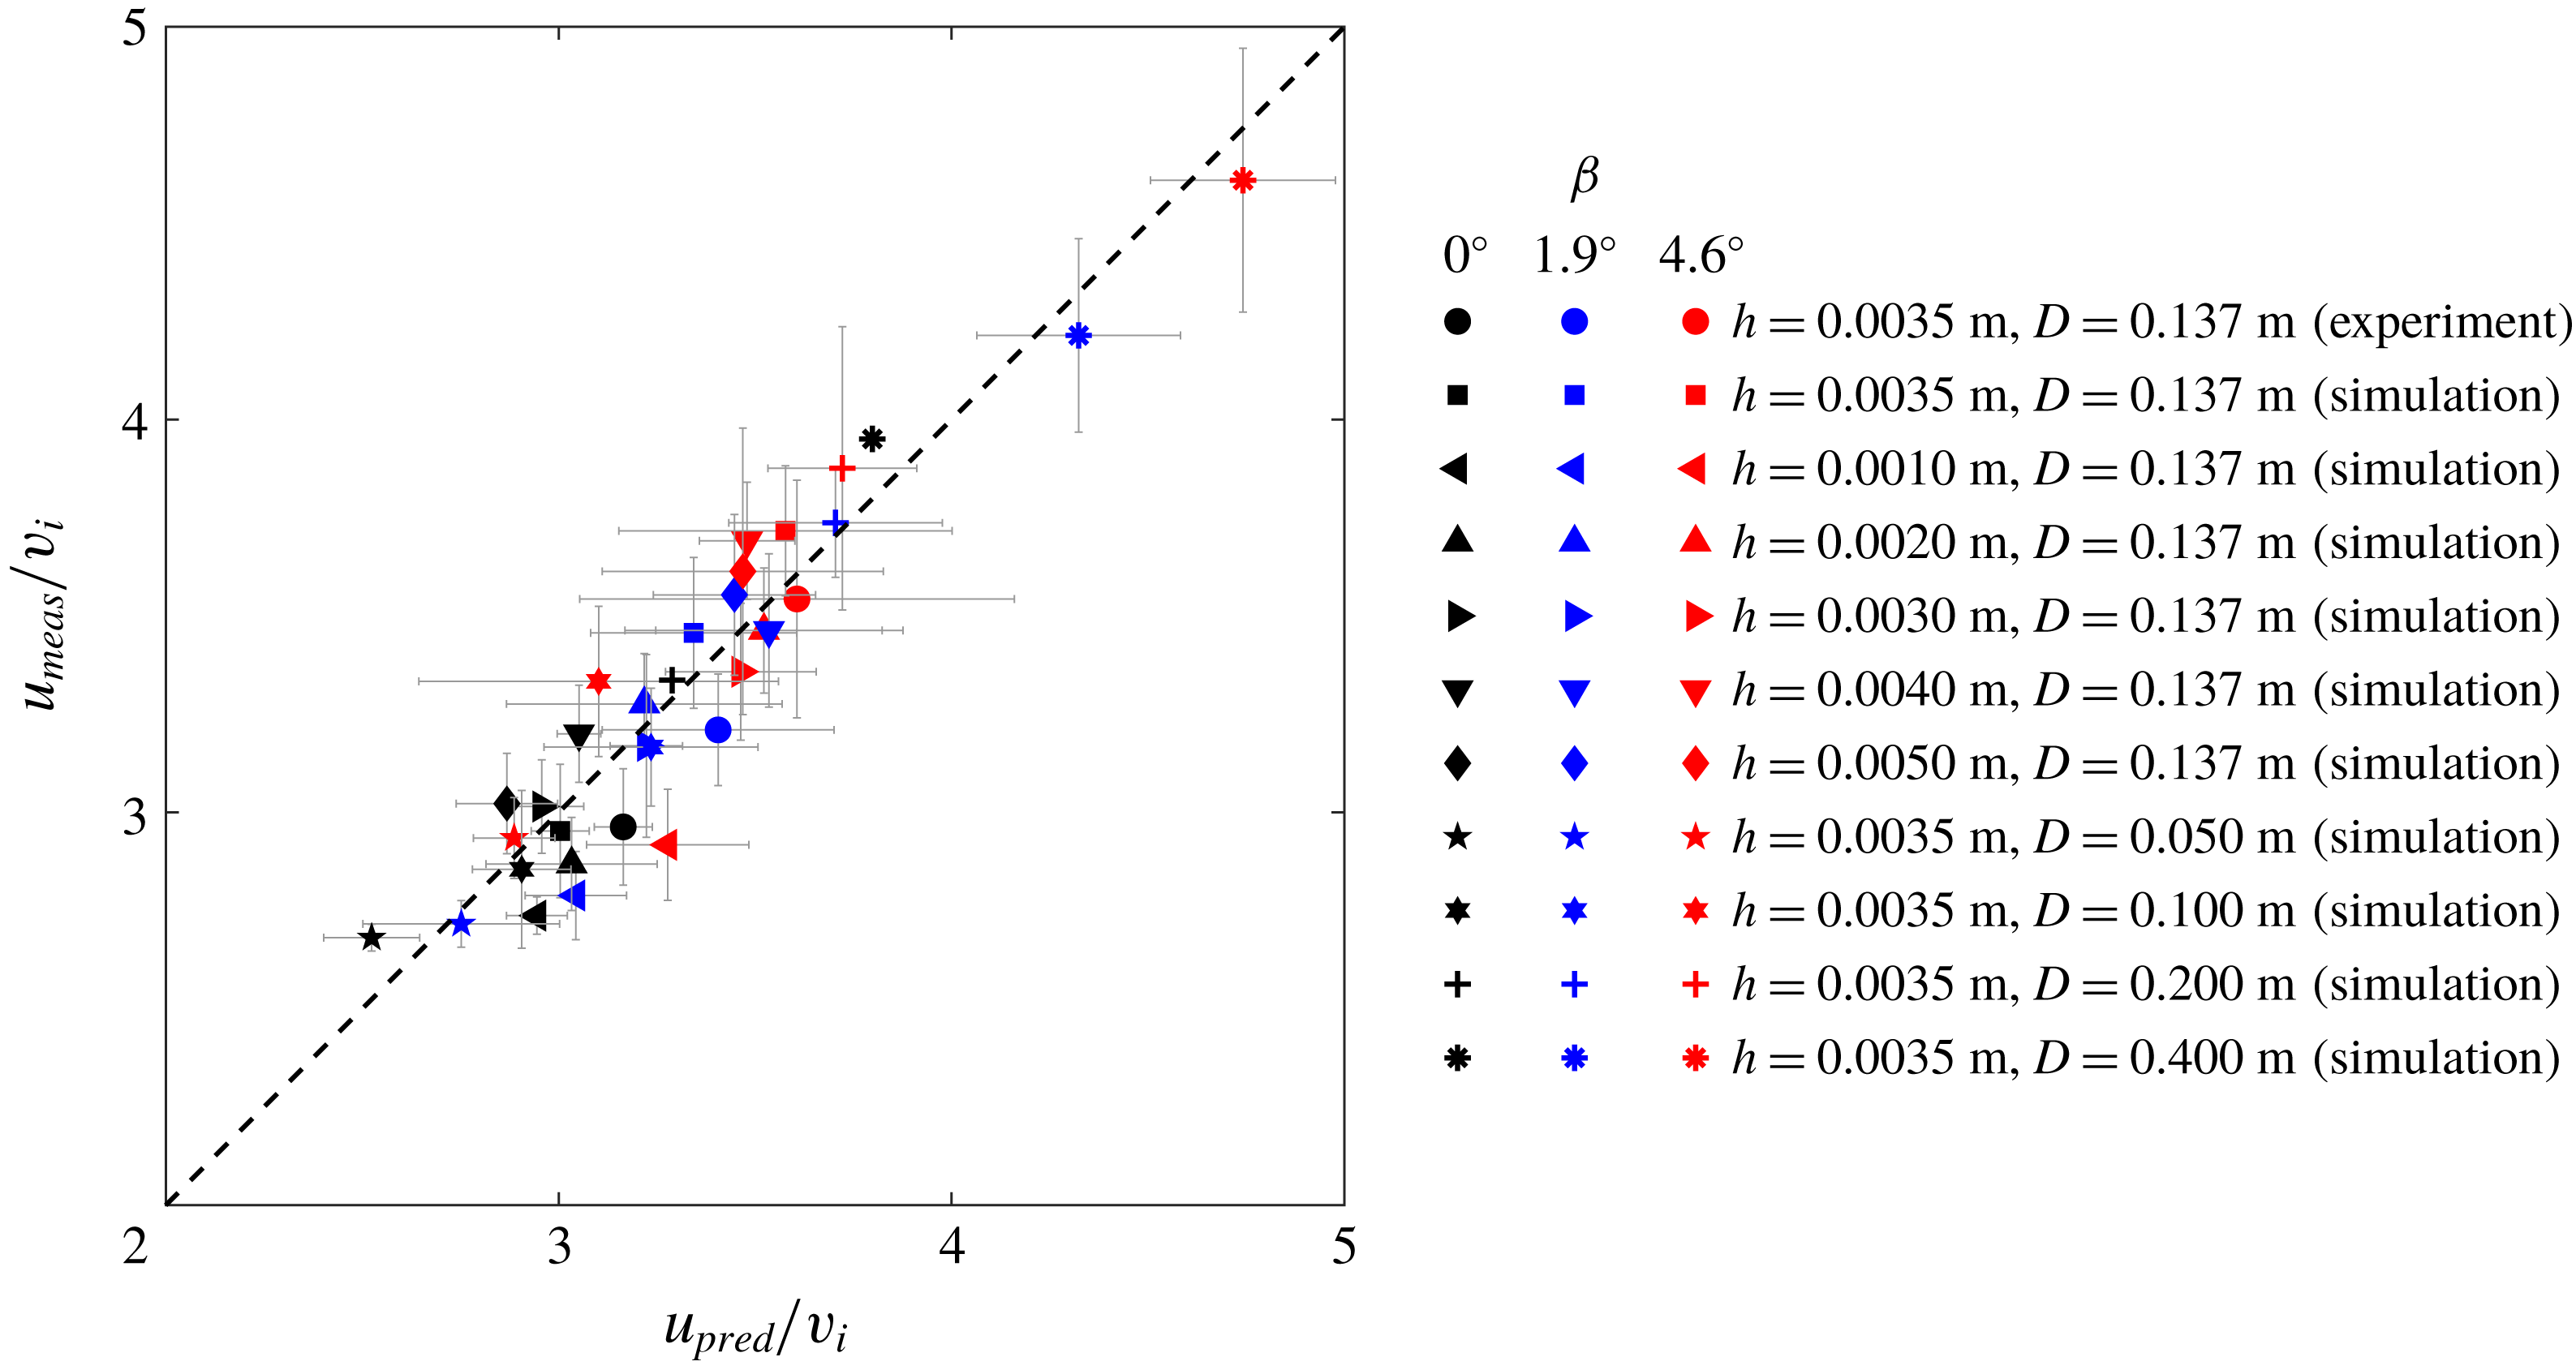
Figure 15. Comparison of the predicted terminal velocity
![]() $u_{pred}$
from (5.5) and the measured terminal velocity
$u_{pred}$
from (5.5) and the measured terminal velocity
![]() $u_{meas}$
from experiments and simulations for different configurations of pipe diameter
$u_{meas}$
from experiments and simulations for different configurations of pipe diameter
![]() $D$
, gap thickness
$D$
, gap thickness
![]() $h$
and inclination angle
$h$
and inclination angle
![]() $\unicode[STIX]{x1D6FD}$
. The velocity values are normalised by the superficial inflow velocity
$\unicode[STIX]{x1D6FD}$
. The velocity values are normalised by the superficial inflow velocity
![]() $v_{i}$
.
$v_{i}$
.
We then identify the following dimensionless groups of the annulus system:
where the two inverse Froude numbers,
![]() $\hat{Fr}_{\Vert }^{-1}$
and
$\hat{Fr}_{\Vert }^{-1}$
and
![]() $\hat{Fr}_{\bot }^{-1}$
, are related to the effects of gravity parallel and perpendicular to the flow direction, respectively, and
$\hat{Fr}_{\bot }^{-1}$
, are related to the effects of gravity parallel and perpendicular to the flow direction, respectively, and
![]() $\hat{\unicode[STIX]{x1D716}}$
characterises the effects of confinement associated with the annulus. We also characterise the bubble shape and motion based on the bubble aspect ratio
$\hat{\unicode[STIX]{x1D716}}$
characterises the effects of confinement associated with the annulus. We also characterise the bubble shape and motion based on the bubble aspect ratio
![]() $l/d$
, the bubble Reynolds number
$l/d$
, the bubble Reynolds number
![]() $Re=\unicode[STIX]{x1D70C}_{w}u_{\infty }d/\unicode[STIX]{x1D707}_{w}$
and the gap Reynolds number
$Re=\unicode[STIX]{x1D70C}_{w}u_{\infty }d/\unicode[STIX]{x1D707}_{w}$
and the gap Reynolds number
![]() $Re(h/d)^{2}$
. Here,
$Re(h/d)^{2}$
. Here,
![]() $u_{\infty }$
is used because the bubble behaviour is governed by the relative motion between the two fluids.
$u_{\infty }$
is used because the bubble behaviour is governed by the relative motion between the two fluids.
As shown in figure 16(a), as
![]() $\hat{Fr}_{\Vert }^{-1}$
increases, the bubble shape becomes less elongated, i.e.
$\hat{Fr}_{\Vert }^{-1}$
increases, the bubble shape becomes less elongated, i.e.
![]() $l/d$
approaches unity, since the gravitational component parallel to the flow direction causes an increased pressure at the bubble rear, which tends to separate the bubble and reduce the bubble length. As
$l/d$
approaches unity, since the gravitational component parallel to the flow direction causes an increased pressure at the bubble rear, which tends to separate the bubble and reduce the bubble length. As
![]() $\hat{Fr}_{\bot }^{-1}$
increases,
$\hat{Fr}_{\bot }^{-1}$
increases,
![]() $Re$
increases (figure 16
b), indicating inertia becomes more dominant. This is because, for the annuli with small inclinations to the horizontal, the gravitational component perpendicular to the flow direction mainly controls the flow field around the bubble cap, as can be expected from (5.1). As the annulus confinement decreases (i.e.
$Re$
increases (figure 16
b), indicating inertia becomes more dominant. This is because, for the annuli with small inclinations to the horizontal, the gravitational component perpendicular to the flow direction mainly controls the flow field around the bubble cap, as can be expected from (5.1). As the annulus confinement decreases (i.e.
![]() $\hat{\unicode[STIX]{x1D716}}$
increases), the gap Reynolds number
$\hat{\unicode[STIX]{x1D716}}$
increases), the gap Reynolds number
![]() $Re(h/d)^{2}$
increases (figure 16
c), due to the reduced viscous effect across the gap, reaching a plateau with increasing
$Re(h/d)^{2}$
increases (figure 16
c), due to the reduced viscous effect across the gap, reaching a plateau with increasing
![]() $\hat{\unicode[STIX]{x1D716}}$
.
$\hat{\unicode[STIX]{x1D716}}$
.

Figure 16. (a) Variation of the bubble aspect ratio
![]() $l/d$
with the inverse Froude number
$l/d$
with the inverse Froude number
![]() $\hat{Fr}_{\Vert }^{-1}$
. (b) Variation of the bubble Reynolds number
$\hat{Fr}_{\Vert }^{-1}$
. (b) Variation of the bubble Reynolds number
![]() $Re$
with the inverse Froude number
$Re$
with the inverse Froude number
![]() $\hat{Fr}_{\bot }^{-1}$
. (c) Variation of the gap Reynolds number
$\hat{Fr}_{\bot }^{-1}$
. (c) Variation of the gap Reynolds number
![]() $Re(h/d)^{2}$
with the confinement ratio
$Re(h/d)^{2}$
with the confinement ratio
![]() $\hat{\unicode[STIX]{x1D716}}$
. Refer to figure 15 for the legend.
$\hat{\unicode[STIX]{x1D716}}$
. Refer to figure 15 for the legend.
6 Discussion and conclusions
In this paper, we presented an experimental and numerical investigation into the shape and motion of gas bubbles in a liquid flowing through a horizontal or slightly inclined thin annulus. We have focused on the regime where inertia is important (the gap Reynolds number is close to or larger than unity) and the bubble behaviour is governed by the complex interplay of inertia, gravity, viscosity and surface tension. Bubbles in the horizontal annulus developed a unique ‘tadpole-like’ shape featuring a semi-circular cap and a highly stretched tail. As the annulus was inclined with respect to the horizontal, the length of the bubble decreased. We developed a gap-averaged, 2-D numerical model to represent the 3-D flow dynamics, which achieved a close match to the experimental data for different small inclinations. The numerical model was used to further elucidate the effects of gap thickness and pipe diameter on the bubble evolution in thin annuli. We found that the bubble velocity is strongly correlated to the cap structure, but is independent of the bubble length, as has also been reported for bubbles in tubes (Davies & Taylor Reference Davies and Taylor1950; Zukoski Reference Zukoski1966; Fabre & Liné Reference Fabre and Liné1992; Viana et al. Reference Viana, Pardo, Yánez, Trallero and Joseph2003) and between parallel flat plates (Grace & Harrison Reference Grace and Harrison1967; Maneri & Zuber Reference Maneri and Zuber1974; Hills Reference Hills1975; Couet & Strumolo Reference Couet and Strumolo1987). We reported that the elongated bubble shape in horizontal annuli is due to the buoyancy which causes the bubbles to spread along the top of the annulus. The gravitational component along the flow direction, which increases as the annulus is inclined, impinges the liquid slug and causes a reduction of the bubble tail. The gravitational component perpendicular to the flow direction controls the bubble motion and the cap structure. These mechanisms produce the unique tadpole-like shape with a sharp tail tip because of the cross-sectional curvature of the annulus channel, in contrast to the bubble shape with a tongue-like rear seen in flows between parallel flat plates (Maneri & Zuber Reference Maneri and Zuber1974; Couet & Strumolo Reference Couet and Strumolo1987).
It is remarkable that the 2-D numerical model well captured the bubble evolution and interaction behaviour as observed in the experimental annulus. It is still worth mentioning that some complex 3-D effects were not fully represented in the gap-averaged formulation, such as the detailed transverse shape of the bubble cap and tail within the gap as well as the influence of the cross-gap velocity/gravity component (Oliveira & Meiburg Reference Oliveira and Meiburg2011), which require direct three-dimensional but computationally very expensive numerical simulations. Such limitations of the 2-D model may explain the discrepancy of the bubble geometry, e.g. in the region near the bubble neck (figure 6), between our experimental and numerical results. The gap-averaged 2-D model assumed an absence of liquid films between the bubble and channel walls. We examined different mathematical formulations that account for the presence of liquid films (Pitts Reference Pitts1980; McLean & Saffman Reference McLean and Saffman1981; Park & Homsy Reference Park and Homsy1984; Reinelt Reference Reinelt1987a
; Kopf-Sill & Homsy Reference Kopf-Sill and Homsy1988), which however resulted in a poor prediction of the experimentally observed bubble patterns (the simulated bubbles were much smaller, probably due to an overestimation of the curvature of the air–water interface across the gap). Saffman & Tanveer (Reference Saffman and Tanveer1989) also reported that the thin film hypothesis, compared to the contact angle assumption, gave a less consistent prediction of bubble shapes in Hele-Shaw cells. Furthermore, we did not see any evidence of such films in the experiments. The thickness of thin films (if present under no-gravity conditions) is estimated to be
![]() $\unicode[STIX]{x1D6FF}/h\approx 0.67(\unicode[STIX]{x1D707}_{w}u_{\infty }/\unicode[STIX]{x1D70E})^{2/3}$
(Park & Homsy Reference Park and Homsy1984; Reinelt Reference Reinelt1987a
; Klaseboer, Gupta & Manica Reference Klaseboer, Gupta and Manica2014), which may however be reduced further in the top region of the annulus under gravity-induced drainage downwards along the peripheral direction (Tso & Sugawara Reference Tso and Sugawara1990; Paras & Karabelas Reference Paras and Karabelas1991). Thus, we expect that
$\unicode[STIX]{x1D6FF}/h\approx 0.67(\unicode[STIX]{x1D707}_{w}u_{\infty }/\unicode[STIX]{x1D70E})^{2/3}$
(Park & Homsy Reference Park and Homsy1984; Reinelt Reference Reinelt1987a
; Klaseboer, Gupta & Manica Reference Klaseboer, Gupta and Manica2014), which may however be reduced further in the top region of the annulus under gravity-induced drainage downwards along the peripheral direction (Tso & Sugawara Reference Tso and Sugawara1990; Paras & Karabelas Reference Paras and Karabelas1991). Thus, we expect that
![]() $\unicode[STIX]{x1D6FF}$
may be close to the scale of the surface roughness of the Plexiglas and stainless steel walls, i.e. around 0.01 mm (Li et al.
Reference Li, Su, Kuhn, Meusel, Ammann, Shao, Pöschl and Cheng2018). We therefore do not expect the films to persist in a stable way. The observed contact angle hysteresis in our study may also be attributed to the presence of pronounced surface roughness effects (Dussan Reference Dussan1979). The phenomenon that air wets the channel wall has also been found between the air bubble and the upper wall of a horizontal/slightly inclined tube (Fabre & Liné Reference Fabre and Liné1992) or Hele-Shaw cell (Maneri & Zuber Reference Maneri and Zuber1974). We suggest that a good approximation of the gap-averaged 2-D model to 3-D flow holds if the cross-gap effects are minor.
$\unicode[STIX]{x1D6FF}$
may be close to the scale of the surface roughness of the Plexiglas and stainless steel walls, i.e. around 0.01 mm (Li et al.
Reference Li, Su, Kuhn, Meusel, Ammann, Shao, Pöschl and Cheng2018). We therefore do not expect the films to persist in a stable way. The observed contact angle hysteresis in our study may also be attributed to the presence of pronounced surface roughness effects (Dussan Reference Dussan1979). The phenomenon that air wets the channel wall has also been found between the air bubble and the upper wall of a horizontal/slightly inclined tube (Fabre & Liné Reference Fabre and Liné1992) or Hele-Shaw cell (Maneri & Zuber Reference Maneri and Zuber1974). We suggest that a good approximation of the gap-averaged 2-D model to 3-D flow holds if the cross-gap effects are minor.
Acknowledgements
We would like to acknowledge Statoil ASA for funding Q.L., M.D.J., C.C.P., O.K.M. and A.H.M., and for granting permission to publish this work. We thank K. Årland from Statoil ASA for project management. O.K.M. and C.C.P. acknowledge the funding provided by the Engineering and Physical Sciences Research Council (EPSRC) through the Programme Grant MEMPHIS (grant EP/K003976/1). D.P. is grateful to the EPSRC (grant EP/M012794/1). P.S. thanks ExxonMobil and the EPSRC (grant EP/R005761/1) for funding. No data were generated in the course of this work. For further information, please contact the corresponding author Q.L. (email: [email protected] or [email protected]), the AMCG Group (http://www.imperial.ac.uk/earth-science/research/research-groups/amcg/), the NORMS group (http://www.imperial.ac.uk/earth-science/research/research-groups/norms) or the Matar Fluids Group (http://www.imperial.ac.uk/matar-fluids-group).


